
ABSTRACT
The affective state of an individual can be determined using physiological parameters; an important metric that can then be extracted is attention. Looking more closely at compact EEGs, algorithms have been implemented in such devices that can measure the attention and other affective states of the user. No information about these algorithms is available; are these feature classification algorithms accurate? An experiment was conducted with 23 subjects who utilized a pedagogical agent to learn the syntax of the programming language Java while having their attention measured by the NeuroSky MindWave Mobile 2. Using a concurrent validity approach, the attention values measured were compared to band powers, as well as measures of task performance. The results of the experiment were in part successful and supportive of the claim that the EEG device’s attention algorithm does in fact represent a user’s attention accurately. The results of the analysis based on raw data captured from the device were consistent with previous literature. Inconclusive results were obtained relating to task performance and attention.
Introduction
Learning analytics is concerned with collecting and analysing data during the learning process in order to predict, inform stakeholders, and consequently improve learning outcomes (Sinha et al., Citation2014). Thus, one of the challenges of learning analytics is collecting data about learners and developing data-intensive analytics methods (Knight & Buckinghamm Shum, Citation2014). In addition to cognitive data, physical data (e.g. clicks), or social network data (i.e. data related to building communities (Hoppe, Citation2017), learning analytics may exploit physiological data in order to better understand the cognitive learning process of learners.
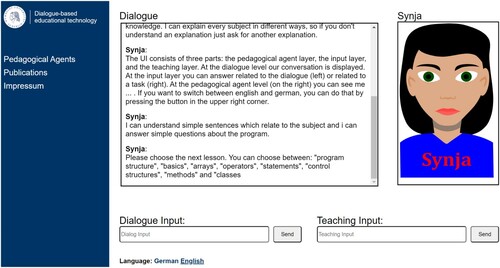
Figure 1. The user interface of the pedagogical agent for learning Java syntax.
According to James (Citation1890), a psychologist and a philosopher, attention is ‘the taking possession by the mind, in clear and vivid form, of one out of what may seem several simultaneously possible objects or trains of thought … It implies withdrawal from some things in order to deal effectively with others.'
There are many dimensions of attention, resulting in its categorization into four main types (McDowd et al., Citation1991): sustained attention, selective attention, alternating attention and divided attention. Sustained attention, otherwise known as ‘vigilance’, can be defined as maintaining focus with a moderate level of mental effort over an extended period of time (Oken et al., Citation2006). Selective attention is the process of actively selecting focus on one stimulus, including the external environment or internal sources, while filtering out others (Johnston & Dark, Citation1986). Alternating attention is the ability to switch back and forth between tasks that require different cognitive processes (Sohlberg & Mateer, Citation1987). Finally, divided attention, commonly known as ‘multi-tasking', is the activity of processing more than one stimulus at a time or reacting to multiple stimuli simultaneously.
‘Sustained attention' is the focus of investigation in this research, as this type of attention is most highly related to learning and education. It has been shown in various studies (Gould et al., Citation2011; Klimesch et al., Citation1998; Makeig & Jung, Citation1996; O'Connell et al., Citation2009), not to mention from common human experience, that being able to focus and concentrate on a task results in greater task performance, whether this is at school, on the job, during free time, while driving, etc. Attention is a crucial factor in the advancement of an individual’s cognitive skills, being a reason as to why it has been extensively studied and researched in the fields of psychology, neurology, biology, and physiology.
Monitoring attention along with processing its data has been accomplished by means of self-reports (along with reports from others) and brain–computer interfaces (BCI). Many applications have been developed that use data pertaining to attention in the fields of education, healthcare, and entertainment, to name a few (Al-Nafjan et al., Citation2017). In this paper, we will mainly focus on the realm of education and learning.
With the popularization of ‘flipped' learning (Szafir & Mutlu, Citation2013), in which one learns via online tools, such as online lectures or intelligent tutoring systems rather than by means of traditional methods, BCI applications, namely ‘bio-cybernetic loops' (Pope et al., Citation2014) can be utilized to promote focused learning in (and outside) the classroom. This bio-cybernetic loop corresponds to the retrieval and processing of physiological signals, in this case, the electroencephalography signals indicating attention, and the subsequent production of biofeedback. The user can, prompted by the biofeedback, change behavior and consequently, their cognitive state. Using technology that can measure a student’s attention can appropriately guide how the learning style should be adapted to increase vigilance and, therefore, deliver optimized results for the individual. This design demonstrates the great potential in measuring physiological signals, such as those that measure attention and then providing feedback, to effectively increase information retention and improve concentration in students. However, if the values used in neurofeedback are a false representation of the student’s attention, this could result in the adaptation of the system that does not fit the student’s needs. The learning process could be hindered by altering tasks to those that are either too difficult or too easy, preventing a proper balance of engagement and motivation.
The implementation of BCIs has made it possible to connect physiological signals to technology, and the accuracy of such algorithms pertaining to attention is of utmost importance. Affordable compact physiological sensors have the potential to help bring educational tools to a wider range of users, thus supporting the notion that algorithms to calculate attention levels should be as accurate as possible.
Research question
Many compact EEGs are available on the market today including NeuroSky, Emotiv EPOC, Muse, and OpenBCI (Farnsworth, Citation2017). Such devices have been tested in the past (Crowley et al., Citation2010; Maskeliunas et al., Citation2016; Rebolledo-Mendez et al., Citation2009; Sałabun, Citation2014), however, very little testing has been conducted on the accuracy of algorithms implemented in these technologies that determine the attention level of the user. In particular, the NeuroSky biometric ‘eSense Attention' algorithm has not yet been examined extensively.
One study that evaluated the accuracy of the attention algorithm implemented in the NeuroSky’s EEG concluded that an accuracy of 78% was reached while conducting a psychological stress-inducing test (Crowley et al., Citation2010). Despite this, no correlation between low cognitive performance (i.e. making errors during the test) and the change in attention was found.
The aim of the research work presented in this paper is to test if the ‘eSense Attention' algorithm corresponds to other physiological metrics, as well as see how it correlates to performance while conducting a cognitive problem-solving task to therefore judge whether it can be considered accurate. Thus, the research question to be proposed is: Can EEG devices differentiate attention values between incorrect and correct solutions for problem-solving tasks?
State of the art of physiological approaches to measuring attention
There have been many attempts at determining the correlation between physiological metrics and attention. Some examples of physiological metrics that have played a part in measuring attention levels are heart rate variability, frontal EEG asymmetry, and EEG power bands including EEG-Alpha, EEG-Beta, EEG-Delta, and EEG-Theta. Heart rate variability is the changing variance between consecutive heartbeats. Frontal asymmetry is the difference between the total power in the EEG-Alpha band of the right and left hemispheres which can be used as a physiological response pattern to detect whether a learner is having an approaching or avoiding attitude (Karran & Kreplin, Citation2014).
Using Google Scholar, candidate publications were found using keywords such as ‘attention’, ‘physiology', ‘alpha oscillations', ‘vigilance', ‘ADHD', ‘frontal asymmetry', and ‘EEG'. In order to use relevant information and sources, only literature from the year 1980 and onwards was considered, as new and more modern technology and methods of measuring attention were introduced at this time. Next, the author(s) must have either explicitly declared which of the four named forms of attention were at hand (namely sustained, selective, alternating, or divided attention) or it was clear from the context which form of attention was implied. Additionally, the paper must have been based on scientific research, rather than used for commercial purposes, and was either in the form of a literature review or had a methodology including a procedure for the execution of an experiment. The paper must have described the relationship between attention and one (or more) physiological parameter(s) where a physiological signal and metric were at hand. Based on the criteria, out of the set of 75 papers, 24 papers were deemed relevant for the state of the art and the other 51 did not fulfill the requirements.
shows that concerning EEG signals, multiple authors concur that EEG-Alpha activity is related to sustained attention (O'Connell et al., Citation2009; Başar, Citation2012; Ray & Cole, Citation2020; Aftanas & Golocheikine, Citation2020). It is also concluded that increasing EEG-Beta reflects an increase in sustained attention (Linden et al., Citation1996; Oken et al., Citation2006) whereas EEG-Theta is disputed in its role with attention. Although Oken et al. (Citation2006) and Linden et al. (Citation1996) agreed that EEG-Theta increases with increased attention, Makeig and Jung (Citation1996) concluded the opposite.
Table 1. Correlation between EEG signal and sustained attention.
There has been extensive research on the connection between EEG signals and selective attention. Concerning the EEG-Alpha metric, alpha desynchronization (the decrease in the amplitude of the alpha waves and increase in frequency) is said by most authors to reflect attentional processes (Aftanas & Golocheikine, Citation2001; Gould et al., Citation2011; Herrmann & Knight, Citation2001; Herrmann et al., Citation2016; Klimesch et al., Citation1998). Other studies concluded that EEG-Alpha activity increases when rejection tasks are performed whereby someone completes a cognitive task and is internally attentive (Ray & Cole, Citation1985). EEG-Gamma waves are said to increase as a result of cognitive processing in response to a stimulus (Herrmann et al., Citation2016; Herrmann & Knight, Citation2001).
To our best knowledge, little research coupling physiological signals to alternating attention. Maunsell (Citation2015) reviewed studies about the correlation between alternating attention and neural activity and suggested that neural response latency decreases with an increase in attention. Similarly, research concerning the association between divided attention and physiological parameters is rare. The only research work on investigating divided attention in correlation with EEG power bands was conducted by Rodrigue et al. (Citation2015). The study was aimed to determine the level of divided attention of users using the Emotiv EPOC device and concluded that the (black-box) algorithm implemented in this device was considered and deemed reliable. However, it was not explicitly stated to which physiological parameter divided attention was correlated.
Research hypotheses
Based on the findings in the state of the art of neuroscience regarding attention, the ‘black-box' algorithm for classifying attention implemented in a compact EEG device (e.g. Neurosky’ Mindwave) can be examined. The hypotheses regarding EEG band power and attention are below:
Delta power increases with attention (Harmony, Citation2013; Harmony et al., Citation1996).
Theta power decreases with attention (Linden et al., Citation1996; Oken et al., Citation2006).
Low/high alpha power decreases with attention (O'Connell et al., Citation2009).
Low/high beta power increases with attention (Oken et al., Citation2006).
Methods
Materials
To conduct the study, the MindWave Mobile 2 was used, by which the neural oscillations were captured from the user’s scalp. The ThinkGear Connector software development kit (provided by Neurosky) then sent the digitized neural data from the serial port to an open network socket where the open-source software, OpenViBE (Renard et al., Citation2010), was used to display band power and attention as well as record the data, with the accompanying timestamps, into CSV files.
The physiological parameters from the MindWave Mobile 2 include: Time, Epoch, Electrode (i.e. raw data), Delta [Power], Theta [Power], Low Alpha [Power], High Alpha [Power], Low Beta [Power], High Beta [Power], Low Gamma [Power], and Mid Gamma [Power]. These powers are calculated based on the frequencies delta (1–3 Hz), theta (4–7 Hz), low alpha (8–9 Hz), high alpha (10–12 Hz), low beta (13–17 Hz), high beta (18–30 Hz), low gamma (31–40 Hz), and mid gamma (41–50 Hz), respectively (NeuroSky Inc., Citation2009). In addition to these data, the Mindwave Mobile 2 provides attention levels. No details are provided by the company Neurosky about how attention levels were computed, how the algorithm was developed, or how data artefacts were filtered. Thus, it is the motivation of this paper to examine whether the attention classification algorithm provided by Neurosky corresponds to findings in neuroscience.
In order to induce mental effort and sustained attention, a cognitive task was required to be chosen that could be performed over an extended period of time. As mentioned earlier, in the field of education, measuring attention and incorporating its metric into biofeedback can be used to enhance learning abilities and increase the student’s concentration and focus. It was deemed a good choice to utilize a pedagogical agent to conduct the experiment.
The pedagogical agent chosen is called ‘SYNJA'. This is an intelligent tutoring system with the aim of teaching Java syntax to those without prior experience. It consists of explanations and clarifications of concepts along with follow up tasks such as multiple-choice questions, fill in the blanks, and coding exercises. SYNJA can be interacted with in either the German or English language.
Two parameters from the pedagogical agent, a timestamp and a boolean value, were recorded in a separate CSV file. These parameters pertain to the time in which a question was answered and if it was answered correctly or incorrectly while using the pedagogical agent. This data was recorded in each session to be later cross-referenced with the CSV file from OpenViBE.
Additionally, a self-report for the user was used to evaluate their subjective attention. The pre-test was completed before and the post-test after the interaction with the pedagogical agent. The pre-test and post-test questionnaires consisted of six questions which were in accordance with the Diagnostic and Statistical Manual of Mental Disorders (DSM-IV) (American Psychiatric Association, Citation1994) pertaining to ADHD. The pre-test questions pertained to the user’s general qualities and behaviours as well as how they would gauge themselves, with respect to attention, in everyday tasks. The post-test questions pertained to the user’s behaviours specifically while using SYNJA (see Appendix A for questions, Appendix B for results).
Participants
Although the trial originally consisted of 27 volunteers in total, 23 trials were deemed valid to be further evaluated. This was due to the fact that no tasks were completed by two of the participants while using the pedagogical agent SYNJA; there was an extended loss of connection experienced during the interaction for one subject; and one participant withdrew consent to having their data used. 14 of these remaining participants were female and 9 were male. The participants were between the ages of 19 and 30 with the mean age being 24.17 ± 3.68 years of age. Roughly two thirds of the participants were university students.
Four of the 23 subjects chose to interact with SYNJA in the German language, all being native speakers, and the remaining 19 chose to use the English version of SYNJA. Fourteen of those participants speak English at a native level.
For optimal results, only individuals with little to no Java experience were considered to ensure that the task would not be repetitive or familiar, implying ‘automatic processing’ (Norman & Shallice, Citation1986), which could decrease the potential of the individual’s full concentration while completing the tasks. All participants claimed to be mentally healthy and none of the participants had ever been diagnosed with ADHD. It is to be noted though, that one participant had a family history of ADHD. Before completing the trial, each participant was asked to give consent to having their information and data used for this experiment. One participant withdrew consent to having their data used.
Procedure
In order to have consistent results across trials, a quiet and solitary place was provided for each participant to complete the questionnaires and interact with the pedagogical agent. Each trial was conducted the following way:
The participant was instructed on how to use the pedagogical agent (10 min).
The participant filled out the pre-test questionnaire (2 min).
The device was placed on the participant’s head and OpenViBE Acquisition Server was opened. The preferences were set to ensure the proper ports were being used as well as ensuring the metrics attention and band power were being collected by the MindWave Mobile 2. The user ID was assigned. OpenViBE Designer was opened, and the program was run to collect neural waves and record them in a CSV file labelled with the ID of the participant at the process (2 min).
The participant interacted with the pedagogical agent and learned one to two concepts (10 min).
The retrieval of cerebral oscillations was stopped and the CSV file from OpenViBE was written.
The participant completed the post-test questionnaire (2 min).
To test the reliability and effectiveness of the procedure, a pilot test was conducted with two subjects. Trials of the procedure were run so that potential technical difficulties could be anticipated and an approach to deal with faulty data could be established.
Step 4, that is, the intervention with the pedagogical agent that stimulates sustained attention, takes 10 minutes. This period is based on developed studies for sustained attention. Early studies on sustained attention were conducted involving relatively long tasks (>10 minutes) to examine task effects (Cristofori & Levin, Citation2015). These studies focused on performance variability across time. These tasks required continuous responses to targets and non-targets or responses only to infrequent targets. Robertson et al. (Citation1997) proposed a measure of ‘sustained attention to response task' that differs from typical vigilance tasks because it is brief (3 minutes), requires frequent responses (90% of trials), and does not require participants to suppress inappropriate stimuli. The tasks provided by the pedagogical agent in our experiment also have similar characteristics, that is, users are not required to suppress inappropriate stimuli. Thus, we choose the time period of 10 minutes for learning one to two Java concepts.
Data analysis
This paper proposes a concurrent validity method to validate test results based on a similarly conducted test with previously validated measures. This principle was used to support or reject the hypotheses proposed pertaining to the attention level measured by the MindWave Mobile 2 and different band powers.
Attention and band powers
Band power reflects the dominance of a certain band wave, or frequency, in a signal. The way in which the band power is calculated is by taking the average of the square of the sample; the units are expressed in volts squared per Hertz. However, as stated by the developers of NeuroSky, the power values that are calculated in its software are relative to themselves and one another and therefore have no units; instead, they are expressed in decibels. Hence, the band powers are only used to compare the strength of certain frequencies to others as well as to see the change in one frequency over a range of time.
The best-fitting statistical method to analyse the relationship between the various band powers and attention was a correlation, as what was being sought was the association between the band power value and the attention value. This attention value has unknown composition and therefore was examined if its values corresponded to previous research.
To obtain a normal distribution of the band power values for each sample, a log transformation was performed on the set of band powers. A Pearson's correlation was then used to compare the attention and the respective band power with one another. If the band powers correlate to the attention values in the ways stated above, then the null hypothesis can be refuted, and the attention algorithm, implemented by NeuroSky, regarding the band power activity, can be confirmed to be accurate.
Comparing attention at events of correctly vs. incorrectly answered questions
When using the pedagogical agent, the user was faced with questions based on the material they had just learned through explanations and lessons. As task performance is associated with attention, it can be deduced that high performance (responding correctly) corresponds to a high attention and likewise, low performance (responding incorrectly) corresponds to a lower attention (Sykes et al., Citation1973). This assumption is based on previous studies where sustained attention was measured by precision of response and reaction time while completing a concentration task (Falkenstein et al., Citation1991; Gould et al., Citation2011; Klimesch, Citation2012). ‘[S]peed and accuracy are used to determine an individual’s ability to sustain concentration' (Flehmig et al., Citation2007, p. 134). Therefore, the increased number of correct responses within a given span of time is used to assess vigilance.
Additionally, according to Ballard (Citation2001), participant characteristics are something to keep in mind when conducting a continuous performance task. To prevent biases, two different groups were observed as skill sets between subjects differed. The first group consisted of those subjects that had already had previous Java or general programming experience, and the second group consisted of those without any programming experience. As those already familiar with programming would understand basic concepts more easily, it is more likely that they would more quickly and accurately be able to answer questions using previous knowledge and experience.
The timeframe of 10 seconds leading up to the event of answering a question was considered since before a response is given, the brain is already activated in anticipation of the event of answering (i.e. contemplating the response and typing). Therefore, the accuracy of the attentiveness should not be hindered by taking values prior to events of incorrect and correct answers. In addition, this allows for a better estimation of the average attention at such events as more data points can be used in the case of only a few events per subject. To analyse this data and draw conclusions about the relationship between attention level, correct, and incorrect answers, an independent samples t-test was performed to compare the difference of two means for the attention values leading up to two types of event, namely correctly and incorrectly answered questions, for each subject.
The average attention level for the time leading up to correctly answered questions is expected to be greater than the average attention level for the time leading up to incorrectly answered questions. This can be reformulated by saying that the difference of two means of the attention values before the respective events will be significantly different than 0.
From the t-statistic, the p-value can be obtained by calculating the area under the tail of the t-statistic. Should the p-value be less than 0.05 and the sign of the t-statistic the same as that of the hypothesis (in this case positive), a deduction can then be made that the MindWave Mobile 2 accurately portrays a high level of attention.
Something to note is that not all users may have both types of events during their interaction with SYNJA. Some may have only correctly answered questions and others only incorrectly answered questions. Therefore, only those subjects who both answered at least one question correctly and one question incorrectly were considered.
Pre-test and post-test questionnaires
The pre-test and post-test questionnaires are used to later aid in providing explanations as to why certain phenomena occurred. In order to analyse the questionnaires completed by the subjects, each category in the Likert-type scale was assigned a number (Very often: 5; Often: 4; Sometimes: 3; Rarely: 2; Never: 1). The higher the score, the less attentive the subject judged themself to be (see Appendix A). A paired two-sampled t-test was performed with the scores of the pre-test, considering attention in general circumstances, and the post-test, considering attention while interacting with SYNJA, for each participant.
Results
Attention and band powers
The correlations between the various band powers and the attention value implemented by NeuroSky were calculated over 23 subjects, disregarding subjects 4, 17, 21 and 23. To support the proposed alternative hypotheses, one must take the positivity or negativity of the correlation coefficient and the p-value, which indicates the significance, into consideration. displays the results of the Pearson’s correlation performed on the attention values and log normalized band powers for each subject.
Table 2. Correlation values for eSense attention values and respective log.
Delta band power
As seen in , the correlation coefficient of attention and delta band power was significantly different than 0. For each subject, the p-value was less than 0.05, showing the clear correlation between attention and delta band power. As the results indicated a negative correlation between the delta band power and the attention level, the alternative hypothesis can be rejected, that the attention algorithm correlates positively to the delta band power as implemented in the MindWave Mobile 2.
Theta band power
The theta band power was expected to decrease with an increase in attention, and therefore result in a negative correlation coefficient. As the correlation coefficient for all 23 subjects was below zero and the p-value was less than 0.05, it can be deduced from the data that the null hypothesis is rejected and the alternative hypothesis for the relationship between theta band power and attention is supported.
Low alpha band power
Low alpha band power was expected to decrease with an increase in attention. For subjects with IDs 6, 9, 10, and 14, the relationship was not strong enough to reject the null hypothesis. For the other 19 subjects, the null hypothesis was rejected. In the two subjects, 6 and 10, where a positive correlation was calculated, the significance values were not great enough to confidently confirm the nature of the relationship. Therefore, it can be deduced from the rest of the results, that the correlation between low alpha band power and attention is negative. This is consistent with the assumption made based on previous studies.
High alpha band power
The alternative hypothesis regarding the high alpha band power was that it is negatively correlated to attention. The subjects 6, 10 and 13 displayed correlation coefficients of a positive sign. However, all three of these subjects had a p-value of greater than 0.05, indicating that these results were not significant. Aside from these three subjects, subjects 11 and 14 also did not show significant correlations. Therefore, the null hypothesis, that there is no significant correlation between attention and high alpha band power, for the subjects 6, 10, 11, 13, and 14 cannot be rejected. The remaining 18 subjects did indeed display a significant negative correlation. The results of these subjects reject the null hypothesis and support the alternative hypothesis.
Low beta band power
The low beta band power was expected to increase with the increase of attention. Significant results were only found for roughly half of the subjects. Subjects 2, 5, 6, 7, 8, 10, 12, 14, 16, 18, 19, 26, and 27 had significant correlations where the p-value was less than 0.05. The remaining subjects’ results were unable to reject the null hypothesis based on the p-value. Of the subjects named with significant correlation coefficients, those with negative correlations were subjects 2, 7, 8, 12, 16, 18, 19, 26, and 27, and those with positive correlations were subjects 5, 6, 10, and 14. Based on this data, a definite conclusion cannot be drawn as 9 of 23 correlation coefficients were not significant, and those that were indeed significant did not share the same results.
High beta band power
Lastly, high beta band power was expected to increase with the increase of attention. For all subjects, the correlation coefficient was positive, and 19 from 23 subjects had a significant correlation with the p-value being lower than 0.05. These results are in keeping with the alternative hypothesis regarding the high beta band power; the null hypothesis can be rejected for these subjects. Subjects 7, 16, 18 and 27, did not have a significant correlation coefficient and therefore the null hypothesis cannot be rejected for these. Nonetheless, as the vast majority of values were significant, there is strong evidence of a positive correlation.
Comparing attention at events of correctly vs. incorrectly answered questions
To compare the means of attention leading up to correctly answered questions and incorrectly answered questions, an independent samples t-test was performed whereby it was assumed that the sample sizes are different. Some sets of data had to be removed as only the datasets with subjects who answered at least one question correctly and one question incorrectly were included. Based on these criteria, subjects 11, 13, 15, 16 and 20 were removed from this analysis in addition to those whose data was already removed, namely subjects 17, 21, 23, leaving 18 subjects left to analyse.
As seen in , the proposed hypothesis was rejected in the cases of subjects 1, 2, 5, 18 and 25. The t-statistic for these subjects was greater than 0 and the p-value was less than 0.05, indicating significance. This entails that the mean value of attention preceding correctly answered questions was significantly greater than the mean value of attention preceding incorrectly answered questions. In the other cases, the null hypotheses could not be rejected.
Table 3. Results of independent samples t-test for mean attention of points preceding correct answers compared to mean attention of points preceding incorrect answers.
This result shows weak evidence of the significance of difference in attention when a question was answered correctly or incorrectly as only 5 of 18 subjects’ results rejected the null hypothesis.
As seen in , the proposed hypothesis was rejected in the cases of subjects 1, 2, 5, 18 and 25. The t-statistic for these subjects was greater than 0 and the p-value was less than 0.05, indicating significance. This entails that the mean value of attention preceding correctly answered questions was significantly greater than the mean value of attention preceding incorrectly answered questions. In the other cases, the null hypotheses could not be rejected. This result shows weak evidence of the significance of difference in attention when a question was answered correctly or incorrectly as only 5 of 18 subjects’ results rejected the null hypothesis.
Discussion and limitations of the study
The results of the testing of association between certain band powers were to an extent inconsistent with the hypotheses proposed. When taking delta band power into consideration, there was a significant negative correlation with attention for every subject. This is inconsistent with previous research from Harmony et al. (Citation1996) and Harmony (Citation2013) where delta power is said to increase with internal concentration. However, as delta oscillations have an inhibitory effect, as demonstrated in the case of deep sleep (Amzica & Steriade, Citation1998; Banquet & Sailhan, Citation1974), different attentional networks are inhibited while others are not. As in the studies mentioned, the internal processing was favoured while external stimuli were inhibited. Depending on the task at hand, and subsequent activation of different areas of the brain, an inhibitory effect can be observed where the sensor is measuring the brain oscillations. As in the case of the attention algorithm from NeuroSky, it can then be assumed that this inhibitory effect was anticipated.
As for the band powers of theta, low alpha and high alpha, the majority of the subjects’ results, and in the case of theta, all the subjects’ results, were significant enough to reject the null hypothesis, indicating that these did indeed correlate to attention as seen in previous studies. The attention algorithm implemented by NeuroSky does indeed display the relationship between these specific band powers and attention.
Regarding low beta band power, only 4 of 23 subjects had significant results that supported the alternative hypothesis. To speculate as to why such weak results were obtained from the data, one must consider that NeuroSky differentiates between low and high beta band power values whereas previous studies did not. As the high beta band power did indeed significantly positively correlate to attention in most of the cases, supporting the alternative hypothesis, an explanation was needed as to why low beta band powers did not correlate in the same way. Perhaps the developers did not take low beta into consideration when calculating the attention value. Another study suggested that attention could be measured using a ratio between the sum of the power spectral densities of the alpha and beta bands, respectively (Liu et al., Citation2013). It was also suggested that beta does not directly have an effect on attentiveness but rather, the relationship between the alpha and beta bands is of high importance. In the case of the MindWave Mobile 2, this could be an explanation for the unexpected results of the correlation between low band power and attention, since the alpha band power was not taken into consideration when observing the beta band power. In conclusion, to account for the discrepancy between the expected and actual correlation between low beta power and attention, the developers of NeuroSky may have laid more importance on the high beta band rather than the lower to compute the attention value, or, as mentioned from Liu et al. (Citation2013), a ratio rather than a direct relationship between band powers and attention may have been considered.
Based on the results regarding the anticipated relationships between band powers and attention, and considering the potential reasons for discrepancies with the proposed hypotheses, the accuracy of the attention algorithm can be validated. Concerning the relationship between the success of the tasks completed by the subjects while using SYNJA and the attention level recorded by the MindWave Mobile 2, the results did not correlate with the expectations. There are many possible reasons as to why this was the case. One factor could be the time constraint of the interaction with the pedagogical agent. Some participants took more time than others to read and understand the lessons. With only ten minutes to interact with SYNJA, potentially not enough time to learn and understand Java concepts at a high enough level to complete the tasks correctly was allocated. This also did not give the user much of a chance to become accustomed to how SYNJA works. Only simple instructions for the pedagogical agent were given and no practice run was performed beforehand for the participant to become comfortable with the software. Had a practice trial been given, the results could have been a better representation of the relationship between performance in the task, measured by the attention level when a question was answered correctly.
In addition, each subject had a different skill set when it came to programming Java. By only allowing subjects with limited or no Java experience to participate, biases were avoided to a small degree. Despite this, some participants, for example, those who study in a scientific faculty, had more general programming knowledge than others. Using two different analyses, this bias was partially removed. Nevertheless, some subjects were able to understand concepts more quickly than others despite not having programming experience. After the interaction with SYNJA, some participants commented that the formulation of explanations of Java concepts was not clear. Moreover, subject-specific vocabulary was not understood, especially for those who had no previous programming knowledge. Some participants had trouble understanding the language and wording, whether it be English or German, depending on which version of SYNJA they chose to use. As five of the participants using SYNJA did not speak English at a native level, this could account for some of the results and comments made by the participants.
In another study from Chen and Wu (Citation2015), similar results were obtained where sustained attention did not correlate to learning performance. Therefore, it can be more correctly assumed that sustained attention is relative to cognitive load, rather than learning performance. ‘While referring to the mental effort imposed by instructional activities, their design, and presentation, extraneous load does not contribute directly to an understanding of material’ (Chen & Wu, Citation2015, p. 109). This could explain why the mean attention prior to incorrect answers, in most cases, was not significantly lower than that prior to correct answers. Although the cognitive load was not ‘measured’, the loads for completing different tasks given by SYNJA were comparable, independent of the response of the participant. When the material was not understood, a cognitive effort was still applied. This can, to some extent, be seen in the subjective data as recorded by the pre- and post-tests, as around one third of the participants perceived their attention to be higher while using SYNJA than in normal circumstances (see Appendix B).
In conclusion, the results based on the relationship between the eSense attention metric and band powers are in favour of the accuracy of the NeuroSky MindWave Mobile 2. Still, the conclusions drawn from the problem-solving tasks prompted by SYNJA did not produce significant results that back up the hypothesis about the relationship between task performance and attention.
Conclusion
In order to collect and analyse physiological signals to interpret the affective state of the user, wearable and compact physiological devices (e.g., ECG and EEG) can be used. However, the accuracy of classification algorithms of those devices should be concurrently validated. This paper has proposed a concurrent validity approach using findings in neuroscience regarding the physiological metric ‘attention'. This proposed approach has been demonstrated with the wearable EEG device, NeuroSky MindWave Mobile 2, and is, thus, the second contribution of the paper. Based on the results of the correlation between the different band powers and the attention values calculated by the device, it can be concluded that the NeuroSky’s attention algorithm accurately classifies the attentional states of learners. The NeuroSky’s EEG device has been validated the first time in the context of learning, being the third contribution of this paper.
Important physiological indicators of sustained attention, relevant to the research question, include EEG signals such as alpha, beta, delta, and theta, as captured by EEGs. As many compact EEGs suitable for educational settings are on the market today, it is important to investigate the accuracy of such metrics for attention because of their application in many domains including education and learning. Advantages of the concurrent validity approach include flexibility of the choice of the task to induce attention or other physiological states. In this case, it proved to be a good choice to hone in on the use of EEGs in the sector of education and being able to compare the neurological signals to performance tasks related to attention. A disadvantage in this method is that the user’s perception of their attention may be different than the value as calculated causing discrepancies in the analysis of the accuracy of such algorithms.
In order to take advantage of the great potential of using physiological data to improve learning, more research and testing should be conducted regarding classification algorithms implemented in BCIs, including attention and meditation, among others. The use of concurrent validity, such as in the experiment conducted, is a good starting point to further assess, and therefore make improvements on, more commercial EEG devices, as well as other BCIs, as their use in educational settings is gaining popularity with good reason.
Disclosure statement
No potential conflict of interest was reported by the author(s).
References
- Aftanas, L I, & Golocheikine, S A. (2001). Human anterior and frontal midline theta and lower alpha reflect emotionally positive state and internalized attention: high-resolution {EEG} investigation of meditation. Neuroscience letters, 310(1), 57–60.
- Al-Nafjan, A., Hosny, M., Al-Ohali, Y., & Al-Wabil, A. (2017). Review and classification of emotion recognition based on EEG brain-computer interface system research: A systematic review. Applied Sciences, 7(1239), 1–34. https://doi.org/https://doi.org/10.3390/app7121239
- American Psychiatric Association. (1994). Diagnostic and statistical manual of mental disorders: DSM-IV. 4th ed.
- Amzica, F., & Steriade, M. (1998). Electrophysiological correlates of sleep delta waves. Electroencephalography and Clinical Neurophysiology, 107(2), 69–83. https://doi.org/https://doi.org/10.1016/S0013-4694(98)00051-0
- Ballard, J. C. (2001). Assessing attention: Comparison of response-inhibition and traditional continuous performance tests. Journal of Clinical and Experimental Neuropsychology, 23(3), 331–350. https://doi.org/https://doi.org/10.1076/jcen.23.3.331.1188
- Banquet, J.-P., & Sailhan, M. (1974). Quantified EEG spectral analysis of sleep and transcendental meditation. In Second European Congress on Sleep Research, Rome, Italy.
- Başar, Erol. (2012). A review of alpha activity in integrative brain function: Fundamental physiology, sensory coding, cognition and pathology. International Journal of Psychophysiology, 86(1), 1–24.
- Chen, C.-M., & Wu, C.-H. (2015). Effects of different video lecture types on sustained attention, emotion, cognitive load, and learning performance. Computers & Education, 80, 108–121. https://doi.org/https://doi.org/10.1016/j.compedu.2014.08.015
- Cristofori, I., & Levin, H. S. (2015). Traumatic brain injury and cognition. In J. Grafman & A. M. Salazar (Eds.), Handbook of clinical neurology, Vol. 128. Traumatic brain injury, part II (pp. 579–611). Elsevier.
- Crowley, K., Sliney, A., Pitt, I., & Murphy, D. (2010). Evaluating a brain-computer interface to categorise human emotional response. In 2010 10th IEEE International Conference on Advanced Learning Technologies (pp. 276–278). IEEE.
- Deutsch, Georg, Papanicolaou, Andrew C, Bourbon, W Thomas, & Eisenberg, Howard M. (1987). Cerebral Blood Flow Evidence of Right Frontal Activation in Attention Demanding Tasks. International Journal of Neuroscience, 36(1-2), 23–28. https://doi.org/https://doi.org/10.3109/00207458709002136
- Falkenstein, M., Hohnsbein, J., Hoormann, J., & Blanke, L. (1991). Effects of crossmodal divided attention on late ERP components. II. Error processing in choice reaction tasks. Electroencephalography and Clinical Neurophysiology, 78(6), 447–455. https://doi.org/https://doi.org/10.1016/0013-4694(91)90062-9
- Farnsworth, B. (2017). Top 14 EEG hardware companies [ranked]. Accessed May 17, 2019.
- Flehmig, H. C., Steinborn, M., Langner, R., Scholz, A., & Westhoff, K. (2007). Assessing intraindividual variability in sustained attention: Reliability, relation to speed and accuracy, and practice effects. Psychology Science, 49(2), 132.
- Gould, I. C., Rushworth, M. F., & Nobre, A. C. (2011). Indexing the graded allocation of visuospatial attention using anticipatory alpha oscillations. Journal of Neurophysiology, 105(3), 1318–1326. https://doi.org/https://doi.org/10.1152/jn.00653.2010
- Guich, Steven M, Buchsbaum, Monte S, Burgwald, Lori, Wu, Joseph, Haier, Richard, Asarnow, Robert, Nuechterlein, Keith, & Potkin, Steven. (1989). Effect of attention on frontal distribution of delta activity and cerebral metabolic rate in schizophrenia. Schizophrenia Research, 2(6), 439–448.
- Harmony, T. (2013). The functional significance of delta oscillations in cognitive processing. Frontiers in Integrative Neuroscience, 7(83), 1–10. https://doi.org/https://doi.org/10.3389/fnint.2013.00083
- Harmony, T., Fernández, T., Silva, J., Bernal, J., Díaz-Comas, L., Reyes, A., Marosi, E., Rodríguez, M., & Rodríguez, M. (1996). EEG delta activity: An indicator of attention to internal processing during performance of mental tasks. International Journal of Psychophysiology, 24(1-2), 161–171. https://doi.org/https://doi.org/10.1016/S0167-8760(96)00053-0
- Herrmann, Christoph S, & Knight, Robert T. (2001). Mechanisms of human attention: event-related potentials and oscillations. Neuroscience & Biobehavioral Reviews, 25(6), 465–476.
- Herrmann, Christoph S, Strübe, Daniel, Helfrich, Randolph F, & Engel, Andreas K. (2016). EEG oscillations: from correlation to causality. International Journal of Psychophysiology, 103, 12–21.
- Hoppe, H. U. (2017). Computational methods for the analysis of learning and knowledge building communities.
- James, W. (1890). The Principles of Psychology. Classics in the history of psychology.
- Johnston, W A, & Dark, V J. (1986). Selective Attention. Annual Review of Psychology, 37(1), 43–75. https://doi.org/https://doi.org/10.1146/annurev.ps.37.020186.000355
- Karran, Alexander J, & Kreplin, Ute. (2014). The drive to explore: physiological computing in a cultural heritage context. Advances in Physiological Computing, 169–195.
- Klimesch, W. (2012). Alpha-band oscillations, attention, and controlled access to stored information. Trends in Cognitive Sciences, 16(12), 606–617. https://doi.org/https://doi.org/10.1016/j.tics.2012.10.007
- Klimesch, W., Doppelmayr, M., Russegger, H., Pachinger, T., & Schwaiger, J. (1998). Induced alpha band power changes in the human EEG and attention. Neuroscience Letters, 244(2), 73–76. https://doi.org/https://doi.org/10.1016/S0304-3940(98)00122-0
- Knight, S., & Buckinghamm Shum, S. (2014). Theory and learning analytics.
- Linden, M., Habib, T., & Radojevic, V. (1996). A controlled study of the effects of EEG biofeedback on cognition and behavior of children with attention deficit disorder and learning disabilities. Biofeedback and Self-regulation, 21(1), 35–49. https://doi.org/https://doi.org/10.1007/BF02214148
- Liu, N.-H., Chiang, C.-Y., & Chu, H.-C. (2013). Recognizing the degree of human attention using EEG signals from mobile sensors. Sensors, 13(8), 10273–10286. https://doi.org/https://doi.org/10.3390/s130810273
- Makeig, S., & Jung, T.-P. (1996). Tonic, phasic, and transient EEG correlates of auditory awareness in drowsiness. Cognitive Brain Research, 4(1), 15–25. https://doi.org/https://doi.org/10.1016/0926-6410(95)00042-9
- Mann, Christopher A, Lubar, Joel F, Zimmerman, Andrew W, Miller, Christopher A, & Muenchen, Robert A. (1992). Quantitative analysis of EEG in boys with attention-deficit-hyperactivity disorder: Controlled study with clinical implications. Pediatric neurology, 8(1), 30–36.
- Maskeliunas, R., Damasevicius, R., Martisius, I., & Vasiljevas, M. (2016). Consumer grade EEG devices: Are they usable for control tasks? PeerJ, 4, e1746. https://doi.org/https://doi.org/10.7717/peerj.1746
- Maunsell, John H R. (2015). Neuronal mechanisms of visual attention. Annual Review of Vision Science, 1, 373–391.
- McDowd, Joan M, Vercruyssen, Max, & Birren, James E. (1991). Aging, divided attention, and dual-task performance. Multiple-task performance, 387–414.
- NeuroSky Inc. (2009). EEG band frequencies. http://support.neurosky.com/kb/science/eeg-band-frequencies
- Norman, D., & Shallice, T. (1986). Attention to action: Willed and automatic control of behavior. Consciousness and Self-regulation, 4, 1–18. https://doi.org/https://doi.org/10.1007/978-1-4757-0629-1_1
- O'Connell, R. G., Dockree, P. M., Robertson, I. H., Bellgrove, M. A., Foxe, J. J., & Kelly, S. P. (2009). Uncovering the neural signature of lapsing attention: Electrophysiological signals predict errors up to 20 s before they occur. Journal of Neuroscience, 29(26), 8604–8611. https://doi.org/https://doi.org/10.1523/JNEUROSCI.5967-08.2009
- Oken, B. S., Salinsky, M. C., & Elsas, S. (2006). Vigilance, alertness, or sustained attention: Physiological basis and measurement. Clinical Neurophysiology, 117(9), 1885–1901. https://doi.org/https://doi.org/10.1016/j.clinph.2006.01.017
- Pope, A. T., Stephens, C. L., & Gilleade, K. (2014). Biocybernetic adaptation as biofeedback training method. In S. H. Fairclough & K. Gilleade (Eds.), Advances in physiological computing, pages (pp. 91–115). Springer.
- Ray, W J, & Cole, H W. (1985). EEG alpha activity reflects attentional demands, and beta activity reflects emotional and cognitive processes. Science, 228(4700), 750–752. https://doi.org/https://doi.org/10.1126/science.3992243
- Rebolledo-Mendez, G., Dunwell, I., Martínez-Mirón, E. A., Vargas-Cerdán, M. D., De Freitas, S., Liarokapis, F., & García-Gaona, A. R. (2009). Assessing Neurosky’s usability to detect attention levels in an assessment exercise. International Conference on Human-Computer Interaction (pp. 149–158). Springer.
- Renard, Y., Lotte, F., Gibert, G., Congedo, M., Maby, E., Delannoy, V., Bertrand, O., & Lécuyer, A. (2010). Openvibe: An open-source software platform to design, test and use brain-computer interfaces in real and virtual environments. Presence: Teleoperators and Virtual Environments, 19(1), 35–53. https://doi.org/https://doi.org/10.1162/pres.19.1.35
- Robertson, I. H., Manly, T., Andrade, J., Baddeley, B. T., & Yiend, J. (1997). 'Oops!': Performance correlates of everyday attentional failures in traumatic brain injured and normal subjects. Neuropsychologia, 35(6), 747–758. https://doi.org/https://doi.org/10.1016/S0028-3932(97)00015-8
- Rodrigue, Mathieu, Son, Jungah, Giesbrecht, Barry, Turk, Matthew, & Höllerer, Tobias. (2015). Spatio-temporal detection of divided attention in reading applications using {EEG} and eye tracking. Proceedings of the 20th International Conference on Intelligent User Interfaces, 121–125.
- Sałabun, W. (2014). Processing and spectral analysis of the raw EEG signal from the MindWave. Przeglad Elektrotechniczny, 90(2), 169–174. https://doi.org/https://doi.org/10.12915/pe.2014.02.44
- Sinha, T., Jermann, P., Li, N., & Dillenbourg, P. (2014). Your click decides your fate: Inferring information processing and attrition behavior from mooc video clickstream interactions.
- Sohlberg, McKay Moore, & Mateer, Catherine A.. (1987). Effectiveness of an attention-training program. Journal of clinical and experimental neuropsychology, 9(2), 117–130. https://doi.org/https://doi.org/10.1080/01688638708405352
- Sykes, Donald H, Douglas, Virginia I, & Morgenstern, Gert. (1973). Sustained attention in hyperactive children. Journal of Child Psychology and Psychiatry, 14(3), 213–220.
- Szafir, D., & Mutlu, B. (2013). ARTful: adaptive review technology for flipped learning. In Proceedings of the SIGCHI Conference on Human Factors in Computing Systems (pp. 1001–1010). ACM.
Appendices
Appendix A
Pre-test and post-test questionnaires
Pre-test questionnaire
Do you usually avoid or delay starting new tasks?
How often do you find that work or assignments are boring or repetitive making it difficult to complete them?
Do you make careless mistakes when performing a boring, repetitive, or difficult task?
How often do you feel restless or fidgety?
Are you usually distracted or find difficulty concentrating when there is activity or noise around you?
Do you have difficulty concentrating on people when they talk to you?
Post-test questionnaire
Did you tend to avoid or delay getting started when learning a new concept in SYNJA?
Did you find that the majority of the tasks while using SYNJA were boring or repetitive, making them difficult to complete?
Did you find yourself making careless mistakes when using SYNJA?
How often did you feel restless or fidgety while using SYNJA?
Were you distracted (or did you find it hard to focus) when there was activity or noise around you while using SYNJA?
Did you have difficulty concentrating on SYNJA when she was interacting with you?
All these questions above were to be answered with one of five choices: (1) Very often, (2) Often, (3) Sometimes, (4) Rarely, (5) Never.
Appendix B
Table B1. Pre-test and post-test results