
 ?Mathematical formulae have been encoded as MathML and are displayed in this HTML version using MathJax in order to improve their display. Uncheck the box to turn MathJax off. This feature requires Javascript. Click on a formula to zoom.
ABSTRACT
With the continuous development of a society in which construction works are ubiquitous, investors often accelerate the progress of construction projects and may neglect to follow the proposed construction processes. As a result, construction works decrease in durability and become more susceptible to cracking, breakages, or collapse, resulting in significant damage to people and property. Meanwhile, labour to monitor the progress of works is often time-consuming, effortful, prone to errors, and vulnerable to risk. This study introduces a system that uses a Wireless Sensor Network (WSN) consisting of a laser-ranging Time-of-Flight (ToF) sensor module for structural crack monitoring in architecture. The proposed system collects data on the variation in amplitude of an existing crack as well as environmental factors that can adversely affect cracks such as temperature, humidity, and vibration. This aids the assessment of safety levels by providing warnings and remedies as quickly as possible, contributing to raising the safety level for workers and people living in the area, and minimizing potential damage. Test results demonstrate the following advantages: the device operates stably in extreme weather conditions; has an expected lifetime of more than ten years; and features high accuracy, long data transmission, and low-cost, low-power operation.
1. Introduction
In recent years, construction works increasingly suffer from damage, significant loss, breakage, and damage to human lives and property due to poor quality or natural earthquakes. We consider the idea of study-related problems causing the above issues, such as cracks in the surface of building materials, vibration, temperature, or humidity. How buildings change, then the design and construction of a device and system that can collect, evaluate, and resolve the above problems. For example, quantitative monitoring of crack growth in buildings, bridges, and viaducts is essential so that corrective measures can be taken to protect a structure from severe failure.
Various researchers have developed monitoring systems for structural cracks. These can be broadly divided into non-optical (i.e. electrical) and optical sensors. Examples of non-optical sensors include acoustic emission sensors (Ratnam et al., Citation2019), capacitive sensors (Bacco et al., Citation2020), ultrasonic sensors (Xie et al., Citation2020), strain gauges (Polonelli et al. Citation2018), carbon nanotubes (Addabbo et al., Citation2017), temperature sensors (Addabbo et al., Citation2018), and linear variable differential transformer sensors (Wang et al., Citation2014). In contrast, optical sensors include fibre Bragg gratings, optical fibres, image analysis methods, hyperspectral image processing, digital image correlation, and optical − mechanical sensors based on the Moiré effect that can be applied for real-time crack monitoring in concrete structures (Abdelgawad & Yelamarthi, Citation2017; Misra et al., Citation2020; Pierleoni et al., Citation2019).
However, developing an optimal monitoring system remains an open challenge, and it is not trivial to determine which existing system is most suitable. Indeed, the structures are highly heterogeneous, both in terms of construction technology and age. Therefore, it is not easy to define a system that fits all facilities indiscriminately. Furthermore, monitoring is a multidisciplinary topic, and the calculation of all the variables involved is a remarkably complex problem.
In addition to ensuring that the structure is always in good condition, monitoring the structure also eliminates the need for visual inspection and replaces the use of more conventional methods (e.g. ultrasonic methods). Thus, structural health monitoring offers a new and more effective alternative to traditional methods. Indeed, visual inspection is not always possible and costly in terms of time and money; conventional methods require operator experience. Furthermore, structural monitoring systems face two types of challenges: ageing, which leads to a gradual loss of operating conditions, and the occurrence of sudden and unexpected events, such as an earthquake (Muttillo et al., Citation2020). However, there is specific heterogeneity in applying structural monitoring, as the pursuits of more precise detection, more accessible data management and storage (even in large datasets), more excellent timeliness and improved reliability of the information provided.
Some other researches (Yang et al., Citation2018; Yuan et al., Citation2021) also uses deep leaning and image processing techniques to measure and monitor crack. However, user must manually select segmentation threshold (Yuan et al., Citation2021) and the performance is decided by choosing an appropriate dataset for training the convolution neural network model (Yang et al., Citation2018).
This article presents an enhanced version of the proposal shown in (Addabbo et al., Citation2017; Addabbo et al., Citation2018), with an alternative use. The advanced monitoring system for structural health is based on a microcontroller, Time-of-Flight (ToF), and accelerometric sensors. The measurements are sent to a remote host via the Message Queuing Telemetry Transport (MQTT) protocol and displayed on the web application, which allows each authenticated user to evaluate the structure's health in real time. Compared with traditional methods, the system has been upgraded to improve its accuracy and performance and reduce labour costs by applying several new technologies, such as:
Use of integrated sensors with ToF technology enables high accuracy and high-speed measurements and calculations in complex environments.
The vibration sensor uses a very high sensitivity to detect even the slightest vibration.
Use of the ATmega328P-AU energy-saving microcontroller allows the system to work for a long time without human intervention.
The compact system can be installed anywhere at a long distance using LoRa wireless data transmission technology.
The gateway node is connected to the Internet to send and store data directly on the server so that users can observe and evaluate it intuitively.
The remainder of the article is organized as follows: Section 1 provides a general introduction; Section 2 outlines related work; the system architecture of our implementation is performed in Section 3.; Section 4 discusses applied methods; and Section 5 proposes an experiment result. Finally, section 6 concludes the article.
2. Related works
The authors in (Wang et al., Citation2007) propose a wireless structural health monitoring system for real-time data collection. The disadvantages of this system are the limited number of sensors and the ability to synchronize samples. For increasing the sampling rate, the number of connected sensors of this network must be also reduced. Moreover, for applying the wireless surveillance system in a large structure, such as a bridge, a peer-to-peer wireless sensor network must be designed and improved. The concept presented in (Hu et al., Citation2012) developed a wireless monitoring system integrated into the highway bridge to monitor the structural condition. This method can take samples in continuous mode using the microcontroller and Analog-to-Digital Converter (ADC) to obtain an analog accelerometer. The main problem with the analog accelerometer is the output deviation due to temperature and the need for a compensation circuit. The study points out the limitations of the proposed wireless system in terms of data output; indeed, results had still limited due to analog circuits and data loss during transmission.
The main component of the proposed monitoring system is the ADXL355 accelerometer (CitationADXL355 Datasheet and Product Info). A digital sensor can acquire an internal three-axis accelerometer and then forward it to an external microcontroller. Many studies (González et al., Citation2018; Khan et al., Citation2020; Lee et al., Citation2019; Pierleoni et al., Citation2019; Quqa et al., Citation2019; Valenti et al., Citation2018; Wondra et al., Citation2019; Navabian & Beskhyroun, Citation2020) present structural condition monitoring systems using ADXL355 accelerometers. These structures are divided into Wireless Sensor Network (WSN) based systems and wired surveillance systems. The authors of the study (Valenti et al., Citation2018) proposed a low-cost WSN for Structural Health Monitoring (SHM) and the method used for modality frequency determination. The problem with this system lies in the consistency of the patterns. Indeed, invoice sync refers to the start and stop times that the main one sends to the node. Separate efforts using WSN are written in (Quqa et al., Citation2019).
A Wired Sensor Monitoring System is an option for WSN. One application for wired systems using the ADXL355 is earthquake detection (González et al., Citation2018; Khan et al., Citation2020; Lee et al., Citation2019). Seismic events are an essential area of research. This type of system can send alarm messages when an event occurs. The drawback of these methods is that very few sensors can be used. Indeed, this process usually involves a node sending data to the web server. Other nodes are disconnected from each other and spaced kilometres apart. The study in (Pierleoni et al., Citation2019) proposes a wired monitoring system with 64 samples per second without synchronizing each node communicating data over an ethernet connection. This system can evaluate the lowest modal frequency of the structure but not the highest due to the low sampling frequency.
Meanwhile, researchers (Quqa et al., Citation2019) have identified a single-node wired monitoring system for structural health. The system can determine natural frequency and modal parameters in real time. The system is based on a single-board computer: the ADXL355 accelerometer limits synchronization and the maximum number of nodes connected on the same network.
Based on a documented review of a surveillance system that uses the same accelerometer as the system proposed in this study, a comparison can be made between wired and wireless systems. The current expensive wired surveillance system typically has low number of connected sensors, large bandwidth, high sensor data rate and very high sensor synchronization. Meanwhile, the low cost wireless monitoring system has many connected network sensors, limited bandwidth, low sensor data rate and necessary synchronization of nodes (Noel et al., Citation2017).
Based on the above analysis, the main novelties of the proposed monitoring system are the following:
Firstly, the solution presented in this paper attempts to address the underlined problems by proposing a novel sensor node and gateway node architectures characterized by low power consumption (thus allowing the use of standard batteries to power the node for long time periods) and a wide range of communication.
Secondly, applying the advanced ToF function in the VL53L0X sensor provides a far greater range, faster readings, and greater accuracy while maintaining a smaller size, lower weight, and lower power consumption characteristics than the previous ADXL355 sensors in (Addabbo et al., Citation2017; Addabbo et al., Citation2018).
Finally, the system presented in this article allows each authorized user to evaluate the structure’s health in real time. In addition, the user can display measured data on each sensor axis to retrieve historical data and send commands to the sensors.
3. System architecture
The structural crack monitoring solution presented in this article must allow the real-time display of data collected by the VL53L0X (Noel et al., Citation2017), ADXL355, and DHT 11 sensors in a web application. At the same time, it must be possible to send configuration commands to the sensor via a remotecontrol panel and the storage of telemetry data must be facilitated to enable offline data analysis. The system block diagram briefly introduces how to set up, connect, and transmit, as well as the system's essential operation, including use of the ‘Fixture', which is a permanently mounted object that helps the sensor to sense distance. For measuring a crack, ‘Sensor Nodes' is designed to collect data through three main sensor types: the ‘VL53L0X' sensor, also known collectively as a new-generation ToF laser-ranging sensor; the ‘SHT31' sensor (https://www.mouser.com/datasheet/2/682/Sensirion_Humidity_Sensors_SHT3x_Datasheet_digital-971521.pdf), one of the best sensors for measuring temperature and humidity; and the ‘ADXL345' accelerometer. The collected data is then processed by the central processor and sent to the gateway node via a wireless signal transceiver module, ‘LoRa E32' (https://img.filipeflop.com/files/download/E32_User+Manual_EN_v1.00.pdf), and data collected from the gateway node is processed and sent to the user via the Internet. The system developed in this article aids low-energy, low-cost measurement in structural crack monitoring. The results are visualized with an optimized Printed Circuit Board (PCB) circuit designed for reading the sensor outputs, a LoRa device to forward the data provided by the sensors to the data centre, and a web server to analyze the collected data. A diagram illustrating the node components is shown in . Using multiple sensors on a single circuit decreases the cost and saves energy; the cost breakdown is provided in and .
Figure 1. System architecture.
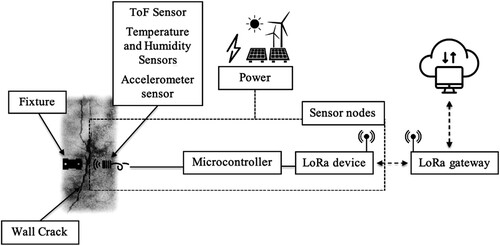
Table 1. Cost breakdown.
Table 2. Technical specifications.
3.1. Sensor node
The newly designed PCB circuit used in the paper is responsible for performing sensor measurements and transmitting measured data to the gate device. The data is then forwarded to the data centre. Up to three sensors can be attached to the PCB circuit thanks to the integrated ATmega 328P-AU microcontroller (https://ww1.microchip.com/downloads/en/DeviceDoc/Atmel-7810-Automotive-Microcontrollers-ATmega328P_Datasheet.pdf).
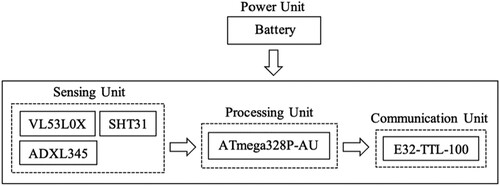
Sensor nodes are one of the main components of the WSN system. A sensor node comprises four central units: the power unit, the sensor unit, the central processing unit, and the wireless communication unit, as shown in . The central processing unit of the sensor button is an ATmega328P-AU microcontroller that uses a 5 V programmed operating voltage in C ++ language that processes, collects, and analyzes data from various sensors. Each other by I2C communication, before data is transmitted via a wireless communication unit through Universal Asyschronous Receiver Transmitter (UART) communication. The sensor node communication unit uses the E32-TTL-100 module, which utilizes the low-power, energy-efficient LoRa wireless comprehensive area network protocol to transmit data with the gateway node or other sensor nodes. The E32-TTL-100 module is suitable for large-scale systems such as WSN, and uses UART communication to communicate with the microcontroller. The source unit of the sensor button uses as its primary source a solar panel with 12 V voltage and a maximum capacity of 5.2 W. Furthermore, a LiPo battery is used to store power with a total of 3000 mAh.
Figure 2. Sensor node block diagram.
The sensor unit includes three sensor types:
The VL53L0X sensor is a type of ToF proximity sensor. It is used to determine the distance from itself to the object to be measured, which it converts to a digital signal and sends to the microcontroller through I2C communication in this case. Sensors are used to determine the amplitude of the crack oscillation.
The ADXL345 sensor is a type of accelerometer. It is used to determine the vibration or inertia of the object attached to the sensor, which it converts to a digital signal and sends to the microcontroller via I2C communication. This variable is used to analyze the effect of vibration on crack variation. Besides, it is well suited for mobile applications, with a simple, rugged design, high impedance, and high-frequency response.
The SHT31 sensor is responsible for collecting data on ambient temperature and humidity, converting it into digital signals, and sending it to the microcontroller through I2C communication. In this case, the sensor is used for distribution. We are analyzing the impact of temperature and humidity on changes in the crack.
The actual system model meets the requirements of high quality, compact size, stable operation, and proper arrangement of components with hardware. The antenna placement is placed appropriately to ensure extensive transmission of the signal and to limit noise. The sensor node is also designed to support attachment of the sensor node to the work surface, and solar mount panels are included to receive as much light as possible, as shown in .
Figure 3. Experimental set-up of testing structure with sensor and gateway nodes.
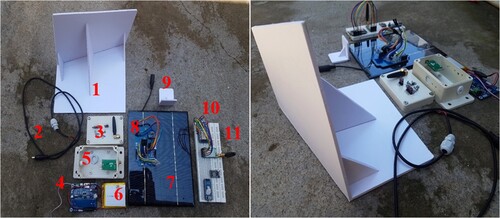
The actual sensor node consists of nine main components:
1. Sensor node bracket
2. Cable connecting solar power
3. Electronic circuit box
4. Energy control circuit
5. Lora module
6. Lithium batteries
7. Solar panels
8. Sensor node circuit
9. Fixed distance parts
The actual gateway node consists of two main components:
10. ESP32 kit
11. Lora module
3.2. Gateway node
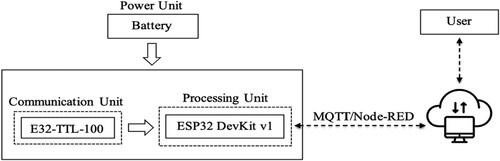
The gateway node acts as a gateway to convert data between two protocols, LoRa and Internet Protocol (IP), and is responsible for receiving signals forward from sensor nodes and classifying, packaging, and pushing data to the machine host via the Internet. The gateway node is composed of three units: the source unit (power unit), the central processing unit (processing unit) and the wireless communication unit (communication unit), as shown in . The source unit of the gateway node used in this case is taken directly from the 220 V civilian electricity supply and converted to 5 V DC power through an adapter. The central processing unit of the gateway node is the microcontroller ESP32-WROOM-32, which is integrated on DevKit v1 and features high processing speed and stability, Wi-Fi connectivity, and straightforward data transfer to the Internet. Regarding the wireless communication of the gateway node, to increase compatibility with the sensor nodes, the gateway node also uses the low-power E32-TTL-100 module to communicate data from long-distance sensor nodes.
Figure 4. Block diagram of the gateway.
3.3. Web server
The web server is effective for providing a scalable user interface for a wide range of devices (e.g. PCs, tablets and cellphones) along with a list of measurements. The software, designed by MQTT/Node-Red and running on a web server, is capable of:
Remote monitoring and management of IoT node with different close/far distances
Collect measurements from various locations
Offer various analyzes with the use of flexible libraries
Allow various inquiries from various devices
Report selected parameters for specific periods
3.4. Power unit
The new version of the system's power unit comprises three components: a 12 V solar panel that converts solar energy with a 5.2 W maximum capacity; a 3000 mAh LiPo battery used to store energy; and an energy control circuit used to stabilize the supply voltage for the entire system of a sensor node. A rough consumption analysis can be performed for such a structure. The sensor node is flexible, efficient for the sensor node and ensures that the system operates continuously at all times.
(1)
(1)
(2)
(2)
(3)
(3) where:
is the total capacity of the circuit.
is the capacity of the microcontroller.
is the capacity of the LoRa module
is the capacity of the SHT31 sensor.
is the capacity of the ADXL345 sensor.
is the capacity of the VL53L0X sensor.
Assume the modules operate on a cycle of 10 s, one at a time ∼ 1 s = 360 s/h.
(4)
(4) where
is the total capacity of the circuit operating in a cycle of 10 s/h.
Therefore, the lifetime of the node is:
(5)
(5)
4. Applied methods
This section explains how data is collected from sensors and converted into useful information. As mentioned in the introduction, the distance/the width of cracks in the wall is monitored with a VL53L0X sensor against a laser emitted by a sensor that is permanently mounted to one side of the crash and a reflective object. The rear laser sensor is fixed on the other side of the damage. From there, the sensor determines the distance and sends it to the central processor to estimate and assess the expansion of the crack over time. The central processing unit ATmega328P-AU is programmed to analyze data from the VL53L0X sensor with a random initial distance depending on the current crack width or equipment installation. Then distance data on crack width is collected and monitored periodically. Crack development or expansion is recorded against the previously determined width, and according to the safety level intervention and maintenance may take place. The system is based on the principle of calculating the distance by time of a light beam or photon beam travelling through space and being reflected by the sensor when encountering an obstacle. Measurement begins when the light-emitting source emits a beam of light or a photon beam to the object to be measured and is reflected by the sensor. The ToF is measured when this photon beam travels from the source to the item and bounces back to the sensor. The process of measuring the distance of the photon beam according to EquationEq. 6(6)
(6) is shown in .
Figure 5. A principle working of sensor VL53L0X.
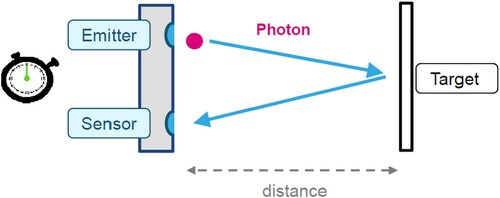
The following formula calculates the distance travelled by the photon beam:
(6)
(6)
is the light speed (299,792,458 m/s)
is the duration of light movement.
The distance value is calculated and determined by the sensor and then sent to the central processor via the I2C connection. Following the equation used to calculate the distance value, the processing and calculating of VL53L0X sensor data takes place step by step as follows.
The microcontroller programmes the retrieval of sensor data from the sample approximately 100 times, and averages this value to minimize noise according to an averaging formula as in EquationEq. 7(7)
(7) :
(7)
(7)
is a single distance measurement made by the sensor
is an average value obtained from 100 measurements.
(8)
(8)
(9)
(9)
is a previous distance value
is a certaintly distance value.
The mean distance above is then compared with the previous distance value to compare the current result error. Suppose the current value changes again by depending on the manufacturer error. In that case, the result will return equal to the previous value
distance unit, more details of these values as shown in EquationEq. 8
(8)
(8) , 9.
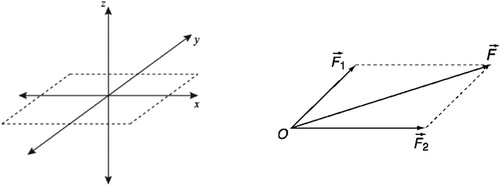
The ADXL345 sensor works using an effect called the Coriolis force, which occurs in rotating frames of reference compared to inertial frames of reference. Inertial force is caused by motion acceleration, while gravitational force is due to acceleration field caused. In this case the sensor node is a fixed node, so gravitational acceleration is used to calculate the vibration force that the object or structure is attached to. The structure inside the sensor consists of a part that acts like a spring carrying a mass, and a fixed part, where an applied force causes the spring to move due to the inertial force. When the distance between the two parts changes, the capacitance value between the two parts also changes and is measured by the built-in processor. The ADXL345 sensor can determine three-axis acceleration corresponding to three spatial dimensions, including the acceleration of gravity. In this case the sensor needs to determine the vertical vibration acceleration along the direction of the acceleration of gravity. The device is fixed such that no acceleration takes place in the other directions of gravitational acceleration. The total of the three acceleration forces when the device is stationary is then equal to the acceleration of gravity () as shown in . The total of three acceleration forces at this time is calculated by the parallelogram force synthesis formula:
(10)
(10)
(11)
(11) The microcontroller is programmed to retrieve the sensor data approximately 200 times, and filters out the two largest and smallest values. These two values now describe the amplitude of the instantaneous acceleration oscillation, and are subtracted from each other to obtain the amplitude of the instantaneous acceleration oscillation from which the vibration can be determined.
(12)
(12)
(13)
(13)
is the amplitude of the instantaneous acceleration oscillation.
is the value of the instantaneous acceleration
is the maximum instantaneous acceleration amplitude value
is the minimum instantaneous acceleration amplitude value.
Figure 6. ADXL345 accelerometer sensor axis.
After installing the device following the requirements outlined in this article, upon starting the programme the timer begins. After 10,000 ms, equivalent to 10 s, calculation begins and repeats indefinitely to create an operation cycle of 10 s. When the programme begins the first calculation, the programme samples the VL53L0X proximity sensor approximately 100 times and takes the average value, considering the error condition with the previous value if the current value is greater than the error value. The final value indicates how the crack under investigation has changed. The programme then adds a distance unit to the previous value and assigns it to the variable. Next, the programme samples the ADXL345 accelerometer sensor approximately 200 times and filters out the two most significant and minimum values corresponding to the vibration amplitude, and calculates and assigns values to the variable. Finally, the programme runs the SHT31 sensor temperature and humidity sampling, before encapsulating the data and sending it to the LoRa module.
5. Experimental results and discussion
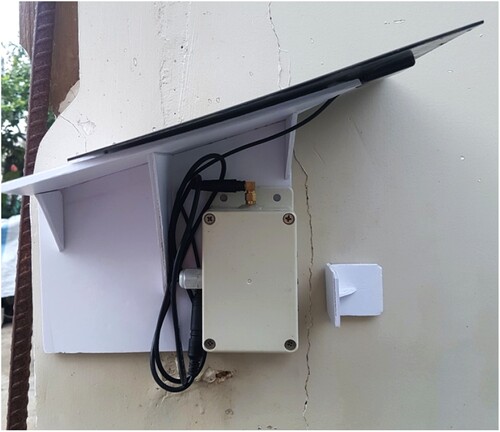
We deployed the IoT node as described in the previous section to collect data in a natural environment in central Vietnam, where 100 earthquakes typically occur per year. The sensor node can be seen in . This made it possible to utilize the efficiency of the VL53L0X and ADXL345 sensors in the proposed IoT system, permanently installed to enable 24-hour monitoring. According to their authorization level, the end-users obtaining the deployed web platform can perform the processes illustrated in the previous section and ultimately monitor structural cracks in a building in real time.
Figure 7. Prototype of the proposed low-cost smart sensor structure installed in a real environment.
The system was physically installed outside in the described environment to assess its operability. After three days of severe and variable weather conditions the system continued to operate well, and the connection was relatively stable. The collected data demonstrates the good performance of the sensor node in the test environment, indicating that the system has met the requirements. Data from April 15, 2020 was used to evaluate the impact of environmental factors such as temperature and humidity on crack variation. The results show that, according to the proposed system, when the temperature and humidity increase the distance amplitude value of the crack changes accordingly. The plots presented in display a fairly great shape dependency of the measured displacement with temperature and humidity, verifying the validity of the model in EquationEq. 6(6)
(6) . Finally, the outcomes show that the introduced system, with synchronous samples between the two sensors, is able to detect damage in a monitored structure.
Figure 8. Results from approximately three days of data acquisition measuring crack displacement, vibration, and humidity following temperature effect correction.
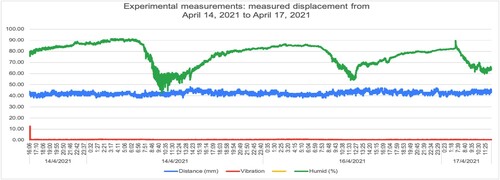
Figure 9. Experimental measurement of displacement (mm) vs. temperature (degrees Celsius).
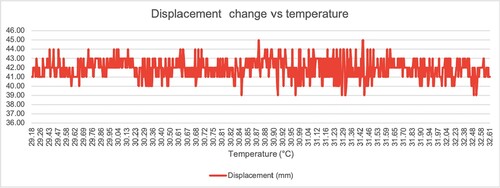
Figure 10. Experimental measurement of displacement (mm) vs. humidity (%).
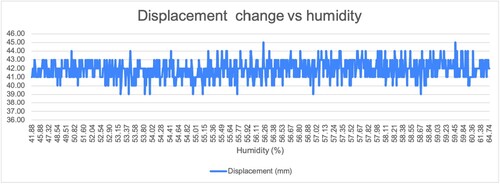
From , we can observe intuitively the effect of environment temperature, humidity on the crack feature. Although there are many crack monitoring system developed, but very few can identify the change of displacement under different environmental conditions as our proposed system. This is one of major benefits of this work.
All of the datasets obtained throughout the experiment time were stored on the web server and can be discussed through the use of a browser as shown in .
Figure 11. Screenshot of the web server available to the end-user.
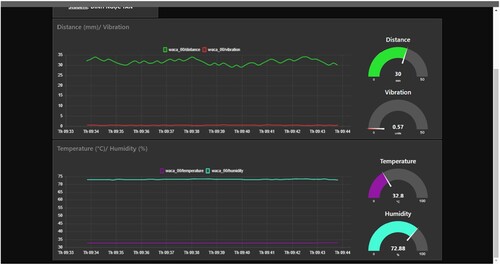
The capacity to capture real time information about dynamic crack behaviour both during working conditions and after extraordinary events facilitates more efficient implementation of support and repair, with a resulting reduction in containing prices.
5. Conclusions
This article was presented an IoT monitoring system for structural health over the MQTT protocol. The advanced solution monitors the shape of a structure by estimating its dynamic response and tracking the development of modal parameters such as natural displacement. Failures in a structure have been found to correspond to changes in dynamic behaviour, with a resulting change in natural displacement. The proposed system includes a low-cost ToF sensor and an accelerometer used to measure the acceleration of the building on which it is located. These measurements are sent to a remote host via the MQTT protocol. A specially developed web application then allows each authorized user to evaluate the structure's health in real time by testing the dynamic response of the design. In addition, the user can display measured data along each sensor axis to retrieve historical data and send commands to the sensor. In the future, the system could use a NoSQL database or time-series database to evaluate or store more significant amounts of data, including non-data structures, from an increased number of devices. Considering the architectural module of the proposed solution, another data layer in the foundation block would not involve structural changes to the entire application. For this reason, the system was deployed and tested in central Vietnam. Given the performance of the proposed IoT solution, future studies will focus on its use in earthquake early warning systems.
Disclosure statement
No potential conflict of interest was reported by the author(s).
Additional information
Notes on contributors
Tran Anh Khoa
Dr. Tran Anh Khoa graduated PhD degree in Information Engineering at Siena University in 2017. He currently works as a lecturer of Faculty of Electrical and Electronics Engineering, Ton Duc Thang University. Dr. Tran is an active researcher in the fields of internet of things, signal processing and artificial intelligence.
Pham Duc Lam
Mr. Pham Duc Lam graduated Master of Science degree in Mechatronics Engineering at Ho Chi Minh University of Transport in 2014. He works as lecturer of the Faculty of Engineering and Technology, Nguyen Tat Thanh University. Mr. Pham has published many publications in the fields of internet of things, robotics, automation and artificial intelligence.
Nguyen Hoang Nam
Dr. Nguyen Hoang Nam graduated PhD degree in Mechanical Engineering at National Chiao Tung University in 2017. He has worked as a lecturer of Faculty of Electrical and Electronics Engineering, Ton Duc Thang University since 2018. Dr. Nguyen is an active researcher in the fields of embedded system, robotics, image processing, internet of things and artificial intelligence.
References
- Abdelgawad, A., & Yelamarthi, K. (2017). Internet of Things (IoT) platform for structure health monitoring. Wireless Communications and Mobile Computing, 2017, 1–10. https://doi.org/10.1155/2017/6560797
- Addabbo, T., Fort, A., Mugnaini, M., Panzardi, E., Pozzebon, A., Tani, M., & Vignoli, V. (2017). A low cost distributed measurement systems based on hall effect sensors for structural crack monitoring in monumental architecture. Measurement, 116, 652–657. https://doi.org/10.1016/j.measurement.2017.11.050
- Addabbo, T., Fort, A., Mugnaini, M., Panzardi, E., Pozzebon, A., & Vignoli, V. (2018). A City-Scale IoT Architecture for Monumental Structures Monitoring. Measurement, 131, 349–357. https://doi.org/10.1016/j.measurement.2018.08.058
- ADXL355 Datasheet and Product Info. Analog Devices. Available online: https://www.analog.com/en/ products/adxl355.html.
- Bacco, M., Barsocchi, P., Cassará, P., Germanese, D., Gotta, A., Leone, G.R., Moroni, D., Pascali, M.A. and Tampucci, M., (2020). Monitoring ancient buildings: Real deployment of an IoT system enhanced by UAVs and virtual reality. IEEE Access, 8, 50131–50148. https://doi.org/10.1109/ACCESS.2020.2980359
- González, S., Jiménez, J. C., Guevara, R., & Palacios, I. (2018). IoT-based microseismic monitoring system for the evaluation of structural health in Smart cities. In Proceedings of the Ibero-American Congress Smart Cities (ICSC-CITIES), Soria, Spain, 26–27 September 2018; pp. 1–13.
- Hu, X., Wang, B., & Ji, H. (2012). A wireless sensor network-based structural health monitoring system for highway bridges. Computer-Aided Civil and Infrastructure Engineering, 28(3), 193–209. https://doi.org/10.1111/j.1467-8667.2012.00781.x
- Khan, I., Choi, S., & Kwon, Y. (2020). Earthquake detection in a static and dynamic environment using supervised machine learning and a novel feature extraction method. Sensors, 20(3), 800. https://doi.org/10.3390/s20030800
- Lee, J., Khan, I., Choi, S., & Kwon, Y. (2019). A smart IoT device for detecting and responding to earthquakes. Electronics, 8(12), 1546. https://doi.org/10.3390/electronics8121546
- Misra, D., Das, G., & Das, D. (2020). An IoT based building health monitoring system supported by cloud. Journal of Reliable Intelligent Environments, 6(3), 141–152. https://doi.org/10.1007/s40860-020-00107-0
- Muttillo, M., Stornelli, V., Alaggio, R., Paolucci, R., Di Battista, L., de Rubeis, T., & Ferri, G. (2020). Structural health monitoring: An IoT sensor system for structural damage indicator evaluation. Sensors, 20(17), 4908. https://doi.org/10.3390/s20174908
- Navabian, N., & Beskhyroun, S. An automated wireless-based system for real-time health monitoring of civil infrastructures. In Proceedings of the 2020 New Zealand Society for Earthquake Engineering Annual Technical Conference, Wellington, New Zealand, 22–24 April 2020.
- Noel, A., Abdaoui, A., Elfouly, T., Ahmed, M., Badawy, A., & Shehata, M. (2017). Structural health monitoring using wireless sensor networks: A comprehensive survey. IEEE Communications Surveys & Tutorials, 19(3), 1403–1423. https://doi.org/10.1109/COMST.2017.2691551
- Pierleoni, P., Conti, M., Belli, A., Palma, L., Incipini, L., Sabbatini, L., Valenti, S., Mercuri, M. and Concetti, R. (2019). IoT solution based on MQTT protocol for real-time building monitoring. 2019 IEEE 23rd International Symposium on Consumer Technologies (ISCT), 2019, pp. 57–62. https://doi.org/10.1109/ISCE.2019.8901024.
- Pierleoni, P., Conti, M., Belli, A., Palma, L., Incipini, L., Sabbatini, L., Valenti, S., Mercuri, M., & Concetti, R. (2019). IoT solution based on MQTT protocol for real-time building monitoring. In Proceedings of the IEEE 23rd International Symposium on Consumer Technologies (ISCT), Ancona, Italy, 19–21 June 2019.
- Polonelli, T., Brunelli, D., Guermandi, M., & Benini, L. (2018). An accurate low-cost Crackmeter with LoRaWAN communication and energy harvesting capability. 2018 IEEE 23rd International Conference on Emerging Technologies and Factory Automation (ETFA), 2018, pp. 671–676. https://doi.org/10.1109/ETFA.2018.8502592.
- Quqa, S., Landi, L., & Diotallevi, P. (2019). Real time damage detection through single low-cost smart sensor. In Proceedings of the 7th International Conference on Computational Methods in Structural Dynamics and Earthquake Engineering, Crete, Greece, 24–26 June 2019.
- Ratnam, M. M., Ooi, B. Y., & Yen, K. S. (2019). Novel moiré-based crack monitoring system with smartphone interface and cloud processing. Structural Control and Health Monitoring, 26(10), e2420. https://doi.org/10.1002/stc.2420
- Valenti, S., Conti, M., Pierleoni, P., Zappelli, L., Belli, A., Gara, F., Carbonari, S., & Regni, M. (2018). A low cost wireless sensor node for building monitoring. In Proceedings of the IEEE Workshop on Environmental, Energy, and Structural Monitoring Systems (EESMS), Salerno, Italy, 21–22 June 2018.
- Wang, M. L., Lynch, J. P., & Sohn, H. (2014). Introduction to sensing for structural performance assessment and health monitoring. In M. L. Wang, J. P. Lynch, & H. Sohn (Eds.), Woodhead Publishing Series in Electronic and Optical Materials, Sensor Technologies for Civil Infrastructures (pp. 1–22). Woodhead Publishing. Volume 1.
- Wang, Y., Lynch, J., & Law, K. (2007). A wireless structural health monitoring system with multithreaded sensing devices: Design and validation. Structure and Infrastructure Engineering, 3(2), 103–120. https://doi.org/10.1080/15732470600590820
- Wondra, B., Malek, S., Botz, M., Glaser, S., & Grosse, C. (2019). Wireless high-resolution acceleration measurements for structural health monitoring of wind turbine towers. Data-Enabled Discovery and Applications, 3(1), 4. https://doi.org/10.1007/s41688-018-0029-y
- Xie, B., Li, J., & Zhao, X. (2020). Strain measurement based on speeded-up robust feature algorithm applied to microimages from a smartphone-based microscope. Sensors, 20(10), 2805. https://doi.org/10.3390/s20102805
- Yang, X., Li, H., Yu, Y., Luo, X., Huang, T., & Yang, X. (2018). Automatic pixel-level crack detection and measurement using fully convolutional network. Computer-Aided Civil and Infrastructure Engineering, 33(12), 1090–1109. https://doi.org/10.1111/mice.12412
- Yuan, Y., Ge, Z., Su, X., Guo, X., Suo, T., Liu, Y., & Yu, Q. (2021). Crack length measurement using convolutional neural networks and image processing. Sensors, 21(17), 5894. https://doi.org/10.3390/s21175894