
 ?Mathematical formulae have been encoded as MathML and are displayed in this HTML version using MathJax in order to improve their display. Uncheck the box to turn MathJax off. This feature requires Javascript. Click on a formula to zoom.
Abstract
The study analyzed the criminogenic effect of legalizing recreational marijuana dispensaries in Denver. Street segments with recreational dispensaries experienced no changes in violent, disorder and drug crime but did experience an 18% increase in property crime, and street segments adjacent to recreational dispensaries experienced some notable (but non-significant) drug and disorder crime increases. Medical dispensaries demonstrated no significant crime changes. A cost-benefit analysis found the associated crime costs were largely offset by sales revenue. Monetary benefits were much less pronounced, and barely cost effective, when only considering tax revenue.
Introduction
On January 1, 2014, the commercial sale of recreational marijuana to persons over the age of 21 commenced in Colorado. The move towards wholesale legalization of marijuana was initiated in November of 2012 when Colorado passed Amendment 64. This pioneering decriminalization statute extended beyond the prior legalized use of medical marijuana and made Colorado the first state to adopt recreational marijuana legislation, with marijuana now available for purchase by all eligible buyers over the age of 21 visiting or living in Colorado.
Despite growing public support for marijuana legislation (Felson, Adamczyk, & Thomas, Citation2019; Stringer & Maggard, Citation2016), and the continued passing of state-level legislation in the US,Footnote1 little is known about the potential criminogenic effect of opening a recreational marijuana dispensary. The existing research base has been primarily conducted at larger spatial extents, is focused on medical marijuana dispensaries (Morris, TenEyck, Barnes, & Kovandzic, Citation2014; Zakrzewski, Wheeler, & Thompson, Citation2019), and demonstrates that medical dispensaries usually do not have a significant effect on crime (Freisthler, Kepple, Sims, & Martin, Citation2013). In one of the first studies to take a rigorous, micro-level approach and focus on recreational marijuana dispensaries in Denver, Hughes, Schaible, and Jimmerson (Citation2019) determined that both medical and retail dispensaries led to disorder and crime increases at the neighborhood level. However, differences in business practices (i.e., medical vs. recreational), customer base, and store locations may lead to different criminogenic effects across dispensary types at even more localized levels. This warrants the consideration of units like street segments in addition to the conclusions previously produced through case-controlled research at the neighborhood level (Hughes et al., Citation2019).
The current study evaluated the effect of recreational and medical marijuana dispensaries individually on crime in Denver, Colorado at the street-segment level. Using a longitudinal microsynthetic control approach (Abadie, Diamond, & Hainmueller, Citation2010; Abadie, Diamond, & Hainmueller, Citation2015), we measured changes in violent, property, disorder, and drug crime levels from the three-year period before recreational marijuana legalization (2011–2013) against the three-year post-period (2014–2016). Analyses first measured the potential crime change locally by testing the individual street segments where each type of dispensary was located. We then measured the dispensaries’ spatial effects (Wheeler, Citation2018) by testing the criminogenic influence on street segments immediately adjacent to a dispensary segment to account for the spatial diffusion of crime. We concluded with a cost-benefit analysis to determine whether the monetary costs associated with the observed crime increases were offset by the revenue generated by recreational dispensaries.
This study contributes to the present knowledge base in several ways. First, similar to Hughes et al. (Citation2019), the present study considers the impact of recreational and medical marijuana dispensaries in Denver separately. Our study aims to provide new conclusions to the body of literature by utilizing street segments, which are at a smaller spatial extent than what has been previously studied for recreational dispensaries, and by situating results specific to the dispensary type. Zakrzewski et al. (Citation2019) also utilized micro-level units of analysis in their dispensary study in Washington, D.C. They incorporated a quasi-experimental design through propensity score matching, but their results were only focused on medical dispensaries. Further expanding upon the work of Zakrzewski et al. (Citation2019) and Hughes et al. (Citation2019), this analysis includes a micro-level, rigorous, case-controlled evaluation of the impact of both recreational and medical marijuana dispensaries. By testing the criminogenic influence of dispensaries at street segments, this study adds insights on the relationship between dispensaries and crime at a highly localized level. While the prior applications of larger spatial extents may be better positioned to account for the mobility of marijuana consumers and the resultant impact of marijuana usage and crime, the present study is better positioned to test for the immediate spatial impact of dispensaries on crime. Third, most prior research on dispensaries has not utilized case-controlled designs. The use of microsynthetic controls allowed for the comparison of dispensary-influenced segments to similarly situated counterfactuals. This study represents the first micro-level, street segment assessment of both dispensary types that tests treated and control groups that are statistically equivalent across several relevant covariates. Lastly, this study is the first to incorporate a cost-benefit framework that attempted to measure the relative costs of crime against recreational dispensary revenue.
Literature review
Despite theoretical arguments situating dispensaries as criminogenic, research has found that marijuana legalization and the opening of marijuana dispensaries does not significantly affect national crime rates in the UK (Braakman & Jones, Citation2014) or US (Dragone, Prarolo, Vanin, & Zanella, Citation2018). Findings have also emerged suggesting that medical marijuana legalization in the states bordering Mexico led to a reduction in violent crime (Gavrilova, Kamada, & Zoutman, Citation2017), and property crime reductions were observed at the state-level following medical legalization (Huber III, Newman, & LaFave, Citation2016). In some original state-level research on legalization and crime, Morris et al. (Citation2014) concluded that medical marijuana dispensaries had no effect on crime at the state-level and one of the first quasi-experimental study’s to test state-level criminogenic effects of recreational marijuana legalization in Washington State and Colorado also found that marijuana legalization had a non-significant effect on both property and violent crimes (Lu et al., Citation2019).
Studies examining the relationship between dispensaries and crime at lower spatial extents, like the neighborhood level, have also yielded sparse evidence of a criminogenic effect. Kepple and Freisthler (Citation2012) found that medical marijuana dispensary density in Sacramento, CA had no effect on crime at the census tract level, with a later replication study of medical marijuana dispensaries at the block group level by Freisthler, Ponicki, Gaidus, and Gruenewald (Citation2016) generating similar results. However, at the block group level, Contreras (Citation2017) conducted a study on medical marijuana dispensaries in Los Angeles, CA and determined that medical dispensaries generated an increase in crime rates in the block groups with medical dispensaries.
Although dispensaries are stationary, their criminogenic influence may produce spatial effects on crime beyond their immediate location, a phenomenon that has been previously observed with alcohol outlets (Wheeler, Citation2018). It then follows that there may be an observable crime increase in the nearby areas that is driven by the mobility of offenders and targets in the immediate built environment and exacerbated by the displacement of crime as a result of dispensary security measures. The conclusions produced by assessing adjacent neighborhood level units has created further conflict in the body of evidence, with Freisthler et al. (Citation2016) finding that higher densities of medical marijuana dispensaries in Long Beach, CA corresponded with increased rates of violent and property crime in the adjacent block groups.
Of interest to the current study, recent research has begun to test the effect of marijuana dispensaries in Denver. In some of the first research published in Denver, Freisthler, Gaidus, Tam, Ponicki, and Gruenewald (Citation2017) found that the density of recreational dispensaries in block groups impacted the likelihood of marijuana specific crime occurrence in both the immediate and adjacent block groups. Freisthler et al. (Citation2017) further determined that the density of recreational marijuana dispensaries in Denver was significantly related to marijuana-specific property crimes in block groups spatially adjacent to dispensaries and was also associated with increases in marijuana-specific crimes in both the immediate and adjacent block groups. However, it should be noted that this study combined the effect of recreational and medical dispensaries reducing the nuance of the results pertaining to dispensary type, did not include an empirical counterfactual for comparison, and did not control for other factors that may have led to crime increases. Furthermore, the neighborhood-level, census derived units of analysis operationalized in prior dispensary research have generated relatively mixed results, and differences in the measurement of spatial effects pertaining to unit size and density have also produced varied, and somewhat convoluted, conclusions regarding displaced, dispensary related crime. There are important nuances that can be better understood by studying the relationship between dispensaries and crime at the micro-level, given the heterogeneity found among micro-units in previous crime research.
The recent study of marijuana dispensaries in Denver by Hughes et al. (Citation2019) contributed to dispensary literature in multiple ways. They tested the relationship between dispensary type and crime in a case-controlled framework at the neighborhood level, while controlling for neighborhood characteristics among some other relevant risk factors including business types and transit locations. Examining yearly crime rates from 2012 to 2015 with Bayesian spatiotemporal Poisson regression models, they operationalized equally sized, neighborhood-based grid cells (1000 ft by 1000 ft in size) to determine if there was a significant difference in the level of crime in cells with dispensaries versus similar cells without dispensaries. They found that both dispensary types were associated with significant increases in disorder and crime. The observed positive relationship between marijuana dispensaries and crime was relatively weak, though, and in contradiction to prior research showing no effect on crime at larger units. Thereby, leading Hughes et al. (Citation2019) to emphasize the importance of continuing to use smaller units of analysis to capture the criminogenic effect of dispensaries that may be washed out with larger units of analysis.
Literature review summary and scope of the current study
Due to the potential differences across dispensary type, mixed results at the neighborhood level, and the widely recognized concentrated nature of crime, it is important to test this relationship between marijuana dispensaries and crime at the micro-level using street segments. Moreover, recent estimates indicate that recreational marijuana will soon become a multi-billion-dollar industry with the potential to create over 250,000 jobs (Borchardt, Citation2017a, Citation2017b). However, the cost-benefit considerations regarding potential crime increases and dispensary revenue have not been explored in the empirical literature.
Prior research has contributed to our understanding of the relationship between marijuana dispensaries and crime, and the current study attempts to build upon the foundations of prior research by focusing on the effect of marijuana dispensaries on crime in three specific ways. First, we take a micro-level approach by utilizing street segments as the unit of analysis. Street segments have been widely privileged in crime and place research due to their theoretical importance in organizing life within micro-units (Weisburd, Groff, & Yang, Citation2012), and through their practicality, connection to causal inference, and ability to observe variance across units with minimized error (Klinger & Bridges, Citation1997; Weisburd, Bushway, Lum, & Yang, Citation2004; Schnell, Braga, & Piza, Citation2017). Examining the relationship between dispensaries and crime at the street segment level may add relevant insights to the conflicting conclusions produced across larger spatial extents. Second, previous studies examining marijuana dispensaries are often cross-sectional and do not use a matched case-controlled design that best maximizes internal validity outside of randomization. The findings from these prior studies are important and relevant, but the micro-level, case-controlled, longitudinal nature of the current study may afford conclusions with additional insight and stability pertaining to the spatial effects of dispensaries. The operationalization of spatial effects through adjacent street segments may better capture the criminogenic impact of dispensaries than testing adjacent census block groups or tracts. Third, research has focused almost solely on the effect of medical dispensaries. We argue that there may be significant or notable differences in the dispensary type that can be better captured at the micro-level. Due to differences in business practices, clientele, and consumer volume, medical and recreational dispensaries may have disparate criminogenic impacts.
To test the effect of dispensaries on crime, we used the microsynthetic control approach (Abadie et al., Citation2010) to create a control group comprised of street segments that are statistically equivalent to the cumulative street segments in the treatment group to calculate the effect on crime. We test both the effects of marijuana dispensaries locally on street segments and through their spatial effects (Wheeler, Citation2018) on adjacent street segments. Lastly, we conducted a cost benefit analysis to contextualize any observed crime increases associated with recreational dispensaries by comparing the cost of increased crime with the local sales and tax revenue generated by Denver’s recreational marijuana dispensaries. The cost-benefit analysis determines whether the monetary benefits of the policy offset the monetary costs of a potential unintended crime increase.
Methodology
Study area
From 2010 to 2016, Denver’s population increased by about 15.5% (599,864–693,060), making it one of the fastest growing metropolitan areas in the United States according to figures reported by the U.S. Census. This number only reflects permanent residents, but it is germane to note that the tourism industry in Denver also generates about 30 million visitors annually. As a study backdrop, Colorado, and resultantly Denver, have been at the forefront of marijuana related legislation. In 2000 Colorado passed Amendment 20, which legalized the use of marijuana for specified medical conditions. Then, in 2014, Colorado enacted amendment 64, which allowed for the sale of recreational cannabis and resultantly generated over $686 million in total revenue in Denver from 2014 to 2016. This study covers the transition from 2011 to 2013 when only medical marijuana was sold, to 2014–2016 when recreational sale commenced.
Unit of analysis
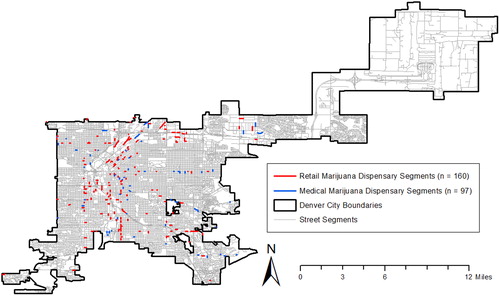
Following the framework of contemporary crime-and-place research, this study used street segments as the units of analysis (N = 30,806). Street segments comprise both block faces of a street situated between two intersections (Weisburd et al., Citation2004). In total, 186 different recreational marijuana dispensaries opened at some point during the post-legislation period on 160 unique street segments in Denver. The local place analyses first tested the criminogenic effect of the 160 segments that opened a recreational dispensary, and then the 97 unique street segments that housed a medical marijuana only dispensary in the post-period (see ).Footnote2 Due to the low count of dispensaries on each street segment, the presence of a singular dispensary was tested as opposed to magnitude or density measures that account for the few instances where multiple dispensaries of any type were located on the same segment.
Figure 1. Map of marijuana dispensaries in Denver, Colorado 2014–2016.
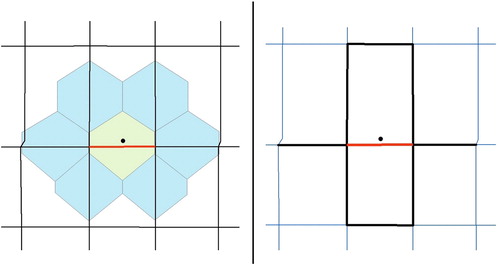
To assess spatial effects, a spatial weights matrix was used to identify the street segments adjacent to marijuana dispensaries (Wheeler, Citation2018). The spatial weights matrix was created in GeoDa by first converting street segments into centroid points, and then transforming the points into Thiessen polygonsFootnote3 using ArcMap 10.4.1. Next, using a first-order queen’s contiguity matrix, we identified the polygons that touch a dispensary polygon as spatial neighbors. We classified the identified adjacent segments as the spatial effects’ treatment group.Footnote4 This process created the spatially lagged marijuana dispensary variables used to measure spatial effects.Footnote5 below depicts the spatial effect area operationalization around marijuana dispensaries.
Figure 2. Spatial effect area development. The figure on the left depicts the Thiessen polygons generation process for every individual segment in the analysis. Each segment was assigned a center point, and the surrounding area was expanded into polygon form until the boundary became closer to a different segment. The blue polygons depict the spatial effects area around a recreational dispensary segment (yellow polygon). The figure on the right details the segments included in the spatial effects area analyses for each dispensary type (black segments). The black segments represent those those that are adjacent, spatial neighbors in a queen’s contiguity matrix to a dispensary segment (red).
Treatment and outcome variables
In both the recreational and medical local place analyses, the treatment variables were street segments that opened a marijuana dispensary in the post-legislation period (2014–2016). Segments that were spatial neighbors to marijuana dispensary segments comprised the treatment variable in the spatial effect analyses. Each post-period year was indexed sequentially in an additive capacity with three separate result sets (2014, 2014–2015, 2014–2016) to better account for the potential volatility immediately following legalization and to assess the potential for differences in the level of crime across expanding time-periods as more dispensaries opened.Footnote6 Medical marijuana dispensaries were also open in the pre-period, however, the analysis tests if the legalization of recreational marijuana exerted a criminogenic effect across marijuana dispensaries generally. Important to note, Colorado law requires all recreational marijuana dispensaries to operate under an active medical dispensary license, such that there are no recreational only dispensaries in Colorado. Due to potential changes in the customer base, growing usership of marijuana and related products, and with many medical dispensaries converting to sell recreationally, this study considers the legalization of recreational marijuana as an intervention for medical dispensaries.
The marijuana dispensary database used to create the treatment variables was purchased through InfoGroup and included a variable that designated recreational and medical only dispensaries separately. InfoGroup conducts yearly checks to update current licensure status and has been widely used in spatial research (e.g., Caplan, Kennedy, Barnum, & Piza, Citation2017; Piza & Gilchrist, Citation2018). The outcome variable crime data for 2011–2016 was provided by the Denver Police Department’s Data Analysis Unit and includes all offenses reported to police over the five-year time period. Each incident was pre-geocoded and specific crimes and crime categories were generated for analysis.Footnote7 The potential effect of marijuana dispensaries on crime was evaluated across four crime categories: property, violent, disorder and drugs ().
Table 1. Crime categories.
Matching variables
Treatment and synthetic control units were matched across several covariates of interest. The control variables that were operationalized as potentially confounding came from the US Census Bureau, the Denver Open Data PortalFootnote8 and InfoGroup.Footnote9 All covariate datasets contained XY coordinates or came as shapefiles that were easily transferable into a geographic information system (GIS) for subsequent spatial and statistical analyses. The selection of the control variables incorporated to contextualize the micro-environments within Denver were determined through prior environmental crime research and research specifically conducted on the spatial predictors of crime in Denver (Connealy & Piza, Citation2019; Hughes et al., Citation2019).
Monetary costs and benefits
Crime costs were determined from a cost-benefit analysis conducted by La Vigne, Lowry, Markman, and Dwyer (Citation2011), which compiled estimates from a series of studies that updated the original cost estimates of Cohen and colleagues (Citation1994) (i.e., Aos, Phipps, Barnoski, & Lieb, Citation2001; Durose & Langan, Citation2004; Roman & Chalfin, Citation2006; Roman, Woodard, Harrell, & Riggs, Citation1998; Stephan, Citation2004). La Vigne et al. (Citation2011: p. 22) identified both the cost to victims and the criminal justice costs associated with each crime type. Criminal justice costs are the sum of three sub-types of criminal justice expenditures: cost of arrests, cost of pre-sentence and adjudication, and cost of incarceration. Victim costs include both tangible (e.g., cost of medical care, etc.) and intangible (e.g., cost of pain and suffering, etc.) costs of victimization.Footnote10 By using both criminal justice and victim measures, we attempt to provide a complete account of crime costs by measuring both the impact of crime on municipal budgets (e.g., criminal justice costs) as well as the societal costs inflicted on residents of Denver generally. All crime costs were converted into 2015 (the median of our 3-year post period) dollars via the Bureau of Labor Statistics’ Consumer Price Index Inflation calculator (McCollister, French, & Feng, Citation2010; Piza, Gilchrist, Caplan, Kennedy, & O’Hara, Citation2016).Footnote11
To measure the monetary benefits provided by recreational marijuana dispensaries, we collected two categories of revenue: sales conducted by recreational dispensariesFootnote12 and recreational marijuana taxes collected by the City of Denver.Footnote13 Total tax revenue is comprised of two tax-based sources: sales tax collected directly by Denver (2.9% per purchase) and a portion of tax collected by the State of Colorado (10% tax rate per purchase) that is returned to Denver through an incentive program. Revenue data were collected from the monthly reports published by the Colorado Department of Revenue from 2014 to 2016.
Microsynthetic control matching
The microsynthetic control method is a recently developed matching technique (Abadie et al., Citation2010) that has become widely used when evaluating interventions (Robbins, Saunders, & Kilmer, Citation2017; Rydberg, McGarrell, Norris, & Circo, Citation2018). The microsynthetic approach differs from other matching techniques because of its ability to weight potential control candidates and approximate an exact match, as opposed to employing a matching technique that relies too heavily on selecting from proximate areas, thereby ineffectively weighting candidates by exclusively focusing on generating unit-to-unit matches (Saunders, Lundberg, Braga, Ridgeway, & Miles, Citation2015). Instead of calculating the crime reduction effect from street segment to street segment, the synthetic control method produces a statistic for the overall crime reduction effect when comparing areas of treatment to non-treated, weighted control areas to mimic pre-intervention crime levels for each dependent variable while also maintaining similar or equivalent values across other covariates (Rydberg et al., Citation2018).
Microsynthetic controls also allow for covariates to be assessed as time-stable or time-variant, so that the controls selected can be appropriately weighted. The use of time-conditioned variables can also be applied to post-period parameters, therefore allowing this study to examine sequenced year to year changes in the three post-period years. Additionally, because it does not depend on unit to unit comparison, microsynthetic controls can generate an approximately equal weighted control pool even when there is no single untreated case that is sufficiently like a single treated case, so cases are not dropped from the analysis and statistical power is maintained.
There were nine covariates incorporated in the matching model. Four covariates were specified as time-invariant exact matches,Footnote14 and five covariates were specified as time-variant, minimum matches.
Pre-period Outcome Crime Level: this variable includes the pre-period crime counts for each of the crime categories during each year prior to recreational legalization.
Street Type: this dichotomous variable is a proxy for general land use and distinguishes a segment as a commercial or local road.
Liquor Establishments: the presence of liquor related establishments on a segment was measured dichotomously. This covariate was included in recognition of the large body of research suggesting that liquor establishments have strong criminogenic effects (Gmel, Holmes, & Studer, Citation2016) and that their business model may situate them near dispensaries in entertainment districts.
High-crime Street Unit: this dichotomous measure indicates street segments that experienced high crime levels (the summation of all crimes in the study) in the pre-legalization period. High crime segments with crime levels in the 80th percentile and above (Braga, Hureau, & Papachristos, Citation2012) were assigned a value of 1. Matching on this ensures the control pool is weighted to reflect the same number of high crime segments as the treated pool.
Concentrated Disadvantage Index: this US Census data derived measure involves a standardized index comprised of the percentage of; residents who are Black, residents receiving public assistance, families living below the poverty line, female-headed households with children under the age of 18, and unemployed residents at the census block group level (Morenoff, Sampson, & Raudenbush, Citation2001; Sampson, Raudenbush, & Earls, Citation1997).Footnote15 Each street segment was assigned the value of its block group.
Street Segment Length: this measure indicates the length of every street segment in the study to ensure that longer segments with the potential to have more features are accounted for in the control group. The streets in Denver do not conform to the standardized grid across the entirety of the study area, rendering segment length especially important.
Commercial Activity: the total count of all businesses or commercially accessible establishments on each street segment in Denver was recorded in this variable as a proxy measure of the amount of commercially driven activity on a segment.Footnote16
Proportion of Pre-intervention High-crime Street Units in the Surrounding Census Block-group: high crime street units that cluster with other high crime street units may have more of a deleterious effect and may present a different set of challenges than singular high crime units in isolation. High crime clusters were calculated through a location quotient (LQ),Footnote17 which is measured at the block group level and the value generated is assigned to each segment within a block group.
Ambient Population: a measure of at-risk persons was included to account for the number of persons who frequent an area but may not reside in that particular area, (Andresen, Citation2011). The ambient population was calculated using the Oak Ridge National Laboratory's LandScan database, which provides a 24-hour estimate of the expected population present at a spatial scale of about 1km2 (Andresen, Citation2011, 195). Each segment was assigned the ambient population of the grid it was located in.
Balance was achieved across all time invariant and time varying variables for the treatment and control groups in both the local place analysis and the spatial effects analysis for both dispensary types (see ). Cumulative totals, as opposed to individual unit values, are represented for each variable across both groups. For example, in 2013 in the recreational marijuana local place analysis, 85 violent crimes occurred in the study treatment areas and the microsynth successfully produced an exact match of 85 for the weighted control.
Table 2. Treated and weighted control area balance table.
Statistical analysis
To statistically examine the potential criminogenic effect of marijuana dispensaries the R package microsynth was utilized (Robbins et al., Citation2017). The microsynth process for both recreational and medical dispensaries was administered across both the local and spatial analyses, across each sequential iteration of the three post-period years (2014, 2014–2015, 2014–2016), and across each of the four dependent variables separately. The impact of dispensaries on crime was estimated and linear difference-in-difference measures were generated comparing the treated areas to the controls. The estimator for the microsynthetic control analyses employs weighted least squares (WLS) and produces a separate model fit for each outcome variable (Rydberg et al., Citation2018). Treatment effect is calculated via the formula:
where Y denotes the outcome, j denotes the individual street segments in the study area, and t denotes the year.
Permutation-based “placebo” cases were modeled to determine if the treatment effects observed would hold constant across random treatment application (Abadie et al., Citation2015). The specific number of treated segments for each analysis was randomly selected from the control pool and 99 iterative permutation models were conducted to see if the observed effect on the actual treated units significantly differed from random treatment application. The permutation test results are then utilized to estimate p-values for the individual outcome variable test statistics (Carsey & Harden, Citation2014; Robbins et al., Citation2017).
The crime change estimates generated by the microsynth command were subsequently used in the cost-benefit analysis for recreational marijuana dispensaries. For crimes experiencing a significant increase, we multiplied the difference in post-intervention counts between treated and control areas by the observed cost of the crime type. For crime categories comprised of multiple types (e.g., property crime) we used the median cost of the disaggregate crime types. To recognize the inherent uncertainty in calculating monetary crime costs, we generated upper-bound and lower-bound estimates using the 95% confidence interval around the crime count difference (La Vigne et al., Citation2011). To measure the level to which the cost of crime increases was offset by the marijuana generated revenue, we calculated cost benefit ratios (CBR) via the formula:
where B is the monetary benefit of the recreational marijuana revenue and C is the cost of the crime increase. CBR values above one would indicate that the recreational marijuana revenue offset the costs of any observed crime increases.
An important consideration in cost-benefit analysis is the issue of standing, which is determining whose interests are to be counted (Whittington & MacRae, Citation1986). We feel the different marijuana revenue categories pertain to the “standing” of different societal factions. The sales revenue reflects the interests of the dispensary owners and employees, as these individuals are the primary beneficiaries of the proceeds. The tax revenue is beneficial to all residents of Denver, as these funds are allocated to fund municipal projects such as education and infrastructure. In recognition of the different standing reflected in the revenue figures, we calculated two separate CBRs. The first uses the sales revenue as the numerator in the formula to reflect the interests of the recreational dispensary business owners and employees. The second uses the tax revenue as the numerator to reflect the interests of the general population of Denver.
We conducted the cost-benefit analysis using the crime types that exhibited a significant increase at p.<0.05. As a robustness check, we conducted an additional analysis where all crimes with increases approaching significance (p.<0.10) were added to the calculation. The robustness check ensures the rigor of findings against a range of alternate assumptions (Welsh, van der Lann, & Hollis, Citation2013) and indicates the range of values within which such alternate assumptions can be safely ignored (Barnett & Escobar, Citation1987).
Results
Local place analyses
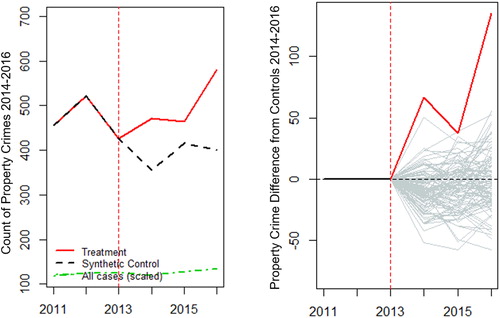
The results indicate that street segments with a recreational marijuana dispensary experienced a statistically significant increase in the level of property crime relative to controls. During the time-period spanning all three post-period years (2014–2016), recreational marijuana dispensaries corresponded with about an 18.8% increase in property crimes in the post-period relative to controls, with approximately 239 more property crimes occurring in the treatment area during the post-intervention period spanning 2014–2016. Although some of the other percent differences and permutations were notably high, no other crime categories across any of the tested time-periods experienced significant changes (see ).
Table 3. Recreational marijuana dispensaries local analysis.
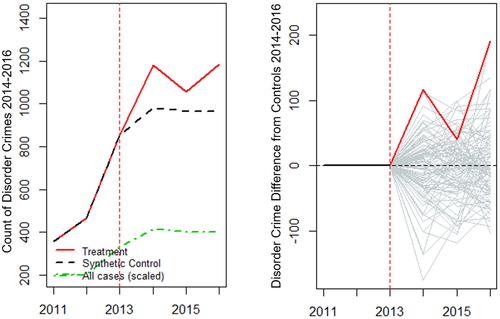
The results of the property crime model are further detailed in . The graph on the left shows an exact match approximation for the pre-period treated units and the weighted synthetic controls, and a marked increase in the level of property in the treated area following intervention commencement against a drop in the controls. In 2014 and 2015, the treated area property crime trend is higher than the controls, and in 2016 the disparity between the treatment and controls is further exacerbated. This suggests that the criminogenic effect of recreational marijuana dispensaries for property crimes may have continued to increase over time until attaining significance. The graph on the right shows the permutations tested to determine if the observed treated effect was significantly different than 99 randomized trials with mock treated units. The results of the permutation analysis indicate the observed increase in property crime at recreational marijuana dispensaries is likely not due to random chance.
Figure 3. Recreational marijuana local analysis property crime effect estimates.
The analyses of crime at medical marijuana dispensary segments indicate that medical marijuana segments maintained crime levels that were almost identical to the corresponding pool of controls. In addition to their non-significant criminogenic effect, the medical marijuana segments sometimes experienced fewer crimes than the controls, although these percent differences were also not significant.
Spatial effects analysis
displays the tabular findings of the recreational spatial effect models. None of the dependent variables demonstrated significant crime increases. However, two outcome variables approached significance (p.<0.10) such that several of the disparities between the treated and control units warrant further discussion. In the post-period from 2014 to 2015, drug crimes were approaching significance and were about 28.4% higher in treated areas relative to controls. This result indicates that drug crimes were more likely to occur in segments adjacent to a recreational dispensary as opposed to control segments, or even dispensary segments themselves. In the 2014–2016 time-period analyses, disorder crimes approached significance at a metric about 17.4% higher than controls. Although not attaining significance, the results indicate sizeable differences in disorder and drug crimes across treated and control units adjacent to dispensaries.
Table 4. Recreational marijuana dispensaries spatial effects analysis.
details the drug crime changes in the spatial effect models for recreational marijuana dispensaries from 2014 to 2015. The graph on the left charting drug crimes from 2014 to 2015 depicts a large spike in drug crimes immediately following recreational legalization that continues in an upward trajectory into 2015, which likely led to the marginally significant increase. Despite not attaining significance, testing the observed effect against random permutations indicated the actual treated effect remains higher than most permutations. The disorder crimes from 2014 to 2016 detailed in were more volatile with increases and decreases, but the initial increase and the second spike diverge greatly from the relatively stable controls. Despite not attaining significance from 2014 to 2016, the percent differences were high across the treated and control units.
Figure 4. Recreational marijuana spatial effects analysis drug crime effect estimates.
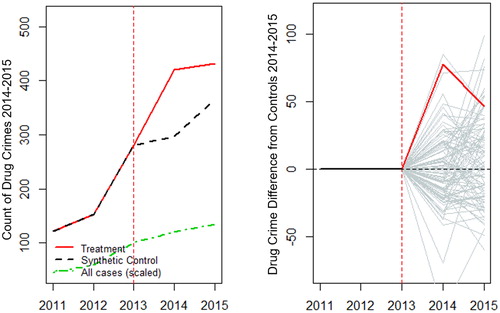
Figure 5. Recreational marijuana spatial effects analysis disorder crime effect estimates.
The medical marijuana spatial effects models did not demonstrate significant crime changes in either direction. The segments immediately adjacent to medical dispensaries experienced nearly identical trends to the selected controls. Across all time-periods and outcome crime variables, medical marijuana dispensaries maintained non-significance.Footnote18
Cost-benefit analysis
displays the cost of each crime type considered in the cost-benefit analyses for the current study: burglary, larceny/theft, stolen property, and motor vehicle theft comprised the property crime category, and disorder and drug crimes. For each crime type, the total criminal justice cost (as well as the disaggregate criminal justice cost categories), victim cost, and total crime cost are provided. For the cost benefits analysis, the significant property crime difference from 2014 to 2016 (see ) was multiplied by the median value to obtain the crime costs.
Table 5. Cost of Crime Incidents.
displays the cost of the observed significant property crime increases. The approximately 239 additional property crime incidents from 2014 to 2016 depicted in the microsynth results are responsible for over $169 K in victim costs and over $1.95 M in criminal justice costs, totaling over $2.1 M. Disorder and drug crimes in the spatial analysis were approaching significance, so a sensitivity analysis was also conducted that included all crimes with a p. <.10 in addition to the significant property crime increase. indicates that an increase of about 506 disorder crimes from 2014 to 2016 corresponds with about a $150 K in victim costs and over $18 M in criminal justice costs. Similarly, the approximate increase of 188 drug crimes from 2014 to 2015 (see ) results in about $8 K in victim costs and over $2.5 M in criminal justice costs. sums the overall cost of the crime increases, which total over $23 M when both victim and criminal justice costs are considered. displays the revenue generated from recreational marijuana dispensaries. In total, recreational marijuana dispensaries generated over $686 M over the 3-year legalization period (2014–2016). Sales accounted for about $658 M with tax revenue contributing over $27 M (about $18 M in sales and $9 M in state tax) of revenue
Table 6. Costs of crime increases and Denver marijuana revenue.
displays the findings of the cost-benefit analysis. Sales and tax revenue were considered against the benefits of recreational marijuana legalization. For sales alone, the revenue generated by recreational marijuana dispensaries outweighed the cost of the local property crime increase. As seen in , the CBR for sales revenue was 309.4, suggesting that for every $1 cost associated with the property crime increase, recreational marijuana dispensaries generated over $309 in sales revenue. In the tax revenue analysis of the local property crime increase (also ), the CBR supported the monetary benefit of recreational marijuana dispensaries, but to a lesser extent than the sales analysis. Findings demonstrated that for every $1 property crime cost, recreational dispensaries generated almost $13 in tax revenue. displays the findings of the sensitivity analysis with all the crime increases at p. <.10 included. The results suggest that the revenue generated by recreational dispensaries is not as substantial in offsetting the associated costs of the local property and spatial disorder and drug crime increases. The sales revenue numbers reflect only $28 of revenue generation relative to every $1 cost of crime, and the tax revenue results paint a bleaker picture, indicating that every $1 cost of crime is only offset by about a $1.18 gain in tax revenue.
Table 7. Denver marijuana revenue and cost-benefit ratios.
Discussion and conclusion
Following the framework of Hughes et al. (Citation2019) who examined the criminogenic effect of dispensary types in a case-controlled design at the neighborhood level, the use of microsynthetic controls in this study represented some of the first research on dispensaries and crime to examine micro-level units of analysis in a case-controlled, longitudinal design. The findings presented add to the discussion on the criminogenic effect of dispensary types at a previously unexplored spatial extent. Contrary to Hughes et al. (Citation2019), though, the present study found noteworthy differences across dispensary types and how they affect crime at the micro-level. Recreational marijuana dispensaries demonstrated a criminogenic effect locally and some notable increases spatially, whereas medical marijuana dispensaries did not demonstrate a significant effect on any crime in any time-period. There may be several explanations that distinguish medical dispensaries as non-criminogenic compared to recreational dispensaries. For example, medical marijuana is more restricted in its consumer base, which may control the types of users these dispensaries serve. Furthermore, since medical marijuana has been legal in Denver since 2000, dispensary operations and the approach to law enforcement may be more defined and less affected by recency. The differences observed across dispensary types impacts their respective criminogenic status in future crime and place research, the debate on legalization, and potential enforcement/security approaches by dispensary type.
There were also observed differences in the types of crimes, and the intensity to which, dispensaries impact crime locally and spatially. The opening of recreational dispensaries resulted in about an 18.8% increase in property crime on segments with a recreational dispensary relative to controls. However, property crime was the only crime type that experienced a significant increase at recreational dispensaries locally, but recreational dispensaries did not lead to increased levels of property crimes spatially. Instead, recreational dispensaries exerted a measurable effect on drug and disorder crimes spatially. Despite these increases only approaching significance (p.<0.10), this novel finding suggests that the criminogenic effect of dispensaries is not limited to the dispensary but may also extend to the immediately surrounding area. Several reasons may explain the significant increases in disorder and drug crimes on the segments adjacent to dispensaries. First, the level of security at dispensaries may prohibit crime from occurring onsite due to the dispensaries vested interest in conducting safe business practices and maintaining their active licensure. Although not actively monitored or regulated, the Marijuana Enforcement Division of the Colorado Department of Revenue requires several safeguards at all dispensaries including; video surveillance, security alarms, and in many cases, dispensaries are hiring their own security personnel. Second, the observed increases in drug and disorder crimes may be a function of the selected police enforcement approach. Law enforcement entities in Denver may have focused their efforts in areas nearby dispensaries and may have more actively policed order-based disorder and drug related offenses in their response to concerns about legalization. These crime increases could reflect police activity as opposed to behavioral shifts resulting from legalization, since the offense data used in this study is a proxy measure for police practices and discretion.
The results of the analysis suggest that there may be parallels between marijuana dispensaries and other business types consistently identified as crime generators in the crime-and-place literature. Alcohol outlets, for example, have consistently demonstrated a significant, positive relationship with crime (Feng, Piza, Kennedy, & Caplan, Citation2018; Wheeler, Citation2018; White, Gainey, & Triplett, Citation2015), and in this study it was determined that recreational marijuana dispensaries may have a similar criminogenic effect (Wheeler, Citation2018). However, despite their relationship to crime, recreational dispensaries also may not involve the same “prompts” that precipitate crime opportunities as alcohol outlets (Wortley, Citation2008). For example, recreational dispensaries are not open late at night like alcohol outlets, and do not allow for essentially unregulated onsite consumption. Nonetheless, when situating dispensaries against alcohol outlets, despite their well-researched criminogenic effect, we are unaware of any large-scale efforts to decrease the number of liquor licenses cities issue. To the contrary, alcohol outlets are common fixtures in urban development and revitalization efforts. There is an apparent trade-off between the economic potential of recreational dispensaries and increases in the volume of people engaging in commercial activity at or near their locations, which may lend itself to crime opportunities under a generator framework. However, this negative external affect also exists for any person-generating establishment or business improvement district (Clutter, Henderson, & Haberman, Citation2019), and is not exclusively specific to recreational dispensaries. Given the recent changes in public attitudes towards marijuana (Felson et al., Citation2019; Stringer & Maggard, Citation2016), a similar acceptance of recreational marijuana dispensaries may be present amongst the public even amidst crime related concerns.
The results of the CBA provide some important context to the recreational dispensary crime increases. Any observed crime increase is an unintended negative consequence that needs to be holistically situated within public policy discussions. Therefore, the observed crime increases must remain a focal consideration when assessing recreational marijuana legalization. However, the significant revenue recreational dispensaries generated in Denver may lead jurisdictions to consider their resources and ability to thwart a potential crime increase while introducing legalization. With medical marijuana legalized in 33 states (13 additional states have passed more restricted forms of medical legalization) and recreational marijuana legalized in eleven states, monetary gain needs to be weighed against the potential criminogenic effect prior to passing legislation. This also suggests that policy makers should determine whether the public would tolerate crime increases, especially for non-violent forms of crime, given the potential monetary benefits of recreational marijuana legalization, or if the public would rather not take on the potential burden of extra crime associated with recreational marijuana dispensaries despite the potential for increased revenue.
The CBA suggests that for every local property crime experienced, there is a substantial offset in revenue relative to the cost of crime. Taken alone, the property crime increase reflects poorly on legalization, however, the costs of crime may be partially mitigated, and potentially reconciled with, due to the substantial revenue generated. The sales volumes and the potential boost to the local economy may be an incentive for legalization despite some crime related concerns. Although, the sensitivity analysis including the spatial disorder and drug crime increases indicated that the revenue generations were much more marginal when considering other notably impacted, but not significant, crime types. Since, tax revenue alone is not enough to offset the cost of crime, it is imperative sales volumes remain high to counter crime expenses. However, from a public policy perspective, considering sales revenue as a public benefit assumes that some portion of the revenue funds programs and/or services that benefit the general population in a similar manner as tax revenue. Our data did not allow us to make such a determination on the public effect of the sales revenue.
Despite the important implications of the findings, this study suffers from specific limitations that the reader should be aware of. First, because this study only focused on the impact of dispensaries in Denver the results may not be generalizable to other jurisdictions considering legalization. Future research should incorporate multiple cities to determine if the results hold constant across different environments, especially non-metropolitan settings with potentially lower sales volumes. Second, offense data was the only enforcement data obtained for the study, which may fail to include crime related to dispensaries that was not reported to police, and moreover, little is known about the policing approach utilized at dispensaries and how that may impact offense data. If crime was handled by dispensary security and therefore not reported, or police approached dispensaries in a unique and different way than other areas in the city, the findings may be interpreted differently. Dispensaries may have different levels of security and different business models that could impact their influence on crime. For example, recreational mom and pop “weed shops” may produce a different criminogenic effect than holistic healing centers.
Prior research has also provided considerable evidence for the spatial effects related to consumer practices, whereas the present application of micro-level units focuses more on the impact of the dispensary itself. Crimes like driving under the influence or other crimes associated with the mobility of consumers or the elapsed time between purchase and consumption are not adequately captured within the study’s data sources or operationalization of spatial effects. Outside of dispensary location and type, no other dispensary characteristics were incorporated. Finally, we acknowledge that the cost-benefit analysis did not measure all the possible detriments of recreational legalization. Adverse costs of recreational legalization were limited to crime increases, but there are other potentially adverse effects that could have occurred, such as users becoming more likely to drive under the influence (Cheon, Decker, & Katz, Citation2018) or increased access for underage users. However, given the large CBR values observed for sales revenue, the adverse effects would have to be quite large to offset the benefits given that sales continue to increase in Denver. Still, we acknowledge that we only account for a sample of potential monetary costs and recommend that future cost-benefits analyses include a more conclusive list of the adverse effects of recreational dispensaries.
Disclosure statement
No potential conflict of interest was reported by the authors.
Notes
1 There are now 11 states, plus DC, with recreational marijuana laws (www.governing.com, 2019).
2 Only 36 street segments simultaneously housed separate recreational and medical marijuana dispensaries. This is a relatively small amount of co-location when considering the number of dispensaries in Denver, and thus, the presence of the other dispensary type was not controlled for in the local analyses.
3 Thiessen polygons begin with a center point and continuously expand in size in all directions until the boundaries become closer to the boundaries of another expanding point in the dataset.
4 To reduce the influence of the segments with a dispensary on the spatial effect analysis, all segments with a dispensary (regardless of the type) were dropped from the analysis even if they were a spatial neighbor for a different segment with a dispensary. Thus, dispensary segments were not doubly counted.
5 The study incorporated 924 segments in the recreational marijuana spatial effects analysis and 583 segments for the medical marijuana spatial effects analysis.
6 Although few dispensaries appeared to have closed in the post-period, many were not open for the entirety of the three-year time period. The exact date a dispensary opened and/or closed was not provided within the data. Using the additive time-periods as opposed to exclusively running the post-period as a three-year blocked time period may better capture some of the potential differences in crime levels across each year post legalization.
7 The geocoding rate for all crimes using the provided XY coordinates was 99.7%.
9 InfoGroup: ATMs, bars, banks, check-cashing/payday loans, liquor stores, nightclubs/lounges, and restaurants. Denver Open Data Portal: food stores, shopping centers, retail stores, motels, hotels, supermarkets, small grocery stores, supercenters, convenience stores, and dollar stores.
10 We acknowledge recent critiques of using intangible costs in cost-benefit analysis, specifically that such measures are likely biased upwards (Tonry, Citation2015) and provide little practical value to policy makers limited by budget constraints (Piza et al., Citation2016). However, we felt including intangible victim costs was important given the nature of the policy being evaluated. Given that crime level changes are a possible side effect, rather than primary goal, of recreational marijuana legalization including intangible costs ensures that the full effect of the unintended crime increase is reflected in the analysis.
14 Covariates 1–4 on the list.
15 Each of the five measures is transformed from a percentage to a z-score and then is summated into a singular score representing the standard deviation from the mean disadvantage level for every census block group in the study area (there are 481 unique census block groups in Denver).
16 The following commercial establishments comprised the commercial activity count variable: ATMs, bars, banks, check-cashing/payday loans, nightclubs/lounges, food stores, shopping centers, recreational stores, motels, hotels, supermarkets, small grocery stores, supercenters, convenience stores, and dollar stores.
17 Adapted from regional planning, LQs allow for the identification of areas with features of interest (in this case, high crime street units) that are higher, lower, or at the expected city-wide rate (Brantingham & Brantingham, Citation1997).
18 Tables and figures for all non-significant results are presented in an appendix available as online supplemental material.
References
- Abadie, A., Diamond, A., & Hainmueller, J. (2010). Synthetic control methods for comparative case studies: Estimating the effect of California’s tobacco control program. Journal of the American Statistical Association, 105(490), 493–505.
- Abadie, A., Diamond, A., & Hainmueller, J. (2015). Comparative politics and the synthetic control method. American Journal of Political Science, 59(2), 495–510. doi:10.1111/ajps.12116
- Andresen, M. (2011). The ambient population and crime analysis. The Professional Geographer, 632, 193–212. doi:10.1080/00330124.2010.547151
- Aos, S., Phipps, P., Barnoski, R., & Lieb, R. (2001). The comparative costs and benefits of programs to reduce crime version 4.0. Olympia, WA: Washington State Institute for Public Policy.
- Barnett, S., & Escobar, C. (1987). The economics of early educational intervention: A review. Review of Educational Research, 574, 387–414. doi:10.2307/1170429
- Borchardt, D. (2017a). Marijuana sales totaled $6.7 billion in 2016. Forbes.
- Borchardt, D. (2017b). Marijuana industry projected to create more jobs than manufacturing by 2020. Forbes.
- Braakman, N., & Jones, S. (2014). Cannabis depenalization, drug consumption and crime: Evidence from the 2004 cannabis declassification in the UK. Social Science & Medicine, 115, 29–37. doi:10.1016/j.socscimed.2014.06.003
- Braga, A. A., Hureau, D. M., & Papachristos, A. V. (2012). An ex post facto evaluation framework for place-based police interventions. Evaluation Review, 356, 592–626. doi:10.1177/0193841X11433827
- Brantingham, P., & Brantingham, P. (1997). Mapping crime for analytic purposes: Location quotients, counts, and rates. In L. W. David & J. M. Tom (Eds.), Crime mapping and crime prevention. Crime prevention studies (Vol. 8, pp. 263–288). Monsey, NY: Criminal Justice Press.
- Caplan, J., Kennedy, L., Barnum, J., & Piza, E. (2017). Crime in context: Utilizing risk terrain modeling and conjunctive analysis of case configurations to explore the dynamics of criminogenic behavior settings. Journal of Contemporary Criminal Justice, 332, 133–151. doi:10.1177/1043986216688814
- Carsey, T., & Harden, J. (2014). Monte Carlo simulation and resampling methods for social science. Thousand Oaks, CA: Sage.
- Cheon, H., Decker, S., & Katz, C. (2018). Medical marijuana and crime: Substance use and criminal behaviors in a sample of arrestees. Journal of Drug Issues, 482, 182–204. doi:10.1177/0022042617743775
- Clutter, J., Henderson, S., & Haberman, C. (2019). The impact of business improvement district proximity on street block robbery counts. Crime & Delinquency, 65(8), 1050–1075. doi:10.1177/0011128719834559
- Cohen, MA., Miller, T.R. & Rossman, S.B. (1994). The costs and consequences of violent behavior in the United States. In: Reiss, A & Roth, J., editors. Understanding and Preventing Violence: Consequences and Control. Vol. 4. National Academy Press: Washington, DC: 1994. pp. 67–166.
- Connealy, N., & Piza, E. (2019). Risk factor and high-risk place variations across different robbery targets in Denver, Colorado. Journal of Criminal Justice, 60, 47–56. doi:10.1016/j.jcrimjus.2018.11.003
- Contreras, C. (2017). A block-level analysis of medical marijuana dispensaries and crime in the City of Los Angeles. Justice Quarterly, 346, 1069–1095. doi:10.1080/07418825.2016.1270346
- Dragone, D., Prarolo, G., Vanin, P., & Zanella, G. (2018). Crime and the legalization of recreational marijuana. Journal of Economic Behavior and Organization, 431, 1–14.
- Durose, M., & Langan, P. (2004). Felony sentences in state courts. 2002. Bureau of Justice Statistics Bulletin. NCJ 1206916. Washington, DC: U.S. Department of Justice.
- Felson, J., Adamczyk, A., & Thomas, C. (2019). How and why have attitudes about cannabis legalization changed so much? Social Science Research, 78, 12–27. doi:10.1016/j.ssresearch.2018.12.011
- Feng, S., Piza, E., Kennedy, L., & Caplan, J. (2018). Aggravating effects of alcohol outlet types on street robbery and aggravated assault in New York City. Journal of Crime and Justice, 42(3), 257–273. doi:10.1080/0735648X.2018.1559076
- Freisthler, B., Gaidus, A., Tam, C., Ponicki, W., & Gruenewald, P. (2017). From medical to recreational marijuana sales: Marijuana outlets and crime in an era of changing marijuana legislation. The Journal of Primary Prevention, 383, 249–263. doi:10.1007/s10935-017-0472-9
- Freisthler, B., Kepple, N., Sims, R., & Martin, S. (2013). Evaluating medical marijuana dispensary policies: Spatial methods for the study of environmentally-based interventions. American Journal of Community Psychology, 51(1–2), 278–288. doi:10.1007/s10464-012-9542-6
- Freisthler, B., Ponicki, W., Gaidus, A., & Gruenewald, P. (2016). A micro-temporal geospatial analysis of medical marijuana dispensaries and crime in Long Beach, California. Addiction, 1116, 1027–1035. doi:10.1111/add.13301
- Gavrilova, E., Kamada, T., & Zoutman, F. (2017). Is legal pot crippling Mexican drug trafficking organizations? The effect of medical marijuana laws on US crime. The Economic Journal, 129(617), 375–407. doi:10.1111/ecoj.12521
- Gmel, G., Holmes, J., & Studer, J. (2016). Are alcohol outlet densities strongly associated with alcohol-related outcomes? A critical review of recent evidence. Drug and Alcohol Review, 35(1), 40–45. doi:10.1111/dar.12304
- Huber, A., III, Newman, R., & LaFave, D. (2016). Cannabis control and crime: Medical use, depenalization and the war on drugs. B.E. Journal of Economic Analysis and Policy, 16(4).
- Hughes, L., Schaible, L., & Jimmerson, K. (2019). Marijuana dispensaries and neighborhood crime and disorder in Denver, Colorado. Justice Quarterly, 1–25. doi:10.1080/074188.2019.1567807
- Kepple, N., & Freisthler, B. (2012). Exploring the ecological association between crime and medical marijuana dispensaries. Journal of Studies on Alcohol and Drugs, 73(4), 523–530. doi:10.15288/jsad.2012.73.523
- Klinger, D., & Bridges, G. (1997). Measurement error in calls-for-service as an indicator of crime. Criminology, 35(4), 705–726. doi:10.1111/j.1745-9125.1997.tb01236.x
- La Vigne, N., Lowry, S., Markman, J., & Dwyer, A. (2011). Evaluating the use of public surveillance cameras for crime control and prevention. US Department of Justice, Office of Community Oriented Policing Services. Washington, DC: Urban Institute, Justice Policy Center.
- Lu, R., Willits, D., Stohr, M., Makin, D., Snyder, J., Lovrich, N., … Hemmens, C. (2019). The cannabis effect on crime: Time-series analysis of crime in Colorado and Washington State. Justice Quarterly, 1–31. doi:10.1080/07418825.2019.1666903
- McCollister, K., French, M., & Feng, H. (2010). The cost of crime to society: New crime-specific estimates for policy and program evaluation. Drug and Alcohol Dependence, 1081(2), 98–109. doi:10.1016/j.drugalcdep.2009.12.002
- Morenoff, J., Sampson, R., & Raudenbush, S. (2001). Neighborhood inequality, collective efficacy, and the spatial dynamics of urban violence. Criminology, 393, 517–558. doi:10.1111/j.1745-9125.2001.tb00932.x
- Morris, R., TenEyck, M., Barnes, J., & Kovandzic, T. (2014). The effect of medical marijuana laws on crime: Evidence from state panel data, 1990-2006. PLoS One, 9(3), e92816. doi:10.1371/journal.pone.0092816
- Piza, E., & Gilchrist, A. (2018). Measuring the effect heterogeneity of police enforcement actions across spatial contexts. Journal of Criminal Justice, 54, 76–87. doi:10.1016/j.jcrimjus.2017.12.007
- Piza, E., Caplan, J., & Kennedy, L. (2014). Analyzing the influence of micro-level factors on CCTV camera effect. Journal of Quantitative Criminology, 302, 237–264. doi:10.1007/s10940-013-9202-5
- Piza, E., Gilchrist, A., Caplan, J., Kennedy, L., & O’Hara, B. (2016). The financial implications of merging proactive CCTV monitoring and directed police patrol: A cost-benefit analysis. Journal of Experimental Criminology, 123, 403–429. doi:10.1007/s11292-016-9267-x
- Robbins, M., Saunders, J., & Kilmer, B. (2017). A framework for synthetic control methods with high-dimensional, micro-level data: Evaluating a neighborhood-specific crime intervention. Journal of the American Statistical Association, 112517, 109–126. doi:10.1080/01621459.2016.1213634
- Roman, J., & Chalfin, A. (2006). Does it pay to invest in reentry programs for jail inmates? Washington, DC: Urban Institute. Retrieved from www.urban.org/ReentryRoundtable/roman_chalfin.pdf
- Roman, J., Woodard, J., Harrell, A., & Riggs, S. (1998). Relative costs and benefits of the superior court drug intervention program. Washington, DC: The Urban Institute. Retrieved from www.urban.org/publications/407753.html.
- Rydberg, J., McGarrell, E., Norris, A., & Circo, G. (2018). A quasi-experimental synthetic control evaluation of a place-based police-directed patrol intervention on violent crime. Journal of Experimental Criminology, 14(1), 83–109. doi:10.1007/s11292-018-9324-8
- Sampson, R., Raudenbush, S., & Earls, F. (1997). Neighborhoods and violent crime: A multilevel study of collective efficacy. Science, 277(5328), 918–924. doi:10.1126/science.277.5328.918
- Saunders, J., Lundberg, R., Braga, A., Ridgeway, G., & Miles, J. (2015). A synthetic control approach to evaluating place-based crime interventions. Journal of Quantitative Criminology, 31(3)3, 413–434. doi:10.1007/s10940-014-9226-5
- Schnell, C., Braga, A., & Piza, E. (2017). The influence of community areas, neighborhood clusters, and street segments on the spatial variability of violent crime in Chicago. Journal of Quantitative Criminology, 33(3), 469–496. doi:10.1007/s10940-016-9313-x
- State marijuana laws in 2019 map. (2019). Governing: The state and localities. Retrieved from http://www.governing.com/gov-data/safety-justice/state-marijuana-laws-map-medical-recreational.html
- Stephan, J. (2004). State prison expenditures, 2001. NCJ Publication No. 202949. Washington, DC: U.S. Department of Justice, Bureau of Justice Statistics.
- Stringer, R., & Maggard, S. (2016). Reefer madness to marijuana legalization. Journal of Drug Issues, 464, 428–445. doi:10.1177/0022042616659762
- Tonry, M. (2015). The fog around cost-of-crime studies may finally be clearing. Prisoners and their kids suffer too. Criminology & Public Policy, 144, 653–671. doi:10.1111/1745-9133.12170
- United States Census. Denver population. Retrieved from https://www.census.gov/quickfacts/fact/table/denvercountycolorado#viewtop
- Weisburd, D., Bushway, S., Lum, C., & Yang, S. (2004). Trajectories of crime at places: A longitudinal study of street segments in the city of Seattle. Criminology, 422, 283–321. doi:10.1111/j.1745-9125.2004.tb00521.x
- Weisburd, D., Groff, E., & Yang, S. (2012). The Criminology of place: Street segments and our understanding of the crime problem. Oxford: Oxford University Press.
- Welsh, B., Van Der Laan, P., & Hollis, M. (2013). Systematic reviews and cost-benefit analysis: Toward evidence-based crime policy. In B. C. Welsh, A. A. Braga, & G. J. N. Bruinsma (Eds.), Experimental criminology. Prospects for advancing science and public policy (pp. 253–276). New York, NY: Cambridge University Press.
- Wheeler, A. (2018). Quantifying the local and spatial effects of alcohol outlets on crime. Crime and Delinquency, 1–27.
- White, G., Gainey, R., & Triplett, R. (2015). Alcohol outlets and neighborhood crime. Crime & Delinquency, 616, 851–872. doi:10.1177/0011128712466386
- Whittington, D., & MacRae Jr, D. (1986). The issue of standing in cost-benefit analysis. Journal of Policy Analysis and Management, 64, 665–682. doi:10.2307/3324877
- Wortley, R. (2008). Situational precipitators of crime. In R. K. Wortley & L Mazerolle (Eds.), Environmental criminology and crime analysis. 51–53. New York, NY: Routledge.
- Zakrzewski, W., Jr., Wheeler, A. P., & Thompson, A. J. (2019). Cannabis in the capital: Exploring the spatial association between medical marijuana dispensaries and crime. Journal of Crime and Justice, 1–15. doi:10.1080/0735648X.2019.82351