
 ?Mathematical formulae have been encoded as MathML and are displayed in this HTML version using MathJax in order to improve their display. Uncheck the box to turn MathJax off. This feature requires Javascript. Click on a formula to zoom.
Abstract
The City of Los Angeles Mayor’s Office of Gang Reduction and Youth Development (GRYD) program was conceived as a comprehensive response to gang violence. Unlike most comprehensive approaches, suppression was excluded from the primary model. Program services including community engagement, gang prevention and intervention services, and street-based violence interruption, were formally launched in late 2011. Strict geographic eligibility criteria mean that GRYD services were available in some Los Angeles communities and not others. Using the geographic structure of GRYD, we use a place-based difference-in-differences model to estimate the effect of GRYD services on both violent and property crime. The analyses suggest a reduction in violent crime of around 18% in areas exposed to GRYD Comprehensive Strategy services, including aggravated assault and robbery. Similar declines are not observed in property crimes including burglary and car theft. Comparison with evaluations of placed-based gang injunctions demonstrate that GRYD is able to achieve nearly one-half of the reductions in crime without a suppression focus.
Introduction
Violence prevention programs may incorporate a wide range of services and strategies. When such programs are focused on reducing gang violence they typically include some combination of prevention, intervention, violence interruption and crime suppression approaches (Gravel, Bouchard, Descormiers, Wong, & Morselli, Citation2013; OJJDP, Citation2009). Comprehensive violence prevention programs that include all or most of these approaches, can be quite complex and entail significant challenges for evaluation of effectiveness (see Hipple, Saunders, Allison, & Peterson, Citation2020; Saunders, Robbins, & Ober, Citation2017; Tita & Papachristos, Citation2010). Here we examine the impact of the City of Los Angeles Mayor’s Office of Gang Reduction and Youth Development (GRYD) Comprehensive Strategy on reducing violence. Using the OJJDP Comprehensive Gang Model (OJJDP., Citation2009) as a roadmap, GRYD’s Comprehensive Strategy incorporates activities to engage the community, youth prevention programming to reduce the allure of gangs, direct service intervention programming to reduce gang embeddedness among young people involved in gangs, and collaborative violence interruption efforts aimed at stopping retaliations (Connie Rice, Lee, Meza, & Fraser, Citation2007; Tremblay, Herz, Zachery, & Kraus, Citation2020). Although the GRYD Office partners with law enforcement to intervene after a violent incident occurs, it does not oversee or participate in crime suppression activities, nor does it include a focused deterrence component in the GRYD Comprehensive Strategy (Braga et al., Citation2019). Rather, it operates in parallel with law enforcement responses to gang violence (i.e., suppression efforts) (Tremblay et al., Citation2020).
The collection of approaches employed by GRYD presents challenges for evaluating the overall impact on crime. We expect each approach to not only entail different effect sizes, but also that they tend to operate over different temporal and spatial scales. For example, we expect violence interruption to have a large, immediate impact on the occurrence of retaliations (P.J. Brantingham et al., Citation2020; Skogan, Hartnett, Bump, & Dubois, Citation2009). But we also expect the half-life of a single violence interruption intervention to be brief and the diffusion of benefits (or displacement of crime) to be over a limited geographic area. Conversely, gang prevention and intervention programming may not have a large, immediate impact on street crime but rather produce small effects that accumulate as the supply of youth to gangs is attenuated. Community engagement activities may produce intermediate effect sizes operating at intermediate temporal and spatial scales.
While these effects are plausible, they are difficult to disentangle in practice. In particular, assessing the long-term effects of community engagement activities as well as prevention and intervention services on crime is challenging (Gill, Weisburd, Telep, Vitter, & Bennett, Citation2014; David C Pyrooz, Citation2013). Here we exploit a unique feature of GRYD implementation to measure the combined effects of community engagement, prevention, intervention and violence interruption. Specifically, GRYD has a strict geographic criterion for service eligibility that cross-cuts all four approaches to gang violence prevention. At present, Los Angeles supports twenty-three GRYD Zones, operating in different areas of the city. Community engagement events occur strictly within active GRYD Zones. Individuals eligible for GRYD Prevention and Intervention Family Case Management services must reside or have a significant presence within an active GRYD Zone. Violence interruption resources are formally allocated only in response to gang-related violent crimes that occur strictly within GRYD Zones.Footnote1 The advantage of geographic eligibility is that we can compare outcomes in formally designated GRYD Zones with nearby geographic areas to estimate potential treatment effects.
We adopt a potential outcomes framework (Rubin, Citation2005) to assess the impact of the GRYD. Specifically, we follow the casual identification strategy developed by Ridgeway, Grogger, Moyer, and MacDonald (Citation2019) in their examination of the impact of gang injunctions on crime in Los Angeles (see also Grogger, Citation2002). We use this approach to evaluate changes in crime and disorder over a thirteen-year period (2005–2017) in areas where GRYD was deployed. We also evaluate whether GRYD led to the displacement of crime, or diffusion of crime control benefits to nearby areas (Bowers, Johnson, Guerette, Summers, & Poynton, Citation2011; P. L. Brantingham & Brantingham, Citation2003).
The remainder of this paper is structured as follows. The second section describes the GRYD Comprehensive Strategy. The third section introduces the data used in the analyses. The fourth section introduces a place-based difference-in-differences model that controls for fixed effects distinctive to GRYD Zones. This is followed by a presentation of results. The discussion section places the results in context, comparing their character and magnitude not only with other violence intervention programs, but also Ridgeway et al. (Citation2019) results on gang injunctions in Los Angeles. Because we use the same methodological approach applied to a different collection of units, the latter comparison is useful in contrasting the impact of a “suppression-only” strategy (gang injunctions) with the comprehensive violence prevention strategy followed by GRYD. Appendices provide details on the model identification and analysis of the full data panel as a sensitivity check.
The City of Los Angeles Mayor’s Office of Gang Reduction and Youth Development
The GRYD Office was established in the City of Los Angeles’ Mayor’s Office in 2007 shortly after the city’s involvement in the Office of Juvenile Justice and Delinquency Prevention Gang Reduction Model Demonstration Project between 2003 and 2007. As part of this project, a collaborative workgroup in East Los Angeles developed and piloted a comprehensive model to address gang violence based on the Office of Juvenile Justice and Delinquency Prevention (OJJDP) Gang Comprehensive Strategy (OJJDP., Citation2009; Spergel, Citation2007). The GRYD Comprehensive Strategy combines community engagement, gang prevention, gang intervention and violence interruption efforts and is delivered to areas of the city most impacted by gang violence. These areas, known as GRYD Zones, have high levels of gang violence combined with other measures of social disadvantage (e.g., high poverty rates). Implementation began in twelve GRYD Zones in 2009 and GRYD Comprehensive Strategy services were launched in late 2011 (see below). GRYD Zones have subsequently expanded to 23 areas across the city.
Community engagement activities supported by GRYD build upon the strengths (rather than deficits) of communities and to involve community members directly in efforts to promote peace and ensure social equity (Tremblay et al., Citation2020). For example, gun-buy-back events are organized as a collaboration between LAPD and GRYD with GRYD playing a major role in directing buy-back efforts to the communities with high propensity for gun violence. GRYD pop-up community events are staged strategically after significant violent events to help re-establish a sense of safety and connect victims and their families with relevant services. So-called “safe passage” programs are organized by GRYD providers in collaboration with communities to ensure the safety of children travelling to and from school. Most importantly, Community Education Campaigns are designed to make community members aware of services available through GRYD and connect community members to specific GRYD programming. A key piece of community engagement is to build trust so community members feel they can refer youth and young adults to GRYD Prevention and Intervention Family Case Management programming.
The GRYD Prevention Program is aimed at building skills and fostering positive alternatives to gangs for at-risk youth aged 10-15 (Tremblay et al., Citation2020). At-risk youth and their families receive services aimed at building resilience through developing critical life skills and problem-solving strategies. Service delivery is centered around six-month cycles of individual youth meetings, family meetings, and participation in intentional youth development activities (Duerden & Gillard, Citation2011). When appropriate, referrals are made to other services (e.g., mental health providers). The ultimate goal is to reduce the likelihood that at-risk youth will become involved in gangs.
The GRYD Intervention Family Case Management (FCM) Program is delivered to gang-involved youth and young adults aged 14-25. GRYD FCM services are designed to increase prosocial embeddedness and transfer attachments from gangs to positive activities. The ultimate goal is to accelerate the process through which individuals desist from gangs (David C. Pyrooz & Decker, Citation2011). The multi-phased program includes individual client meetings, client family meetings, connection to employment, and referrals to needed services (e.g., mentoring, counseling, tattoo removal, etc.).
The GRYD Incident Response (IR) Program is the cornerstone of the violence interruption component of the GRYD Comprehensive Strategy. It utilizes a “Triangle Partnership” comprised of GRYD Regional Program Coordinators (RPCs), Community Intervention Workers (CIWs–i.e., street outreach workers), the Los Angeles Police Department (LAPD) to coordinate and respond in the community in real-time after an incident of gang-related violence to reduce retaliations. GRYD RPCs are notified of violent incidents via alerts issued by the LAPD. GRYD RPCs then communicate information about these incidents to CIWs, who work in the community to control rumors and actively pursue peace. In addition to the GRYD IR Program, CIWs regularly engage the community through Proactive Peacemaking, which plays a critical role in reducing community tensions and preventing violence from occurring in the first place.
The GRYD Comprehensive Strategy is a community-based, public health approach. Although the GRYD Office and GRYD Intervention providers partner with the LAPD to engage the community in proactive ways to reduce violence, GRYD does not participate in suppression and deterrence efforts driven by law enforcement (Tremblay et al., Citation2020).
Prior evaluations have examined the overall impact of GRYD on gang-related crime. Dunworth et al. (Citation2011) compared aggregate crime trends in GRYD Zones with all other areas of the city using piecewise linear regression and informal comparison of slopes. They concluded that crime declined both in GRYD Zones and in other areas of the city. While crime declined more in some GRYD Zones, it was not possible to attribute this effect to the GRYD program. Dunworth et al. (Citation2013) expanded their approach to comparisons of GRYD Zones with different stratified areas within Los Angeles that received reduced or no GRYD services as well as areas outside of city but in Los Angeles County. They deployed piecewise regression, interrupted time series and difference-in-difference estimates to measure the impact of GRYD on gang-related crime. Their difference-in-differences model considered changes in the number of gang-related crimes over the years 2008-2011, comparing all GRYD Zones combined with a sample of areas from Los Angeles County. They defined the start of GRYD programming in 2010 and computed differences for one shorter and one longer time window. The shorter time window considered a one-year pre-implementation period (2009) and one-year post-implementation period (2010). the longer time window considered two-year pre- and post-implementation periods (2008-09 and 2010-11). They found greater crime declines in GRYD Zone RDs compared with non-GRYD RDs in the county. However, their analyses considered only two periods of time.
Brantingham, Sundback, Yuan, and Chan (Citation2017) used novel methods to examine the effects of violence interruption on gang-related retaliations (see also P. Jeffrey Brantingham et al., Citation2020). Using multivariate point-process models, they found that the GRYD IR Program cut gang-related retaliations by around 41%. Using similar models, Park et al. (n.d.) found that the GRYD IR Program reduced retaliations by around 21% after controlling for neighborhood covariates.
The current study examines the local geographic effect of implementing the GRYD Comprehensive Strategy programs over an intermediate time scale. Following Ridgeway et al. (Citation2019), we assess changes in serious crimes in areas receiving GRYD Comprehensive Strategy services, spatially adjacent displacement areas, and nearby control areas. The study builds on prior evaluations in several ways. First, the causal identification strategy introduced by Ridgeway and colleagues provides a more carefully considered set of controls for characterizing potential outcomes. Second, it quantifies uncertainty in estimates of treatment effects (see below). Third, it examines the impact on a wide array of serious crimes, rather than only gang-related violent crime. While gang-related violent crime is a particular target of GRYD Comprehensive Strategy services, we assess whether effects extend to non-violent crime types (e.g., burglary).Footnote2 Finally, the present study considers the impact of GRYD Comprehensive Strategy services as a whole on crime.
GRYD Zones and Crime Data
GRYD Comprehensive Strategy services are deployed geographically on a needs-basis, but with strict geographic criteria for eligibility. In general, GRYD Zones were established in those Los Angeles communities most impacted by gang-related violence. Initially, twelve GRYD Zones were established based on the volume of gang related crime (see Dunworth et al., Citation2013). Since initial deployment, GRYD Zones expanded to cover twenty-three areas by 2018 ().
Figure 1. Map showing active GRYD Zones (dark green) between July 2015 and July 2018.
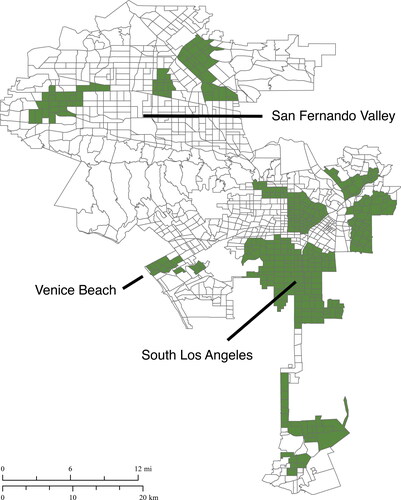
The geographic structure of GRYD Zones closely follows the structure of the Los Angeles Police Department (LAPD). The LAPD uses four levels of geographic organization. The City is divided into four LAPD Bureaus. Each Bureau consists of four or more Patrol Divisions. Patrol Divisions are partitioned into two or more Basic Car areas, patrolled by a primary patrol car with two officers. Basic Cars are then subdivided into Reporting Districts (RDs) that represent neighborhood-sized regions.
GRYD Zones are collections of multiple RDs. Importantly, GRYD Zones are larger than LAPD Basic Car areas, but smaller than Patrol Divisions. And, while GRYD Zone boundaries align with RD boundaries, they often cross basic car boundaries. They generally follow the cultural geography of gang-impacted communities (e.g., the Southeast II GRYD Zone approximately coincides with the Watts neighborhood). GRYD Zones do not cross LAPD Division boundaries. However, in some areas of the City, GRYD Zones abut one another, forming large, contiguous regions where GRYD services are available. For example, the Southwest I and II, Newton I and II, 77th I, II and II, and Southeast I and II GRYD Zones form a contiguous region of GRYD coverage in South Los Angeles (). As detailed below, our analyses are conducted at the scale of RDs.
The data used in this study are from two sources. GRYD maintains a database of all LAPD RDs that make up each GRYD Zone and tracks all geographic changes in GRYD Zones over time. This allows us to identify start and (if relevant) end times for each RD included in a GRYD Zone. GIS files for current RD locations are available from the Los Angeles GIS Open Data portal (https://geohub.lacity.org). LAPD reorganized Patrol Divisions in 2009, which included changes to RDs. GIS files for RDs prior to the 2009 reorganization were obtained from the LAPD. We standardized all data to the post-2009 geographic structure.
We analyze reported crimes occurring between Jan 1, 2005 and Dec 31, 2017. These data were provided by the LAPD with detailed information about crime type, date-time of occurrence and location of occurrence. Our analyses concentrate on violent crimes including homicide, aggravated assault (i.e., assault with a deadly weapon), and robbery, and property crimes including burglary, car theft (GTA) and burglary-theft from vehicle (BTFV). We also consider two aggregate measures of all violent crimes combined and all crime types combined. We do not distinguish between gang-related and non-gang crimes. Crime events are aggregated into quarterly counts for each RD.
Our analyses include only those RDs that eventually fall into a GRYD Zone, as well as the first- and second-order neighbors of these GRYD Zone RDs (see below). The analyses therefore consider 820 RDs out of a total of 1,135 RDs presently in use across Los Angeles.
Statistical Methods
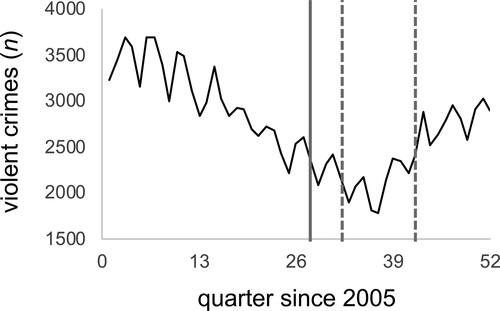
We are interested in assessing the impact of the GRYD Comprehensive Strategy programs beginning Q4 of 2011, towards the end of a two-decade crime decline in Los Angeles (). Although GRYD services were in place prior to 2011, there was little consistency or standardization across providers. In Fall 2011, new “model services” were introduced for GRYD Prevention, GRYD Intervention Family Case Management (FCM), and the GRYD Incident Response Program. GRYD Comprehensive Strategy services were thus implemented over a period of time that included both decreasing and increasing crime, which might obscure the real effects of the GRYD Comprehensive Strategy.
Figure 2. General violent crime trend across all study RDs. The figure shows the end of a decades-long crime decline, which in the first quarter of 2014. The solid vertical line marks the launch of GRYD model services in 2011 Q4. The dashed vertical lines mark periods of GRYD expansion in 2012 Q4 and 2015 Q3.
To estimate the short-term effects of GRYD Comprehensive Strategy services we work with three types of RDs. Our primary interest is in the RDs that comprise GRYD Zone, which we call treatment RDs. We also track changes in crime in RDs immediately adjacent to treatment RDs for potential displacement of crime or diffusion of benefits (Telep, Weisburd, Gill, Vitter, & Teichman, Citation2014). We call these displacement RDs. Second-order neighbors of treatment RDs are control units. These RDs are far enough away from treatment RDs to be largely immune from displacement effects, but close enough to be ecologically similar in terms of demographics, socio-economic conditions and the built environment.
As shown in , GRYD Comprehensive Strategy services were launched in 2011 Q4 and then underwent two periods of expansion in 2012 Q4 and 2015 Q3. As a result of these expansions, the post-treatment period started at different points in time for some RDs. For example, RDs 231 and 202 are both treatment units, but saw model services introduced at different times in 2011 Q4 and in 2015 Q3, respectively. We therefore align the data for each RD to the quarter in which treatment started (Ridgeway et al., Citation2019). We track changes in crime in these RDs for 9 quarters before and after the start of treatment.
The GRYD expansions in 2012 and 2015 also mean that some RDs changed status from control (second-order neighbor), to displacement (first-order neighbor), and some from displacement to treatment. For example, RD 101 started as a control unit in 2012 Q4, but then transitioned to a displacement unit in 2015 Q3. The analyses presented in the main body of this paper focus on those RDs that maintained a single treatment status for the entire observational window. For example, RD 109 became a displacement RD in 2011 Q4 and remained as such throughout the remainder of the observational period. The main analyses include 625 total RDs that underwent a single status change. Analyses allowing for changes in RD status produce substantially the same results (see Appendix 2).
shows the violent crime trends (number of events) in treatment (D), displacement (S) and control (C) RDs aligned to the start of treatment at t = 0. Values of correspond to pretreatment periods and
to post-treatment periods. The trends do not show an obvious interruption with the start of treatment. OLS regression slopes show that treatment RDs experienced a greater overall crime reduction of about 21 fewer violent crimes per quarter over the period of observation. Displacement and control RDs also experienced violent crime declines of 14 and 10 fewer violent crimes per quarter, respectively. These results indicate that we need to control for potential confounding through fixed differences between RDs and common temporal crime trends to detect any potential effects of GRYD Comprehensive Strategy services. reports summary statistics for the volume of crime per RD per quarter during the pre-treatment period (
Figure 3. Violent crime trends in combined treatment (circles, D), displacement (triangles, S) and control RDs (crosses, C) for nine quarters before the and after the onset of treatment. Treatment RDs show a greater decline in crime overall compared to displacement and control RDs.
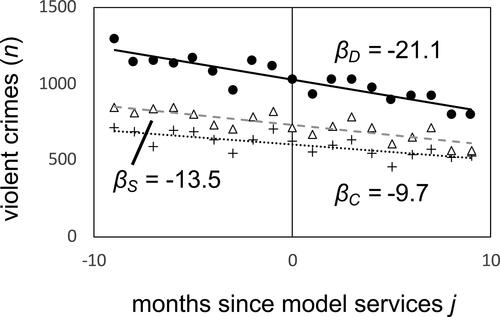
Table 1. Mean and standard deviation in the number of crimes per RD per Quarter during the pretreatment period.
We employ the fixed-effects regression model introduced by Ridgeway et al. (Citation2019) (see Appendix 1):
(1)
(1)
For and −9
where
is the number of crimes reported in RD exposed to treatment conditions i during quarter t, measured in relative time. The term and
is a dummy coded variable marking if RD d was ever exposed to GRYD Comprehensive Strategy services, while
is also a dummy coded variable marking if RD d was a first-order neighbor of an RD ever exposed to treatment. When
and
the corresponding RD was a second-order neighbor and is the control reference category in the regression. The term
is an indicator function that is zero for pre-treatment periods (i.e.,
) and is one for post-treatment periods (i.e.,
) for RD d. The primary difference
The two slope parameters and
capture the average treatment effect for treated units (
and average displacement effect for displacement units (
respectively. The term
is a vector of indicator, or dummy coded variables that maps relative time to calendar time. It is included to control for secular temporal trends that affect all RDs regardless of treatment status (see ). In the present case,
includes 52 separate indicators, one for each quarter from the start of 2005 to the end of 2017. For any given observation, the calendar quarter (e.g., Q4 2011) is marked with a 1, while all other indicators are marked with a 0 (e.g., Q1 2005, Q2 2005, etc.). Thus, we control for observed crime patterns that arise at the same calendar time, separate from their occurrence relative to the onset of treatment. The term
captures the fixed-effects (time-invariant characteristics) associated of RD d. Fixed effects can also be included dummy-coded indicators for each unique unit in a general linear model, though this is cumbersome for a large number of units—as in the present case. Finally,
is the uncorrelated error term. Further model identification details are provided in Appendix 1. Our analyses differ from those presented in Ridgway et al. (2019) in specific set of treatment, displacement and control RDs d and the relative times of treatment onset t, which implicate different fixed effects
and secular temporal trends
Fixed-effect regression models can overestimate treatment effects as a result of unequal variance in error terms and spatio-temporal autocorrelation in outcomes. We therefore compute heteroscedasticity-consistent and clustered standard errors alongside regular standard errors (see Moody & Marvell, Citation2020; Ridgeway et al., Citation2019; Stock & Watson, Citation2008). We cluster standard errors at three different geographic scales including, from small to large, LAPD Basic Car areas, Patrol Divisions and Bureaus. These different scales allow us to evaluate the tradeoff between clustering scale and number of clusters (Cameron & Miller, Citation2015).
Results
The results suggest that GRYD Comprehensive Strategy services generated significant reductions in violent crime, but no reduction for crime overall. There is no evidence for the displacement of crime to adjacent areas, nor the diffusion of potential benefits. presents the direct () and displacement (
) effects by crime type. Conventional standard errors are presented alongside heteroskedasticity robust (HC3) and clustered standard errors at three different geographic scales (LAPD Basic Cars, Divisions, and Bureaus). Starting with the summary measures, the
value for violent crime of −1.07 can be interpreted as one fewer crime per RD per quarter associated with GRYD Comprehensive Strategy services. The result is significant using the conventional standard error, the robust standard error, and clustered standard errors at LAPD Basic Car and Division geographic scales. It is non-significant when clustered at the LAPD Bureau geographic scale. The observed result for violent crime overall may be attributed equally to reductions in aggravated assaults (
= −0.56 crimes per RD per quarter) and robberies (
crimes per RD per quarter). Homicides appear to be unaffected by GRYD Comprehensive Strategy services.
Table 2. Estimated effects of GRYD model services.
By contrast, crimes overall experienced a very small decline in crime (=-0.41 crimes per RD per quarter). Conventional, robust and clustered standard errors all suggest that the reduction is non-significant. The result reflects the null effects for homicide, burglary and car theft (GTA), while the significant reductions in aggravated assaults and robberies are offset by a significant increase in burglary-theft from vehicle.
The results presented in are dependent upon the validity of the parallel trends assumption inherent to difference-in-differences models. That is, we expect that treatment (and displacement) RDs would have followed the same trajectory in reported crime as control RDs in the absence of treatment. We estimate and
by quarter for the pre- and post-treatment periods using (Ridgeway et al., Citation2019):
(2)
(2)
The first and second terms on the right-hand side of EquationEquation (8)(8)
(8) capture the effects of relative time. The second and third terms capture the pre- and post-treatment effects (
) in treatment RDs for each quarter j. That is, there are separate estimates of the treatment effect for the −9, −8,…,-2 quarters before the start of treatment and for the 0, 1,…, 8, 9 quarters after the onset of treatment. The quarter immediately before treatment (j = −1) is held out as the reference period (see Ridgeway et al., Citation2019). The fourth and fifth terms capture the pre- and post-treatment effects (
) in displacement RDs for each quarter j. The final three terms are the same as in EquationEquation (7)
(7)
(7) . If the parallel trends assumption holds, then we expect both
and
to be not significantly different from zero in the pre-treatment period. The intuition is that treatment and displacement RDs should behave similarly to control RDs because we know that there is not treatment at this time. If
or
differ significantly from zero it suggests that treatment and displacement RDs do not follow parallel trends with control RDs. Indeed, non-parallel trends were seen in the naive linear model shown in .
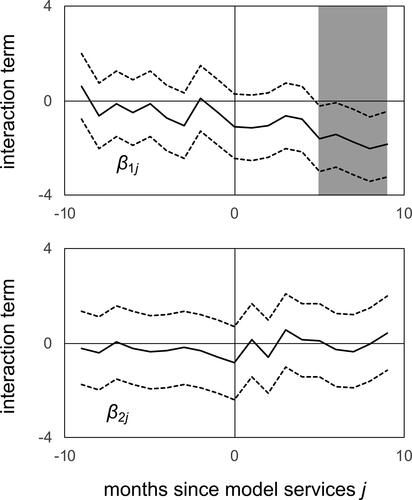
suggests that the parallel trends assumption is plausible in the current case. Shown are the estimates +/− standard errors for and
for each quarter during the pre- and post-treatment periods. The estimates for
are not significantly different from zero in the pre-treatment period and attain significance after six quarters post-treatment. This latter result suggests that the effects of GRYD Comprehensive Strategy services take some time to set in (see Discussion). The estimates for
are not significantly different from zero over the entire window of observation. Displacement RDs therefore also appear consistent with the parallel trends assumption.
Figure 4. Test of parallel trends assumption by quarter. Coefficient for treatment units (?1j) by quarter j since the onset of treatment. Coefficient for displacement units (?2j) by quarter j. The expectation is that ?1j and ?2j will be indistinguishable from zero before the onset of treatment (j = 0). The region of significance for ?1j is shown in gray.
Discussion
The difference-in-differences analyses presented above suggest that the introduction of GRYD Comprehensive Strategy services in gang-impacted communities in Los Angeles led to a reduction in violent crime, but not property crimes. The violent crimes most impacted were aggravated assault and robbery. Homicide was not impacted. Property crimes including burglary and car theft (GTA) were also not impacted, and burglary-theft from vehicle appears to have increased.
The apparent impact of GRYD Comprehensive Strategy services on violent crime makes sense given the evidence that gangs are responsible for an outsized share of violent crime (P. Jeffrey Brantingham et al., Citation2020; Cloward & Ohlin, Citation1960; Decker, Melde, & Pyrooz, Citation2013). The GRYD Comprehensive Strategy simultaneously supports the delivery of prevention, intervention and violence reduction services to reduce violent crime, and each of these areas may have differing impacts on gang-related crime. A reduction in violent crime in GRYD treatment RDs, for example, may be most directly connected to the “violence interruption” efforts of the GRYD Triangle Partnership teams (Tremblay et al., Citation2020) because their efforts are intended to have an immediate effect in preventing retaliations following instances of gang violence occurring within GRYD Zones.
GRYD Intervention Family Case Management (FCM) services may also be expected to have a relatively fast effect following the onset of participation. GRYD FCM seeks to increase positive social engagement (at home, at work, and in the community) and decrease the hold of gangs on individuals who are already involved in gangs (Tremblay et al., Citation2020). While improving conditions for the individual, GRYD FCM also hopes to impact decision-making processes, altering the choices those individuals make when confronted with an opportunity for violence. If GRYD FCM is able to drive changes in decision-making quickly, then violent crime might also be expected to decrease quickly with the introduction of model services.
By contrast, GRYD Prevention hopes to decrease the likelihood that youth will join gangs in the first place (Tremblay et al., Citation2020). We might expect declines in general delinquency associated with GRYD Prevention but also a likely reduction in violence to the extent that youth avoid gang life. However, this effect, if significant, would be likely to appear over a much longer time horizon compared to GRYD Intervention Family Case Management and the GRYD Incident Response Program. Indeed, if involvement in violent crime peaks around the age of 18, then the positive effects of GRYD Prevention on crime might not be seen several years after treatment for individuals ends. GRYD Prevention is typically open to at-risk youth ages 10-14.
GRYD is concerned with delinquency in general as a gateway to gang involvement and violent crime (Tremblay et al., Citation2020). However, we find no evidence that GRYD Comprehensive Strategy services translate into lower property crime rates. However, we also do not know who is committing any of these crimes. It is possible that individuals not exposed to GRYD step in to take advantage of opportunities freed up by desistance among GRYD youth. The increase in burglary-theft from vehicle is difficult to explain. This effect is significant at conventional levels but disappears with the use of robust and clustered standard errors. Perhaps GRYD Prevention, FCM and IR Programs are successful in changing some of the dynamics surrounding violence, but generally do not change baseline behavioral routines (e.g., copious unstructured time) that facilitate crimes such as burglary-theft from vehicle.
One advantage of using the analytical approach developed by Ridgeway et al. (Citation2019) is that we can compare the effect magnitudes with their study of gang injunctions in Los Angeles. Ridgeway et al. (Citation2019, p. ) observed about 2.05 fewer crimes overall per quarter per gang injuncted RD compared with control RDs. They found about a significant reduction in aggravated assaults (), but non-significant decreases in robberies (
) and homicides (
) in gang injuncted RDs. In comparison, the effect size for GRYD Comprehensive Strategy services on violent crime combined (ATT_D = −1.07) is about 66% of the combined total for homicides, robberies and aggravated assaults reported in Ridgway et al. (2019, p. ). The effect size for assaults alone is about 37% as large as observed with gang injunctions. However, the GRYD Comprehensive Strategy services effect size is about 80% larger for robberies compared with gang injunctions. That GRYD Comprehensive Strategy services appear to have significant impacts even though their primary focus is not crime suppression is remarkable. However, more work will be needed to explain the differences in effects across aggravated assault and robbery compared with gang injunctions. As in the present case, Ridgeway et al. (Citation2019, p. ) do not find evidence for diffusion of benefits or displacement of crime (
) associated with gang injunctions.
Our results also raise an important point about effect sizes. At first glance, the estimated reductions on crime appear rather inconsequential. Seeing that GRYD resulted in a reduction of approximately one violent crime per RD per quarter might induce skepticism on the cost effectiveness of an intense, service-oriented program. However, when on extrapolated across the geographic enormity of a place like Los Angeles, the total reduction in crime is impactful. In the present case, there were 120 RDs that received treatment with GRYD Comprehensive Strategy services. Over the ten quarters of post treatment observation the −1.07 violent crimes per RD per quarter adds up to a crime reduction of 1,284 violent crimes associated with GRYD Comprehensive Strategy services. Individually, this corresponds to 678 fewer aggravated assaults and 618 fewer robberies. Compared with the mean volume of crime during the pretreatment period (see ), violent crimes were approximately 18% lower in treatment RDs after the onset of GRYD Comprehensive Strategy services, which includes a 20% reduction in aggravated assault and 17% reduction in robberies. Over time, we might expect crime reductions to compound as GRYD Prevention and FCM services choke off the supply of youth to gangs. Injunctions, which primarily regulate the ability of gang members to gather, may have a greater immediate effect that wanes quickly when removed. These results should therefore offer encouragement for other cities to consider a comprehensive approach in addressing gang violence problems.
There are several important limitations to the present work. While we were able to exploit the geographic structure of GRYD to detect average treatment effects, we are not able to disambiguate mechanisms. The relative contribution of community engagement, prevention and intervention programs, and violence interruption to the observed crime patterns are not known. Our analyses seem consistent with an accumulation of effects over the medium term. Specifically, the observed per quarter effect sizes are not significantly different from zero until around six quarters (1.25 years) after the onset of model services in an RD (). This may rule out attributing the effect solely to violence interruption efforts, which we expect to appear almost immediately. It also may rule out attributing the effect only to GRYD Prevention, which we expect to appear on the order of 3-5 years as prevention youth age into the peak period of delinquency risk. Future work may be able to include covariates that measure the intensity of different GRYD efforts thus providing guidance on relative effects.
It is also important to consider the interaction between GRYD and other active crime prevention programs. For example, at least some of the areas covered by GRYD services were also subject to gang injunctions (Ridgeway et al., Citation2019), while other areas were the focus of LAPD’s Community Safety Partnership (CSP) program (Kahmann et al., Citation2020; Constance Rice & Lee, Citation2015). The impact of such potential interactions is presently unknown.
We also do not disaggregate crimes based on their classification as gang-related or non-gang. This is a potentially important distinction both because the dynamics of gang-related crimes may be very different from non-gang crimes (P. Jeffrey Brantingham et al., Citation2020), but also because one of GRYD’s central aims is to reduce gang-related violence. It is plausible that GRYD has an even larger proportional effect on gang-related crimes. However, this is not yet established. This is a criticism of evaluations of suppression focused interventions such as “focused deterrence/pulling levers.” While evaluations often demonstrate meaningful crime reductions for such programs, the outcome measure is based upon changing levels of violence and not the changing behaviors of those individuals at the center of the intervention/suppression measures (Gravel & Tita, Citation2015). As in Ridgeway et al. (Citation2019), we have chosen to consider the potential effects for crime in general. Classification of gang-related crimes remains a challenging task (see P. Jeffrey Brantingham et al., Citation2020; Rosenfeld, Bray, & Egley, Citation1999). Because gang-related crimes make up only a fraction of all reported crime, future statistical analyses will need to contend with very sparse counts.
Conclusions
In spite of the limitations noted above, our results suggest that comprehensive gang violence prevention programs can have a significant impact on crime. The GRYD Comprehensive Strategy includes elements in common with violence prevention programs implemented elsewhere including Cure Violence (Butts, Roman, Bostwick, & Porter, Citation2015), the Comprehensive Anti-Gang Initiative (CAGI) (McGarrell et al., Citation2013), and the Los Angeles Gang Reduction Program (LA GRP) (Cahill et al., Citation2008), a direct precursor of GRYD. The GRYD Comprehensive Strategy is notable, however, in two ways. First, eligibility for both prevention and intervention services as well as the activities of the GRYD Community Intervention Workers (i.e., CIWs; street outreach workers) is based on strict geographic criteria, thus enabling a creation of comparison groups that are often less precise in other programs. This has advantages for the oversight of service providers and ensuring model fidelity, which are significant challenges for other comprehensive gang violence prevention programs (see Butts et al., Citation2015), and for identifying appropriate comparison units and measuring effectiveness. Second, the GRYD Comprehensive Strategy operates outside the purview of law enforcement. In the current politically charged atmosphere where the actions of local law enforcement are being highly scrutinized, GRYD offers an alternative to other gang violence reduction strategies that rely on suppression activities.
The advantages of a comprehensive approach are particularly salient when considering the importance of long-term strategies to sustain decreases in violent crime over time. While suppression efforts are arguably useful in the short-term, they are more limited in sustaining decreases over time. An investment in comprehensive strategies that braid short-term (violence interruption), intermediate (gang intervention), and long-term strategies (community engagement and gang prevention) not only help to sustain immediate decreases in violence but offer the opportunity to generate a predictable and cumulative effect over time. Achieving on-going, sustainable decreases in violent crime is not only consistent with the goal of public safety generally, but importantly, it achieves public safety using programming that is community-based and driven by goals of social equity and justice.
Disclosure statement
No potential conflict of interest was reported by the author(s).
Table A1. Effects for the full model.
Notes
1 Model fidelity is an important issue in violence prevention programs (Hipple et al., Citation2020). There are likely to be some exceptions to the strict operation of geographic criteria. For example, public events cannot exclude individuals who reside outside of an active GRYD Zone. Such violations involve greater inclusion rather than model slippage.
2 We hypothesize that prevention and intervention services that steer youth away from gang-related violence may also steer them away from non-gang crime opportunities as well. Similarly, community engagement and proactive peacemaking may encourage greater guardianship that positively impacts property crime rates.
References
- Bowers, K. J., Johnson, S. D., Guerette, R. T., Summers, L., & Poynton, S. (2011). Spatial displacement and diffusion of benefits among geographically focused policing initiatives: A meta-analytical review. Journal of Experimental Criminology, 7(4), 347–374. doi:https://doi.org/10.1007/s11292-011-9134-8
- Braga, A. A., Zimmerman, G., Barao, L., Farrell, C., Brunson, R. K., & Papachristos, A. V. (2019). Street gangs, gun violence, and focused deterrence: Comparing place-based and group-based evaluation methods to estimate direct and spillover deterrent effects. Journal of Research in Crime and Delinquency, 56(4), 524–562. doi:https://doi.org/10.1177/0022427818821716
- Brantingham, P. J., Sundback, N., Yuan, B., & Chan, K. (2017). GRYD Intervention Incident Response & Gang Crime: 2017 Evaluation Report. Los Angeles: Los Angeles Mayor's Office of Gang Reduction and Youth Development.
- Brantingham, P. L., & Brantingham, P. J. (Eds.). (2003). Crime prevention and the problem of crime displacement: Estimating quantum of displacement using a cohort component approach. Weisser Ring: Gemeinnützige Verlags-GmbH.
- Brantingham, P. J., Yuan, B., & Herz, D. (2020). Is gang violent crime more contagious than non-gang violent crime? Journal of Quantitative Criminology, in press. doi:https://doi.org/10.1007/s10940-020-09479-1
- Brantingham, P. J., Yuan, B., & Herz, D. C. (2020). The impact of the GRYD incident response program on gang retaliations. In D. C. Herz & M. Kraus (Eds.), GRYD Research & Evaluation Briefs (Vol. No. 2). Los Angeles: The City of Los Angeles Mayor’s Office of Gang Reduction and Youth Development (GRYD).
- Butts, J. A., Roman, C. G., Bostwick, L., & Porter, J. R. (2015). Cure violence: A public health model to reduce gun violence. Annual Review of Public Health, 36, 39–53. doi:https://doi.org/10.1146/annurev-publhealth-031914-122509
- Cahill, M., Coggeshall, M. D. H., Wolff, A., Lagerson, E., Scott, M., Davies, E., … Decker, S. (2008). Community collaboratives addressing youth gangs: Interim findings from the gang reduction program. Washington, D.C.: Urban Institute Justice Policy Center.
- Cameron, A. C., & Miller, D. L. (2015). A practitioner’s guide to cluster-robust inference. Journal of Human Resources, 50(2), 317–372. doi:https://doi.org/10.3368/jhr.50.2.317
- Cloward, R. A., & Ohlin, L. (1960). Delinquency and Opportunity: A Theory of Delinquent Gangs. Glencoe, IL: Free Press.
- Decker, S. H., Melde, C., & Pyrooz, D. C. (2013). What do we know about gangs and gang members and where do we go from here? Justice Quarterly, 30(3), 369–402. doi:https://doi.org/10.1080/07418825.2012.732101
- Duerden, M. D., & Gillard, A. (2011). An approach to theory-based youth programming. New Directions for Youth Development, 2011(S1), 39–53. doi:https://doi.org/10.1002/yd.418
- Dunworth, T., Hayeslip, D., & Denver, M. (2011). Y2 Final Report: Evaluation of the Los Angeles Gang Reduction and Youth Development Program. Washington, DC: Urban Institute, Harder Company.
- Dunworth, T., Hayeslip, D., Lowry, S., Kim, K., Kotonias, C., & Pacifici, L. (2013). Evaluation of the Los Angeles Gang Reduction and Youth Development Program Year 3 Final Report. Washington, D.C.: The Urban Institute, Harder Company.
- Gill, C., Weisburd, D., Telep, C. W., Vitter, Z., & Bennett, T. (2014). Community-oriented policing to reduce crime, disorder and fear and increase satisfaction and legitimacy among citizens: A systematic review. Journal of Experimental Criminology, 10(4), 399–428. doi:https://doi.org/10.1007/s11292-014-9210-y
- Gravel, J., & Tita, G. E. (2015). With great methods come great responsibilities. Criminology & Public Policy, 14(3), 559–572. doi:https://doi.org/10.1111/1745-9133.12147
- Gravel, J., Bouchard, M., Descormiers, K., Wong, J. S., & Morselli, C. (2013). Keeping promises: A systematic review and a new classification of gang control strategies. Journal of Criminal Justice, 41(4), 228–242. doi:https://doi.org/10.1016/j.jcrimjus.2013.05.005
- Grogger, J. (2002). The effects of civil gang injunctions on reported violent crime: Evidence from Los Angeles County. The Journal of Law and Economics, 45(1), 69–90. <Go to ISI>://000176668200003 doi:https://doi.org/10.1086/338348
- Hipple, N. K., Saunders, J., Allison, K., & Peterson, J. (2020). What does success look like? Lessons from the innovations in Community-Based Crime Reduction (CBCR) Program. Justice Evaluation Journal, 3(2), 227–244. doi:https://doi.org/10.1080/24751979.2020.1748519
- Kahmann, S., Hartman, E., Leap, J., & Brantingham, P. J. (2020). Impact Evaluation of the LAPD community safety partnership. submitted.
- McGarrell, E. F., Corsaro, N., Melde, C., Hipple, N. K., Bynum, T., & Cobbina, J. (2013). Attempting to reduce firearms violence through a comprehensive anti-gang initiative (CAGI): An evaluation of process and impact. Journal of Criminal Justice, 41(1), 33–43. doi:https://doi.org/10.1016/j.jcrimjus.2012.11.001
- Moody, C. E., & Marvell, T. B. (2020). Clustering and standard error bias in fixed effects panel data regressions. Journal of Quantitative Criminology, 36(2), 347–369. doi:https://doi.org/10.1007/s10940-018-9383-z
- OJJDP. (2009). OJJDP Comprehensive Gang Model: Planning for implementation. Washington, D.C.: Institute for Intergovernmental Research, U.S. Department of Justice.
- Park, J., Schoenberg, F. P., Bertozzi, A. L., & Brantingham, P. J. (2021). Investigating clustering and violence interruption in gang-related violent crime data using spatial-temporal point processes with covariates. submitted.
- Pyrooz, D. C. (2013). Gangs, criminal offending, and an inconvenient truth: Considerations for gang prevention and intervention in the lives of youth. Criminology & Public Policy, 12(3), 427–436. doi:https://doi.org/10.1111/1745-9133.12053
- Pyrooz, D. C., & Decker, S. H. (2011). Motives and methods for leaving the gang: Understanding the process of gang desistance. Journal of Criminal Justice, 39(5), 417–425. doi:https://doi.org/10.1016/j.jcrimjus.2011.07.001
- Rice, C., & Lee, S. K. (2015). Relationship-based policing achieving safety in Watts. Washington, DC: Advancement Project.
- Rice, C., Lee, S., Meza, M., & Fraser, C. (2007). A call to action: Los Angeles’ quest to achieve community safety. Advancement Project. www.advancementproject.org.
- Ridgeway, G., Grogger, J., Moyer, R. A., & MacDonald, J. M. (2019). Effect of Gang Injunctions on Crime: A Study of Los Angeles from 1988–2014. Journal of Quantitative Criminology, 35(3), 517–541. doi:https://doi.org/10.1007/s10940-018-9396-7
- Rosenfeld, R., Bray, T. M., & Egley, A. (1999). Facilitating violence: A comparison of gang-motivated, gang-affiliated, and Nongang youth homicides. Journal of Quantitative Criminology, 15(4), 495–516. doi:https://doi.org/10.1023/A:1007548309620
- Rubin, D. B. (2005). Causal inference using potential outcomes: Design, modeling, decisions. Journal of the American Statistical Association, 100(469), 322–331. doi:https://doi.org/10.1198/016214504000001880
- Saunders, J., Robbins, M., & Ober, A. J. (2017). Moving from efficacy to effectiveness. Criminology & Public Policy, 16(3), 787–814. doi:https://doi.org/10.1111/1745-9133.12316
- Skogan, W. G., Hartnett, S. M., Bump, N., & Dubois, J. (2009). Evaluation of ceasefire-Chicago. Washington, D.C.: U.S. Department of Justice, Office of Justice Programs.
- Spergel, I. A. (2007). Reducing youth gang violence: The little village gang project in Chicago. New York: Rowman Altamira.
- Stock, J. H., & Watson, M. W. (2008). Heteroskedasticity‐robust standard errors for fixed effects panel data regression. Econometrica, 76(1), 155–174. doi:https://doi.org/10.1111/j.0012-9682.2008.00821.x
- Telep, C., Weisburd, D., Gill, C., Vitter, Z., & Teichman, D. (2014). Displacement of crime and diffusion of crime control benefits in large-scale geographic areas: A systematic review. Journal of Experimental Criminology, 10(4), 515–548. doi:https://doi.org/10.1007/s11292-014-9208-5
- Tita, G. E., & Papachristos, A. (2010). The evolution of gang policy: Balancing intervention and suppression. In R. J. Chaskin (Ed.), Youth gangs and community intervention (pp. 24–48). New York: Columbia University Press.
- Tremblay, A., Herz, D., Zachery, R., & Kraus, M. (2020). The Los Angeles Mayor’s Office of gang reduction and youth development comprehensive strategy. GRYD Research Brief, 1:1–12.
- Wing, C., Simon, K., & Bello-Gomez, R. A. (2018). Designing difference in difference studies: Best practices for public health policy research. Annual Review of Public Health, 39(1), 453–469. doi:https://doi.org/10.1146/annurev-publhealth-040617-013507
Appendix 1. Identification
To facilitate comparison across evaluations, we adopt the notation used by Ridgeway et al. (Citation2019). We seek to estimate the average treatment effect on the treated (ATT) for both treatment RDs (D), which are in GRYD Zones receiving model services, and for displacement RDs (S), which are first-order neighbors of treatment RDs. Second-order neighboring RDs serve as controls (C). Let if model services i were deployed in RD d at any point in time during the period of observation. Let
if RD d was a first-neighbor of an RD that received treatment at any point in time. For ease of reference, let
if RD d was a second-order neighbor of an RD that received treatment at any point in time. We focus on only those RDs that underwent a single change in status over time. Thus, if
then both
and
for all times t. If
then
and
for all times t. If
then
and
for all times t. In general, two adjacent treatment RDs are also one another’s displacement RDs. However, we do not allow RDs to have more than one status at a time. We prioritize D over S and S over C. Thus, while an RD may be a second- and/or first-order neighbor of a treatment RD, if it is itself a treatment RD, then it is flagged only as
Potential outcomes are defined based on treatment status for a unit d (Ridgeway et al., Citation2019). Let be the potential outcomes for treatment i in RD d at relative time t, with D and S as the indicator variables described above. Thus,
is the potential outcome if RD d was exposed to GRYD Comprehensive Strategy services. Then,
is the potential outcome if RD d was a displacement unit neighboring an RD exposed to GRYD Comprehensive Strategy services.
is the potential outcome if RD d was a control unit, or second-order neighbor of an RD exposed to model services. The quantities of interest following the introduction of treatment are as follows:
(3)
(3)
(4)
(4)
The key challenge is that we can observe only the first term on the right-hand side in EquationEquations (3)(3)
(3) and Equation(4)
(4)
(4) . These are the mean crime per quarter in the presence of treatment in treatment (D) and displacement (S) RDs. The second term in each equation is the mean crime per quarter in the absence of treatment for treatment and displacement RDs. These latter potential outcomes describe what would have happened if unit d (or a first-order neighbor of d) were not exposed to treatment.
Difference-in-differences estimators allow us to model the relationship between potential outcomes using a parallel trends assumption. Let be the relative time at which treatment starts in RD d. Thus, values of
correspond to the post-treatment period, while values of
correspond to the pre-treatment period. Ridgeway et al. (Citation2019) then define
(5)
(5)
(6)
(6)
The first two terms in EquationEquation 5(5)
(5) subtracts the mean pre-treatment crime from the mean post-treatment crime in treatment RDs (i.e.,
), which seeks to control for the fixed characteristics of treatment units. The second two terms do the same for control units. The pre-post difference in control units is then subtracted from the pre-post difference in treatment units, which seeks to control for the common temporal trends across all units. The same mechanics are used for displacement units in EquationEquation 6
(6)
(6) .
Difference-in-differences estimators work under the assumption that the difference in mean outcomes between treatment and control units would be constant in the absence of treatment (see Wing, Simon, & Bello-Gomez, Citation2018). Thus, if there is a common secular trend in crime volume over time, then treatment and control units would have changed in parallel in the absence of treatment. Ridgeway et al. provide the following formalization:
(7)
(7)
(8)
(8)
The first term in EquationEquations 7(7)
(7) and Equation8
(8)
(8) are unobserved for
(i.e., the counterfactual potential outcome), but are observable for
We therefore evaluate whether the parallel trends assumption holds in the pre-treatment period and whether it is violated in the post-treatment period, which we expected to be the case if there is a treatment effect. Equation (2) in the main text provides a regression formulation of the parallel trends test.
Appendix 2. Full Model
The full model produces results that are substantively similar to the reduced model. Here we include all 52 Quarters from Jan 1, 2005 to Dec 31, 2017 in the analysis and RDs with one or more transition in treatment status. For example, here we also consider an RD that transitions from pre-deployment control (C) unit to a displacement (S) unit and then to a treatment (D). There are 820 RDs in the full model, of which 625 RDs experience only a single treatment status and 195 experience more than one treatment status over the period of observation. We use the model in EquationEquation (7)(7)
(7) , controlling for the calendar time and fixed effects across all RDs. The estimated
and
are shown in along with conventional, robust and clustered standard errors.
The model including all 52 quarters between 2005 through 2017 and all units presents substantively similar results to the reduced short-term model. Homicides show a small, but significant decline across all computed standard errors for treatment RDs. The effect sizes in treatment RDs for aggravated assault, robbery and combined violent crime are smaller in the full model, while the qualitative pattern in standard errors remains similar. Burglary and car theft (GTA) shows reductions in treatment RDs that are significant across all computed standard errors. Burglary-theft from vehicle (BTFV) records an increase that is significant across all methods for computing standard errors.
The full model suggests that there may be both the diffusion of benefits and displacement of crime depending upon crime types. The estimated is negative for aggravated assault, robbery, and violent crimes combined. The volume of crime per quarter is lower in RDs adjacent to RDs with GRYD Comprehensive Strategy services compared with controls. The same is true for car theft (GTA) and crimes overall. However, burglary and burglary-theft from vehicle (BTFV) both record positive
suggesting that crime is potentially displaced to adjacent RDs. As in the reduced model presented in the main paper, the case of burglary-theft from vehicle is difficult to explain. The volume of burglary-theft from vehicle is not only higher in treatment RDs compared to control, but also higher in displacement RDs.