
ABSTRACT
In this paper, we consider the statistical analysis for the dependent competing risks model in the constant stress accelerated life testing with Type-II progressive censoring. It is focused on two competing risks from Lomax distribution. The maximum likelihood estimators of the unknown parameters, the acceleration coefficients and the reliability of unit are obtained by using the Bivariate Pareto Copula function and the measure of dependence known as Kendall's tau. In addition, the 95% confidence intervals as well as the coverage percentages are obtained by using Bootstrap-p and Bootstrap-t method. Then, a simulation study is carried out by the Monte Carlo method for different measures of Kendall's tau and different testing schemes. Finally, a real competing risks data is analysed for illustrative purposes. The results indicate that using copula function to deal with the dependent competing risks problems is effective and feasible.
1. Introduction
In reliability life testing, it is quite common that various competing failure causes may be present at the same time. This problem is known as the competing risks/failure model, which involves multiple failure modes, while only the smallest failure time and the associated failure mode are observed. In practice, competing risks data appears in engineering, biological, social science, medical statistics and other fields; see Beyersmann, Schumacher, and Allignol (Citation2012). Recently years, the statistical inference of competing risks model has been widely studied. Sarhan, Hamilton, and Smith (Citation2010) considered the statistical inference for the unknown parameters in the competing risks models. Mazucheli and Achcar (Citation2011) applied the Lindley distribution to competing risks lifetime data. Wu and Shi (Citation2016) discussed the Bayes estimation for the competing risks model under progressively hybrid censoring with binomial removals. Xu and Zhou (Citation2017) considered the Bayesian analysis of series system whose failure time is assumed to follow a Marshall–Olkin bivariate Weibull distribution. In accelerated life testing (ALT), Balakrishnan and Han (Citation2008), Han and Balakrishnan (Citation2010) combined simple step-stress ALT and competing risks model. The inference for a simple step-stress model with progressively censored competing risks data from Weibull distribution was considered by Liu and Shi (Citation2017).
It can be seen that previous studies have usually considered the causes of failure to be independent, even when the interpretation of the causes implies dependency. Naturally, once independence between risks has been established, it is reasonable to consider a univariate distribution for the lifetimes. However, in fact, the competing risk modes are usually dependent. Thus, the univariate distribution model is not applicable yet. The copula function provides a means to examine the dependence structure between multiple random variables, so it attracts more and more attentions from scientists and technicians engaged in the study of reliability. Muliere and Scarsini (Citation1987) discussed some characterisations of a class of Marshall–Olkin type distributions and introduced the copula of the bivariate distributions functions. Yi and Wei (Citation2007) studied on the reliability of dependent parts vote unit based on copula functions. The reliability of k-out-of-n:G supply chain unit and dependent failure units based on copula were discussed by Jia and colleagues (Jia & Cui, Citation2012; Jia, Wang, & Wei, Citation2014). Dimitrova, Haberman, and Kaishev (Citation2013) expressed the dependence of lifetimes using multivariate copula function and studied the dependent competing risks model of human mortality. Many papers about copulas can be referred, such as Aristidis (Citation2013), Cheng, Zhou, Chen, and Zhuang (Citation2014), Grothe and Hofert (Citation2015) and so on.
Recently, the copula theory has become a hot topic in ALT to research the characters of products with dependent competing risks model, but related literatures are very few. Xu and Tang (Citation2012) researched the statistical analysis of competing failure modes in ALT base on copulas. The statistical inference of ALT with dependent competing failures based on copula theory can refer to Zhang, Shang, Chen, Zhang, and Wang (Citation2014). Wu, Shi, and Zhang (Citation2017) discussed the statistical analysis of dependent competing risks model in ALT using copula function based on progressively hybrid censored data. Although some papers have discussed the statistical inference for estimating parameters from different lifetime distributions based on dependent competing risks model, the dependent competing risks model about Pareto type distribution in ALT has not been considered yet.
The Pareto type distribution was proposed by Pareto (Citation1987), which was used to model the unequal distribution of personal income and wealth. Many scholars have discussed the applications of Pareto type distribution in reliability. Sarhan and El-Gohary (Citation2003) developed the maximum likelihood and Bayes estimators for the parameters in Pareto reliability model with masked data. The latest papers can refer to Bourguignon, Saulo, and Fernandez (Citation2016), Dixit and Nooghabi (Citation2010), Fernández (Citation2014) and so on. There is a hierarchy of Pareto distributions known as Pareto Type I, II, III and IV, where the Lomax distribution is a special case of Pareto Type II distribution and its support begins at zero. The Lomax distribution has a long heavy tail and a wide application in economics, business, insurance, reliability, engineering, finance and related fields. The Lomax distribution has been studied by many scholars, such as Cramer and Schmiedt (Citation2011), Helu, Samawi, and Raqab (Citation2015), Yang, Wei, and Fan (Citation2014), etc.
Considering the above-mentioned papers, in this paper, we analyse the lifetime data with dependent competing risks model in CSALT under Type-II progressive censoring based on copula theory. The failure time of the unit due to one of the failure modes follows to a Lomax distribution. The joint distribution function is expressed by marginal functions and Bivariate Pareto Copula. The rest of this paper is organised as follows. In Section 2, the copula theory and their characters are introduced. The dependent competing risks model under CSALT Type-II censoring is constructed, and the basic assumptions and the maximum likelihood estimators (MLEs) of the model parameters are presented in Section 3. Bootstrap-p and Bootstrap-t methods are used to construct the confidence intervals (CIs) for model parameters in Section 4. We carry out several numerical simulations for illustrative purposes in Section 5. An analysis about competing risks data using the proposed model is shown in Section 6. Some conclusions appear in Section 7.
2. Copula theory
2.1. Bivariate copula function
Theorem 2.1
(Sklar's theorem) (Nelsen, Citation2006): Let H be a joint distribution function with marginal functions F and G. Then there exists a copula function C such that for all x, y in ,
(2.1)
If F and G are continuous, then C is unique; otherwise, C is unique on RanF × RanG, where RanF(x) is the domain of function F(x). Conversely, if C is a copula, F and G are distribution functions, then the function H defined by Equation (Equation2.1(2.1) ) is a joint distribution with marginal functions F and G.
Let
C(u, v) be a bivariate copula for u, v in , if
replace C, u, v, the function
is called survival copula and meets the following formulas:
(2.2)
Let be the joint survival function of C, then we have
(2.3)
More properties about copula please refer to Balakrishnan and Lai (Citation2009) and Nelsen (Citation2006).
2.2. Archimedean copula
In some situations, there is a function ϕ satisfiesthen the copula function with the above expression is called Archimedean copula. To solve C, we need to find an appropriately defined ‘inverse’ function ϕ[ − 1], such that
If ϕ(t) = t− 1/θ − 1, θ ⩾ 1, then(2.4) EquationEquation (2.4)
(2.4) is called Bivariate Pareto Copula (BPC).
2.3. Measure of association
There are many kinds of copulas, and different copulas have different parameters; hence, these copulas are not comparable. In order to compare them, the Kendall's tau can be considered. In the meaning of copula, Kendall's tau can be written as follows:(2.5)
If C is an Archimedean copula, then Equation (Equation2.5(2.5) ) is rewritten as
(2.6)
Thus, the Kendall's tau of BPC is τ = 1/(2θ + 1).
To illustrate the dependent relationship of BPC, the scatter plots of BPC with different Kendall's tau are shown in . From , we conclude that the dependency becomes higher when theta tends to be zero.
Figure 1. Scatter plots of BMP with different Kendall's tau.
3. Maximum likelihood estimations
In this section, we analyse the data with dependent competing risks by using an assumed copula function in CSALT under Type-II progressive censoring scheme (PCS). Under a k constant stress levels ALT, s1 < s2 < ⋅⋅⋅ < sk are accelerated stress levels and s0 is the normal stress level. The Type-II PCS can be described as: at each stress level si, i = 1, 2, …, k, suppose there are ni identical units are put into the life test with PCS. When the first failure time ti1 is observed, Ri1 survivals are randomly removed from the remaining ni − 1 units. At the second failure time ti2 is observed, Ri2 survivals are randomly removed from the remaining ni − Ri1 − 2 units. And so on, until the rith failure time is observed, all of the remaining
units are removed and the testing is terminated. Then we obtain the failure data
, where
and cil take any number in the set of {1, 2}, and cil = j, j = 1, 2 indicates that the failure is caused by failure mode j.
3.1. Basic assumptions
A1. Only one of the two competing risk modes causes the unit failure. The dependence of two competing risk modes and their survival copula function are given in Equation (Equation2.4(2.4) ), and their lifetimes are T1andT2, respectively. So the lifetime of a unit is T = min (T1, T2).
A2. Under stress level si, the failure time of the unit due to risk mode j, denoted by Tij, which follows a Lomax distribution Lo(mij, τij) with shape parameter mij and scale parameter τij. The probability density function and survival function are given as follows:
A3. The failure mechanisms are the same under different stress levels. Because the shape parameters reflect the failure mechanism, that is, they have the same shape parameter mij = mj(i = 0, 1, …, k; j = 1, 2). In practical tests, to ensure the failure mechanism is constant, the highest stress level sk should be less than the extreme stress level smax which cannot change the failure mechanism of the units.
According to A1–A3, we can obtain the survival function of the unit under stress si as follows:(3.1)
A4. Under stress level si, the accelerated life equation of the jth failure mechanism(3.2) where aj, bj are unknown coefficients and ϕ(s) is a given function of the stress level s.
3.2. Maximum likelihood estimation
Under stress level si, let qij denote the failure number caused by jth failure mode, namely(3.3) when δ1(cil) = 1, til is the failure time caused by failure mode 1, and when δ2(cil) = 1, til is the failure time due to failure mode 2. Thus, the likelihood function under stress level si is
(3.4)
Based on EquationEquations (2.4)(2.4) , (Equation3.1
(3.1) ) and (Equation3.3
(3.3) ), Li can be written as
The full likelihood function is , and the log-likelihood function is
By setting the first partial derivative of log L with respect to the parameters mj, τij, θ to zero, the likelihood equations are derived as(3.5)
(3.6)
(3.7)
As the MLEs are hard to be solved analytically from EquationEquations (3.5)
(3.5) –(Equation3.7
(3.7) ), numerical methods can be considered, such as Newton–Raphson iteration method or other iteration methods.
4. Confidence intervals and reliability estimation of unit
From the above analysis, the exact CIs of mj, τij, θ(i = 1, 2, 3; j = 1, 2) are hard to get, so we can consider the Bootstrap method.
4.1. Bootstrap-p method
Step 1: Given ni, ri, i = 1, 2, …, k and progressive censored sample
, compute the MLEs
Step 2: Generate a bootstrap sample
Step 3: Repeat Step 2 N times, N estimators
Step 4: Arrange
Step 5: The approximate 100(1 − α)% CIs of mj, τij, θ are given by
4.2. Bootstrap-t method
Step 1: Given ni, ri, i = 1, 2, …, k and progressive censored sample
Step 2:Generate a bootstrap sample
Step 3:Compute
Step 4:Let
Step 5:Arrange
Step 6:The two-sided 100(1 − α)% CIs for parameters mj, τij, θ are given by
4.3. Reliability estimation of unit
According to A4, the least squares estimators of aj, bj from the Gauss–Markov theorem are(4.1) where
.
Hence, under the normal stress level s0, the shape parameter under failure mode j is
Thus, the reliability estimator of unit is
5. Numerical simulation
Consider a three-level constant stress ALT with two dependent competing risks modes under Type-II PCS. Select the temperature as the stress level, and suppose the normal stress level and the accelerated stress levels are 25, 60, 90 and 120 °C, respectively, namely s0 = 298.15 K, s1 = 333.15 K, s2 = 363.15 K, s3 = 393.15 K, and the accelerated function is ϕ(s) = 1/s. Given the values of parameters a1 = −3, b1 = 1640, a2 = −4, b2 = 2000, m1 = 2, m2 = 1.8, then we can obtain that the true values of shape parameters under three stress levels are τ11 = 6.8395, τ12 = 7.4135, τ21 = 4.5542, τ22 = 4.5148, τ31 = 3.2266, τ32 = 2.9657.
Take the sample sizes under each stress level si(i = 1, 2, 3) as n1 = 20, n2 = 40, n3 = 80; the numbers of failure are (r1, r2, r3) = (6, 12, 24) and (r1, r2, r3) = (12, 24, 48). The pre-fixed sampling schemes
are given in .
Table 1. The pre-fixed sampling scheme.
Considering two competing risks modes and the dependence structure is determined by BPC. Thus, the accelerated function under the stress level si based on Arrhenius formula is
5.1. Data generation and results analysis
The copula function of (Ui1, Vi2) is BPC C(u, v); let cu(v) = ∂C(u, v)/∂u. Under stress level si, the failure data can be generated as follows:
Step 1: Generate ni independent uniform (0,1) vectors (U(k)i1, Zi2(k)), k = 1, 2, …, ni;
Step 2: Calculate V(k)i2 = cu− 1(Z(k)i2), then (U(k)i1, Vi2(k)) is the data of C(u, v), where c− 1u( · ) is the pseudo-inverse of cu( · );
Step 3: Let
Step 4: Obtain (tij, δij) = (min (x(k)i1, x(k)i2), I(x(k)i1 < xi2(k))), j = 1, 2, …, ni;
Step 5: Sort the data (tij, δij) by their times tij in an increasing order. Choose ri data according to the characteristic of the Type-II PCS. Then we can obtain the needed data (til, δil), l = 1, 2, …, ri under the stress level si.
The Kendall's tau τ = 1/3, 1/5 when given different relation coefficients θ = 1, 2. Based on the generated competing failure data, the MLEs of the unknown parameters, the mean square errors (MSEs), the 95% confidence intervals of Bootstrap-p (BPCIs) and Bootstrap-t (BTCIs), as well as the coverage percentages (CPs) are computed through 1000 times simulations. The numerical simulation results are shown in –.
Table 2. Average MLEs, MSEs, BPCIs, BTCIs and CPs under different stress levels in two cases when (τ11, τ12, τ21, τ22, τ31, τ32) = (6.8395, 7.4135, 4.5542, 4.5148, 3.2266, 2.9657), (m1, m2) = (2, 1.8), θ = 1.
Table 3. Estimators of acceleration coefficients in two cases when (a1, a2, b1, b2) = ( − 3, −4, 1640, 2000), θ = 1.
Table 4. Average MLEs, MSEs, BPCIs, BTCIs and CPs under different stress levels in two cases when (τ11, τ12, τ21, τ22, τ31, τ32) = (6.8395, 7.4135, 4.5542, 4.5148, 3.2266, 2.9657), (m1, m2) = (2, 1.8), θ = 2.
Table 5. Estimators of acceleration coefficients in two cases when (a1, a2, b1, b2) = ( − 3, −4, 1640, 2000), θ = 2.
From the tables, some conclusions can be obtained as follows:
| (1) | The MLEs of the unknown parameters are better when the effective sample size is larger. | ||||
| (2) | The MSEs of the unknown parameters are close to zero when the sample size becomes larger. | ||||
| (3) | The CPs of the unknown parameters are close to 0.95 when the effective sample size gets larger. | ||||
5.2. Reliability analysis of unit
Given the parameters of lifetime distribution functions and the coefficients of accelerated functions, the true values and the estimators of reliability function of the unit at any time t are
the reliability function of unit when the failure causes are independent is
and give the trends of three reliability functions over time in Case I and Case II when θ = 1, respectively.
Figure 2. Comparison of three reliability functions when θ = 1.
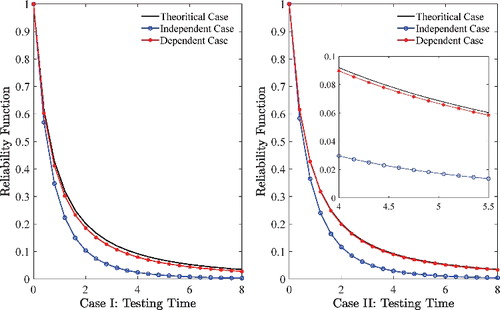
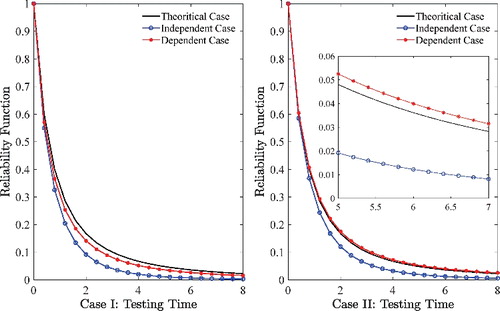
Figure 3. Comparison of three reliability functions when θ = 2.
From Case I of , we can find that the estimators of reliability are close to the true values, while the values in independent case are far away from the true values. According to Case II, the curves of three reliability functions are very close, as time goes on, the estimators of dependent case close to the true values, but the values in independent case are far away from the true values. In this example, the independent case is lower than the dependent case.
From , we can get the same conclusions like . Due to the different correlation coefficients, it may estimate lower when considering the dependent competing risks modes as independent in our simulation cases.
6. Illustrative example
In this section, an example is presented to support the proposed model and methods. The data-set includes the accelerated failure times and failure causes in bivariate dependent competing risks model, which was presented in Wu et al. (Citation2017), and Zhang, Shi, Bai, and Fu (Citation2017) also analysed this data-set. In the data-set, the accelerated stress is the temperature; there are three accelerated stress levels, namely, s1 = 303 K, s2 = 333 K and s3 = 363 K. The normal stress level is s0 = 278 K. At each stress level si, ni = 20 units are put into the life testing for i = 1, 2, 3. The numbers of failures and removals are and
. The accelerated function with ϕ(si) = 1/si is used to extrapolate the estimators of unknown parameters at normal stress level s0. From EquationEquations (3.5)
(3.5) –(Equation3.7
(3.7) ), the MLEs, BPCIs and BTCIs of unknown parameters are obtained, and the dependent coefficient and the results are presented in .
Table 6. MLEs, BPCIs and BTCIs of unknown parameters.
Then we can calculate the estimators of the acceleration coefficients a1, a2, b1 and b2 by using EquationEquation (4.1)(4.1) ,
. And the estimators of unknown parameters under stress level s0 can be obtained as
.
7. Conclusions
ALT is an important testing scheme to obtain the lifetime data of units. Since the failure causes of the unit are manifold and it is not completely independent among these failure causes. Thus, it is very meaningful to consider the dependent competing risks modes in ALT. In this paper, we consider the dependent competing risks model with two failure modes, and some simulations are given under the Type-II censoring ALT. According to the results, we find it advantageous to analyse the failure data of dependent competing risks modes by using copula theory, which avoids the reliability estimators of unit too high or too low. The copula theory provides an effective and feasible basis in theory to analyse the reliability of components and units in the future and has some theoretic meaning and applied values.
Disclosure statement
No potential conflict of interest was reported by the authors.
Additional information
Funding
References
- Aristidis, K. N. (2013). On the estimation of normal copula discrete regression models using the continuous extension and simulated likelihood. Journal of Statistical Planning and Inference, 143, 1923–1937.
- Balakrishnan, N., & Han, D. (2008). Exact inference for a simple step-stress model with competing risks for failure from exponential distribution under Type-II censoring. Journal of Statistical Planning and Inference, 138, 4172–4186.
- Balakrishnan, N., & Lai, C. D. (2009). Continuous bivariate distributions. New York, NY: Springer Press.
- Beyersmann, J., Schumacher, M., & Allignol, A. (2012). Competing risks and multistate models with R. Springer.
- Bourguignon, M., Saulo, H., & Fernandez, R. N. (2016). A new Pareto-type distribution with applications in reliability and income data. Physica A, 457, 166–175.
- Cheng, G., Zhou, L., Chen, X., & Zhuang, J. (2014). Efficient estimation of semiparametric copula models for bivariate survival data. Journal of Multivariate Analysis, 123, 330–344.
- Cramer, E., & Schmiedt, A. B. (2011). Progressively Type-II censored competing risks data from Lomax distributions. Computational Statistics and Data Analysis, 55(3), 1285–1303.
- Dimitrova, D. S., Haberman, S., & Kaishev, V. K. (2013). Dependent competing risks: Cause elimination and its impact on survival. Insurance: Mathematics and Economics, 23, 464–477.
- Dixit, U. J., & Nooghabi, M. J. (2010). Efficient estimation in the Pareto distribution. Statistical Methodology, 7, 687–691.
- Fernández, A. J. (2014). Computing optimal confidence sets for Pareto models under progressive censoring. Journal of Computational and Applied Mathematics, 258, 168–180.
- Grothe, O., & Hofert, M. (2015). Construction and sampling of Archimedean and nested Archimedean Levy copulas. Journal of Multivariate Analysis, 138, 182–198.
- Han, D., & Balakrishnan, N. (2010). Inference for a simple step-stress model with competing risks for failure from the exponential distribution under time constraint. Computational Statistics and Data Analysis, 54, 2066–2081.
- Helu, A., Samawi, H., & Raqab, M. Z. (2015). Estimation on Lomax progressive censoring using the EM algorithm. Journal of Statistical Computation and Simulation, 85(5), 1035–1052.
- Jia, X., & Cui, L. (2012). Reliability research of k-out-of-n: G supply chain unit based on copula. Communications in Statistics - Theory and Methods, 41(21), 4023–4033.
- Jia, X., Wang, L., & Wei, C. (2014). Reliability research of dependent failure units using copula. Communications in Statistics - Simulation and Computation, 43(8), 1838–1851.
- Liu, F., & Shi, Y. (2017). Inference for a simple step-stress model with progressively censored competing risks data from Weibull distribution. Communications in Statistics - Theory and Methods, 46(14), 7238–7255.
- Mazucheli, J., & Achcar, J. A. (2011). The Lindley distribution applied to competing risks lifetime data. Computer Methods and Programs in Biomedicine, 104, 188–192.
- Muliere, P., & Scarsini, M. (1987). Characterization of a Marshall-Olkin type class of distributions. Annals of Institute of Statistical Mathematics, 39, 429–441.
- Nelsen, B. (2006). An introduction to copulas (2nd ed.). New York, NY: Springer Press.
- Pareto, V. (1987). Cours dćonomie Politique. Lausanne.
- Sarhan, A. M., & El-Gohary, A. I. (2003). Estimations of parameters in Pareto reliability model in the presence of masked data. Reliability Engineering and Unit Safety, 82, 75–83.
- Sarhan, A. M., Hamilton, D. C., & Smith, B. (2010). Statistical analysis of competing risks models. Reliability Engineering and Unit Safety, 95, 953–962.
- Wu, M., & Shi, Y. (2016). Bayes estimation and expected termination time for the competing risks model from Gompertz distribution under progressively hybrid censoring with binomial removals. Journal of Computational and Applied Mathematics, 300, 420–431.
- Wu, M., Shi, Y., & Zhang, C. (2017). Statistical analysis of dependent competing risks model in accelerated life testing under progressively hybrid censoring using copula function. Communication in Statistics- Simulation and Computation, 46(5), 4004–4017.
- Xu, A., & Tang, Y. (2012). Statistical analysis of competing failure modes in accelerated life testing based on assumed copulas. Chinese Journal of Applied Probability and Statistics, 28, 51–62.
- Xu, A., & Zhou, S. (2017). Bayesian analysis of series system with dependent causes of failure. Statistical Theory and Related Fields, 1(1), 128–140.
- Yang, M., Wei, C., & Fan, Q. (2014). Parameter estimation for Lomax distribution under Type II censoring. Advanced Materials Research, 912-914, 1663–1668.
- Yi, W., & Wei, G. (2007). Study on the reliability of dependence-parts vote unit based on copula functions. Journal of Southwest China Normal University (Natural Science), 32(6), 52–55.
- Zhang, X., Shang, J., Chen, X., Zhang, C., & Wang, Y. (2014). Statistical inference of accelerated life testing with dependent competing failures based on copula theory. IEEE Transaction on Reliability, 63(3), 764–780.
- Zhang, C., Shi, Y., Bai, X., & Fu, Q. (2017). Inference for constant-stress accelerated life tests with dependent competing risks from bivariate Birnbaum–Saunders distribution based on adaptive progressively hybrid censoring. IEEE Transactions on Reliability, 66(1), 111–122.