
 ?Mathematical formulae have been encoded as MathML and are displayed in this HTML version using MathJax in order to improve their display. Uncheck the box to turn MathJax off. This feature requires Javascript. Click on a formula to zoom.
Abstract
The main purpose of this paper is to investigate D-optimal population designs in multi-response linear mixed models for longitudinal data. Observations of each response variable within subjects are assumed to have a first-order autoregressive structure, possibly with observation error. The equivalence theorems are provided to characterise the D-optimal population designs for the estimation of fixed effects in the model. The semi-Bayesian D-optimal design which is robust against the serial correlation coefficient is also considered. Simulation studies show that the correlation between multi-response variables has tiny effects on the optimal design, while the experimental costs are important factors in the optimal designs.
MSC 2010:
1. Introduction
In many statistical studies, it is quite common that repeated measured data are collected over time and are often referred to as longitudinal data. Mixed effects models are widely used for the analysis of such correlated data. However, the responses are usually time-structured when they are measured at different time points. Modeling of autocorrelations through use of autoregressive error structure, in addition with random effects terms, may be more appropriate (Chi & Reinsel, Citation1989). For a list of correlation structures, we also refer to the monographs by Verbeke and Molenberghs (Citation2000) and Molenberghs and Verbeke (Citation2005).
The aim of optimal experimental design is to arrange a reasonable design schedule, so that the experimenter can obtain the maximal information of the experiment at minimal cost. In the case of single-response with correlated errors under the AR(1) structure assumption, Tan and Berger (Citation1999) studied optimal designs for linear mixed effects models with longitudinal data, while Berger et al. (Citation2003) and Azurduy (Citation2009) studied the robust designs in a maximin approach. Nyberg et al. (Citation2012) considered the optimal designs for nonlinear mixed effects models with serial correlation. Liu et al. (Citation2019) discussed the D-optimal design for the multi-response linear mixed effects models by modelling the serial correlation with totally mixed effects. For the case of longitudinal data generated from the multi-response models with repeated measurements, correlated errors also play an important role in model description and estimation. Roy (Citation2006) discussed how the correlation coefficient between two response variables was effected by the autocorrelation structure of repeated measures. Wang and Fan (Citation2010) applied the multi-response linear mixed effects model (MLMM) with correlated errors to model repeated continuous data and presented ECM procedure to obtain the maximum likelihood estimates of model parameters. A general description of the statistical analysis of the multi-response longitudinal models can be found in Verbeke et al. (Citation2014).
In this paper, we are interested in deducing the approximate designs of the fixed effects parameters in the multi-response linear mixed effects models with AR(1) autoregressive error structure. The generalised estimating equation (GEE) approach (Liang & Zeger,Citation1986) is used to estimate the model. The effects of the experimental cost on the optimal population design is also discussed.
The rest of the paper is organised as follows. Section 2 introduces the notation and provides the Fisher information matrices of individual design and population design. Section 3 gives the equivalence theorem for the D-optimal population design with respect to the estimation of the fixed effects and defines the relative D-efficiency by considering a linear experimental cost. The methodology is illustrated with a real example concerning the AIDS Clinical Trials Group Study in Section 4. Concluding remarks are given in Section 5.
2. Model description and information matrix
2.1. Assumptions and preliminaries
Suppose there are N independent individuals in a longitudinal study and for each individual there are r response variables observed over time. Although each response variable may be observed under different design schedules, index matrices can be used (Ogungbenro et al., Citation2007) to describe it. Hence, a balanced design (Schmelter, Citation2007b), in which all r responses are measured under the same design schedule, is considered.
Let be an
response vector observed at the jth measurement of individual i, and let
be the within individual observation error vector with zero mean,
. Let
be an
covariance matrix describing the correlation of the r different responses. The multi-response linear regression model with mixed effects is defined as
(1)
(1)
where
is an
fixed-effects design matrix,
is an
random-effects design matrix,
is a p-dimensional fixed-effects vector and
is an l-dimensional (
) random-effects vector with mean zero and
variance–covariance matrix
(Molenberghs & Verbeke, Citation2005). It is assumed that
is a positive definite matrix.
In general, in a longitudinal study, at least three repeated observations of the responses are required over time. We assume (
) is an
-point design (without repetition) for individual i with equal weight
on each point,
. The observations of different subjects are independent, but those within subject i conditioned on
are dependent. Let
be a working autocorrelation matrix among all
possible observations
of the kth response variable. The common working correlation structure could be as simple as independent, equicorrelated, first-order autoregressive AR(1), or could be unspecified. In this paper, the autoregressive process of order one, AR(1) is used (Diggle, Citation1988; Wang & Fan, Citation2010), and then the autocorrelation matrix of the individual i is
, where ρ (
) is the autocorrelation coefficient that gives the correlation between two time points that are one unit of time apart. This correlation structure implies that repeated measurements are more highly correlated in closer time and become less correlated as the difference in time points increases.
For each individual i, denoting and
, …,
, the multi-response linear mixed model in (Equation1
(1)
(1) ) is expressed as
(2)
(2)
where
and
. It is assumed that the random-effects vector
is independent with
. By letting
be the diagonal marginal variance matrix of
, the covariance matrix
of
in model (Equation2
(2)
(2) ) can be expressed as (Wang & Fan, Citation2010)
(3)
(3)
According to the GEE method, the Fisher information matrix of a single individual design
for individual i is
(4)
(4)
The Fisher information matrix in (Equation4
(4)
(4) ) depends on the value of ρ, which is often not explicitly known in an experiment. Assuming that ρ has a range of possible values, we investigate a robust D-optimal design criterion (see Section 3).
2.2. Information matrix of the population design
Consider now a population design comprising Q distinct individual designs with individuals allocated to the design with
time points
for
(Schmelter, Citation2007a, Citation2007b). Denote this population design as follows:
(5)
(5)
where
. To turn the discrete optimisation problem into a continuous one, we allow approximate designs, where the weights
's can be arbitrary numbers in the interval
summing up to 1. Then, the Fisher information matrix for the fixed-effects vector
at the population design ζ is defined by
(6)
(6)
where
is determined as in (Equation4
(4)
(4) ). By defining
,
and
, the matrix
in (Equation6
(6)
(6) ) can be expressed as
(7)
(7)
3. The D-optimal design and robust design
3.1. The general equivalence theorem
A D-optimal population design, , for estimating the fixed effects in the MLMM (Equation1
(1)
(1) ) maximises the logarithm of the determinant of the Fisher information matrix
given in (Equation7
(7)
(7) ), i.e.,
(8)
(8)
The General Equivalence Theorem relating to the approximate D-optimal population design is given in the following, which is based on very mild assumptions that the set of all population designs ζ is compact on the design space and the D-optimality criterion
is convex and differentiable. The Frechet derivative of
in the direction of any individual design
is
.
Theorem 3.1
A population design is D-optimal for the estimation of the fixed-effects vector
if and only if
The design
maximises
The design
The maximum of
This theorem can be used to construct or check the optimality of a population design (Equation5(5)
(5) ), which provides a basis for the following discussion of optimal designs considering the experimental spending.
3.2. Semi-Bayesian D-optimal design
Both the individual Fisher information matrix in (Equation4(4)
(4) ) and the population Fisher information matrix in (Equation7
(7)
(7) ) depend on ρ, which is always unknown before starting an experiment. Assume that ρ obeys a distribution with probability density function
defined on an interval
(
). A design is said to be semi-Bayesian D-optimal, denoted by
, if it maximises
(9)
(9)
It is known that the semi-Bayesian D-optimal design is robust against a variety of ρ.
In order to calculate the integral defined by (Equation9(9)
(9) ), a set of 901 points is drawn from the prior distribution of ρ. Numerical approximations are applied by sampling parameter values from the prior distribution of
and replacing the integral in (Equation9
(9)
(9) ) with the sample mean. All computations are carried out in MATLAB R2010a (64bt) using a computer with 2.40GHz Intel processor and 4GB RAM. The Matlab function ‘fmincon’ is used to find the maximum of (Equation9
(9)
(9) ) and the optimal design. The aim of Bayesian design criterion is to find a design which maximises
, which is equivalent to find a design which minimises the opposite of
. ‘Fmincon’ just attempts to find a constrained minimum of a scalar function of several variables starting at an initial estimate. The equidistant design is used as the starting points in our program, and the optimal design is not sensitive to the starting points. The computing time to generate a Bayesian optimal design is about 3 hours, and the running time increases with the increasing number of time points.
For longitudinal data, the more measurements per individual are taken, the more additional information provides. However, the number of measurements per individual is usually limited because of the experimental sampling budget or logistical restrictions. The linear cost function defined by Tekle et al. (Citation2008) is expanded to the population design ζ for the model with r responses
(10)
(10)
where
is the cost of recruiting a new individual,
represents the average cost per measurement, and
.
Thus, as proposed in Fedorov et al. (Citation2002), the Fisher information matrix in (Equation7(7)
(7) ) under the population design ζ of the form (Equation5
(5)
(5) ) should be normalised for the cost constraint in (Equation10
(10)
(10) ), that is
(11)
(11)
where
is the standard information matrix at the individual design
and
The optimal population design problem is to identify the optimal weight, and the locations of the time points of each individual design. The value of frequency
of the individual design
can be obtained by rounding
to the nearest integer subject to
. For comparing the efficiencies of two population designs
and
under the cost constraint, the D-efficiency of
relative to
is defined by
(12)
(12)
For the normalised Fisher information matrix
, the general equivalence theorem still holds, and the verification is given in Section 4 by a simulation study.
Theorem 3.2
For a given linear cost function, a population design is D-optimal for the estimation of the fixed-effects vector
if and only if
The design
The design
The maximum of
4. Numerical studies
In this section, a linear and quadratic mixed effects model is considered to show the effects of autocorrelation coefficient ρ on optimal designs. The optimal designs for the bivariate AIDS model studied in Wang and Fan (Citation2010) is also discussed.
4.1. Simulation example
Consider a linear and quadratic mixed effects model
(13)
(13)
Assuming that each individual is observed under time schedule
. The unknown parameters are given previously to find the optimal population design. Let
, and the covariance matrix of the two responses
and
is
The covariance matrix of the three mixed effects variables
is
The design region is
.
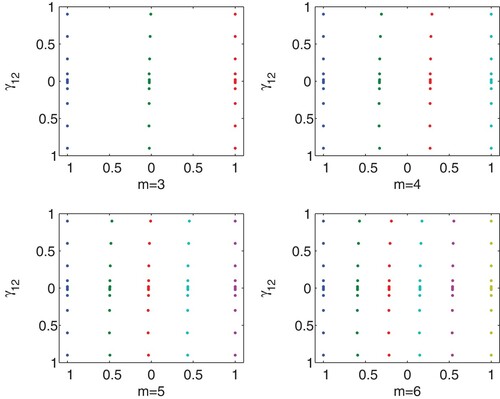
We first show that the correlation between the two characteristics has slightly effect on the optimal designs. Fixing , the individual D-optimal design for different values of m = 3, 4, 5, 6 and
,
,
,
,
,
are shown in Figure . All the optimal designs have design points located in the left and right endpoints of the design area, for value of
in the neighbourhood of 0 that the optimal designs are almost the same, with the increase of absolute value of
, there are some subtle differences between the allocation of the optimal designs. In addition, the relative D-efficiency of the individual optimal designs at
compared to
are all almost 1, whatever the number of design points is. Hence, the correlation between characteristics has slight effects on the D-optimal designs, which is consistent with the results in Atkinson et al. (Citation2007). Hence, we take
in the model (Equation13
(13)
(13) ) and consider the effects of ρ on D-optimal designs in what follows.
Figure 1. The individual D-optimal design allocations of time points for the linear and quadratic mixed effects model (Equation13(13)
(13) ) for different values of m and
.
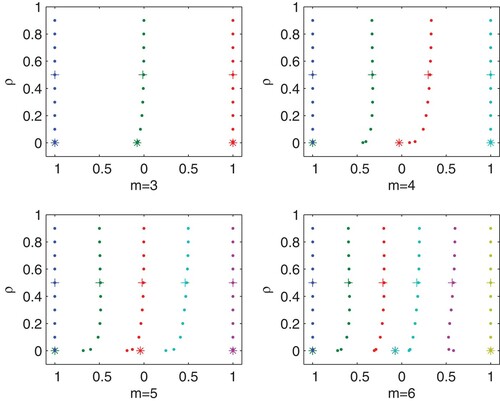
The individual D-optimal allocations of time points for different autocorrelation coefficient ρ are presented in Figure , the number of design points are
and 6, respectively. By assuming that ρ obeys an uniform distribution on
, the Bayesian optimal designs (Equation9
(9)
(9) ) are also calculated, and the results are also shown in Figure . The asterisks show the D-optimal allocations of time points when
, the filled dots are the design position for
and the plus signs are the design position of Bayesian optimal designs. It can be observed that when the number of design points is three, the allocation of the optimal designs are almost the same. While for
, when ρ equals zero, the optimal design points clustered at the left, middle and right endpoints of the design area, which maybe infeasible and less informative in practice. With the increase of ρ, the locations of the D-optimal design points are moderately affected by the autocorrelation coefficient ρ, especially for large values of ρ. And there isn't much difference between the Bayesian optimal design and locally D-optimal design when
.
Figure 2. The individual optimal design allocations of time points for the linear and quadratic mixed effects model (Equation13(13)
(13) ) for different values of m and ρ.
4.2. Optimal designs for the AIDS model
The bivariate longitudinal AIDS model is based on a set of data in the AIDS Clinical Trials Group Study 175, and only the post-week-12 data were considered, in which the CD4 and CD8 cell counts (per cubic millimetre) of a total of 20 patients were recorded per protocol about every 12 weeks thereafter on each patience visit. Let denote the
-transformed CD4 and CD8 cell counts for patient i at the scaled time
,
,
. The model considered here is assumed to be the following two-response linear mixed model with AR(1) errors
(14)
(14)
According to Table 1 in Wang and Fan (Citation2010), the maximum likelihood estimates of the fixed-effects vector
via the ECM algorithm based on the data is
, the estimate of the autocorrelation coefficient ρ is 0.3821, and the estimate of the covariance matrix of two response variables is
.
We now consider the D-optimal single-group design for model (Equation14(14)
(14) ), where all individuals are observed under the same settings, that is,
where
is a single sequence of m time points in the design region
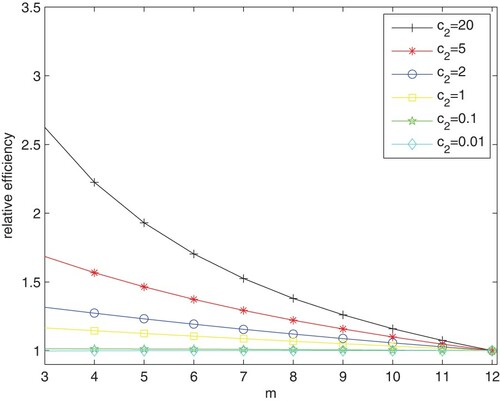
. Suppose the experimental cost to be considered in an experiment. The relative efficiency defined in (Equation12
(12)
(12) ) is calculated for the cost of recruiting a new individual,
, and the average cost per measurement,
, ranging from 0.01 to 20. The D-optimal designs
are determined by Theorem 3.2. Figure shows the relative efficiencies of
(
) compared to
for
and
. In each curve corresponding to a value of
, the optimal number of time points is the number m at which the relative efficiency is the highest. It is observed that the number of optimal design points is m = 3 for
, 2, 5, 20. And the performances of the designs,
(
), are almost the same for
and 0.1.
Figure 3. Relative efficiencies of relative to
for the two-response linear mixed model (Equation14
(14)
(14) ) with costs
and
.
We now consider more-group designs. The set of possible sampling times considered is a predefined set T (Castañeda & López-Rios, Citation2016). For example, we let T be the 12-point single group balanced D-optimal design for model (Equation14(14)
(14) ), that is
In practice, experimenter can choose a set of possible sampling times by their experience or some prior information (Nyberg et al., Citation2012). We assume that three or four measurements are available for each individual, and there is no replication at a certain time point. It is noted from Figure that a large value of
results in a small sample size, and we then consider the cost function (Equation10
(10)
(10) ) where
,
, for example. We find the D-optimal population design as follows:
which can be verified by Theorem 3.2. Therefore, according to Gagnon and Leonov (Citation2005) and (Equation11
(11)
(11) ), the ratio of the frequencies is
which means that about
of the population are observed at
, and about
should be measured at
. Obviously, this population optimal design is more efficient than the single design
when considering the cost.
On the other hand, the result is a little different from Schmelter (Citation2007a, Citation2007b), and each individual design involved in is no longer D-optimal. When the value of
varies, the individual designs remain the same, while the weight of each individual design changes, and the population design tends to single three or four points single-group design.
5. Conclusion
The problem of choosing the optimal population design is investigated for the multi-response linear mixed effects models with correlated errors. AR(1) structure is used to model the time series autocorrelation of the errors. A higher order AR may be worth consideration, however, it brings more unknown parameters into the model. Simulation study is used to show the effect of autocorrelation on designs and parameter estimations. The equivalence theorems are provided to characterise the optimal population designs for the estimation of the fixed effects.
It should be noticed that the autocorrelation coefficient and the variance parameters in the random effect distribution are pre-specified in finding the D-optimal designs. In practice, the experimenter may get some prior information of the parameters, such as the range of parameter values. Then, a semi-Bayesian criterion is used in combination with the D-optimal criterion to find the optimal design robust to the autocorrelation coefficient. A topic for further research may be to construct optimal designs with respect to other optimality criteria, such as T-optimality criterion, or compound criterion. The result may be extended to polynomial mixed models with measurement error, and also to generalised linear mixed effects models.
Acknowledgments
This work was partly supported by the National Natural Science Foundation of China (Nos. 11971318, 11871143) and Shanghai Rising-Star Program (No. 20QA1407500).
Disclosure statement
No potential conflict of interest was reported by the author(s).
Additional information
Funding
Notes on contributors
Hongyan Jiang
Hongyan Jiang is a Ph.D. in Statistics, Shanghai Normal University, 2019, Associate Professor in Huaiyin Institute of Technology, Jiangsu, 2019–Present.
Rongxian Yue
Rongxian Yue is a Ph.D. in Statistics, Hong Kong Baptist University, 1997. Postdoctoral Research Fellow in Statistics, East China Normal University, 1997–1999. Associate Professor (1999–2001) and Professor (2001–Present), Shanghai Normal University.
References
- Atkinson, A. C., Donev, A. N., & Tobias, R. D. (2007). Optimum experimental designs, with SAS. Oxford University Press.
- Azurduy, S. A. O. (2009). Robust designs for longitudinal studies. University of Maastricht.
- Berger, M. P. F., Ouwens, M. J. N. M., & Tan, F. E. S. (2003). Robust designs for longitudinal mixed effects models. In H. Yanai, A. Okada, K. Shigemasu, Y. Kano, & J. J. Meulman (Eds.), New developments in psychometrics. Springer.
- Castañeda, L. M. E., & López-Rios, V. I. (2016). Optimal population designs for discrimination between two nested nonlinear mixed effects models. Revista Ciencia En Desarrollo, 7(1), 71–81. https://doi.org/10.19053/01217488.4233
- Chi, E. M., & Reinsel, G. C. (1989). Models for longitudinal data with random effects and AR(1) errors. Journal of the American Statistical Association, 84(406), 452–459. https://doi.org/10.1080/01621459.1989.10478790
- Diggle, P. J. (1988). An approach to the analysis of repeated measurements. Biometrics, 44(4), 959–971. https://doi.org/10.2307/2531727
- Fedorov, V. V., Gagnon, R. C., & Leonov, S. L. (2002). Design of experiments with unknown parameters in variance. Applied Stochastic Models in Business and Industry, 18(3), 207–218. https://doi.org/10.1002/(ISSN)1526-4025
- Gagnon, R., & Leonov, S. (2005). Optimal population designs for PK models with serial sampling. Journal of Biopharmaceutical Statistics, 15(1), 143–163. https://doi.org/10.1081/BIP-200040853
- Liang, K. Y., & Zeger, S. L. (1986). Longitudinal data analysis using generalized linear models. Biometrika, 78(1), 13–22. https://doi.org/10.1093/biomet/73.1.13
- Liu, X., Yue, R. X., & Wong, W. K. (2019). D-optimal designs for multi-response linear mixed models. Metrika, 82, 87–98. https://doi.org/10.1007/s00184-018-0679-7
- Molenberghs, G., & Verbeke, G. (2005). Models for discrete longitudinal data. Springer Science+Business Media, Inc.
- Nyberg, J., Höglund, R., Bergstrand, M., Karlsson, M. O., & Hooker, A. C. (2012). Serial correlation in optimal design for nonlinear mixed effects models. Journal of Pharmacokinetics and Pharmacodynamics, 39(3), 239–249. https://doi.org/10.1007/s10928-012-9245-5
- Ogungbenro, K., Gueorguieva, I., Majid, O., Graham, G., & Aarons, L. (2007). Optimal design for multiresponse pharmacokinetic-pharmacodynamic models – dealing with unbalanced designs. Journal of Pharmacokinetics and Pharmacodynamic, 34(3), 313–331. https://doi.org/10.1007/s10928-006-9048-7
- Roy, A. (2006). Estimating correlation coefficient between two variables with repeated observations using mixed effects model. Biometrical Journal, 48(2), 286–301. https://doi.org/10.1002/(ISSN)1521-4036
- Schmelter, T. (2007a). The optimality of single-group designs for certain mixed models. Metrika, 65, 183–193. https://doi.org/10.1007/s00184-006-0068-5
- Schmelter, T. (2007b). Considerations on group-wise identical designs for linear mixed models. Journal of Statistical Planning and Inference, 137(12), 4003–4010. https://doi.org/10.1016/j.jspi.2007.04.017
- Tan, F. E. S., & Berger, M. P. F. (1999). Optimal allocation of time points for the random effects model. Communications in Statistics-Simulation and Computation, 28(2), 517–540. https://doi.org/10.1080/03610919908813563
- Tekle, F. B., Tan, F. E. S., & Berger, M. P. F. (2008). D-optimal cohort designs for linear mixed-effects model. Statistics in Medicine, 27(14), 2586–2600. https://doi.org/10.1002/sim.v27:14
- Verbeke, G., Fieuws, S., Molenberghs, G., & Davidian, M. (2014). The analysis of multivariate longitudinal data: A review. Statistical Methods in Medical Research, 23(1), 42–59. https://doi.org/10.1177/0962280212445834
- Verbeke, G., & Molenberghs, G. (2000). Linear mixed models for longitudinal data, Springer Series in Statistics. Springer.
- Wang, W. L., & Fan, T. H. (2010). ECM-based maximum likelihood inference for multivariate linear mixed models with autoregressive errors. Computational Statistics and Data Analysis, 54(5), 1328–1341. https://doi.org/10.1016/j.csda.2009.11.021