
 ?Mathematical formulae have been encoded as MathML and are displayed in this HTML version using MathJax in order to improve their display. Uncheck the box to turn MathJax off. This feature requires Javascript. Click on a formula to zoom.
Abstract
A good visualisation method can greatly enhance human-machine collaboration in target contexts. To aid the optimal selection of visualisations for users, visualisation recommender systems have been developed to provide the right visualisation method to the right person given specific contexts. A visualisation recommender system often relies on a user study to collect data and conduct analysis to provide personalised recommendations. However, a user study without employing an effective experimental design is typically expensive in terms of time and cost. In this work, we propose a prediction-oriented optimal design to determine the user-task allocation in the user study for the recommendation of visualisation methods. The proposed optimal design will not only encourage the learning of the similarity embedded in the recommendation responses (i.e., users' preference), but also improve the modelling accuracy of the similarities captured by the covariates of contexts (i.e., task attributes). A simulation study and a real-data case study are used to evaluate the proposed optimal design.
1. Introduction
Visualisation methods have been widely investigated to graphically represent complex data sets for effective comprehension and generation of insights (Spence, Citation2001). With multiple visualisation methods available (e.g., use of colour, layout and labelling, user-system interaction, visual encodings), the effectiveness and efficiency of a visualisation is largely determined by the contexts (e.g., tasks, environments, devices, modalities) and individual differences (e.g., personal preference, perceptual and cognitive capabilities) (Bednarik et al., Citation2012; Chen & Jin, Citation2017; Voigt et al., Citation2012). Beyond visualisation, recommender systems have been widely adopted to provide personalised suggestions based on attributes of the contexts and historical information of users' interests. Therefore, in the literature, recommender systems for personalised visualisation have been developed to provide the right visualisation methods to the right people given specific contexts. Among the various approaches of visualisation recommender systems, there are three major categories: (i) content-based filtering that predicts the recommendation scores (e.g., user's rating, preference score, completion time, cognitive workload, etc.) based on the similarity among users and contexts captured by the corresponding covariates (Bogdanov et al., Citation2013); (ii) collaborative filtering that makes the recommendation based on the similarity hidden in the historical responses (Kunkel et al., Citation2017); and (iii) a hybrid approach as a combination of (i) and (ii), which considers both similarities from the users and contexts of a visualisation, as well as the historical rating of a visualisation method (Mutlu et al., Citation2016).
This research focuses on the hybrid approach for the personalised visualisation recommendation by formulating the problem as a recommender system considering both responses and covariates. Specifically, the recommendation score in a visualisation recommender system is modelled as a compound response of (i) collaborative information that quantifies the implicit similarities among users' ratings over tasks and visualisation methods, and (ii) content-based information that quantifies the explicit similarities represented by covariates (i.e., user input logs and task attributes). It is commonly assumed that the implicit similarities can be represented by a latent low-rank matrix, and the relation between covariates and the content-based response can be modelled by a linear regression term. For example, Chen et al. (Citation2020) developed a Personalised Recommender system for Information visualisation Methods via Extended matrix completion (PRIME) for the recommendation of optimal visualisation methods catering to users' characteristics and contexts.
The development of such a recommender system relies on the collection of training data including users' and tasks' information as covariates, and the users' ratings on tasks as the response. Here we assume there is no learning effect for users conducting tasks in order. However, the collection of training data by the user study is often an expensive process in terms of time and cost. A good offline experimental design is therefore desired to optimise the user-task allocation to collect data efficiently and effectively for the user study. With a limited budget on the number of experiments, it is crucial to design an optimal user-task allocation such that the collected training data is highly informative for constructing a recommender system.
The objective of this work is to create an optimal experimental design, i.e., an optimal user-task allocation, to enhance the recommendation accuracy of a visualisation recommender system. Here we focus on constructing experimental designs to collect the initial training data set offline from user studies. To this end, the offline Design of Experiments (DoE) are commonly used for similar design problems. For example, optimal designs, based on some optimality criteria, have been applied in collaborative filtering methods to evaluate a new item on existing users (Anava et al., Citation2015). Another design criterion, space-filling design criterion, is commonly adopted in computer simulations with design points evenly spread over the experiment region (Joseph, Citation2016). For the matrix completion as techniques for recommender systems, space-filling designs were applied as an initial design strategy to sample the initial observed entries for accurate recovery of the low-rank matrix (Mak & Xie, Citation2017). However, these design methods either focus on the implicit similarities in the low-rank response matrix or the explicit similarities in the covariates. Hence, they may not work well in the visualisation recommender system due to the lack of joint consideration for both types of similarities.
To overcome the aforementioned challenges, we propose a prediction-oriented optimal design to collect an informative training data set for the visualisation recommender system through jointly considering the collaborative information (implicit similarity) and content-based information (explicit similarity). As both types of similarities are important for the visualisation recommendation, the proposed optimal design can efficiently enhance the performance of the recommender system. The key idea of the proposed design is to first explore the overall design space to find the candidate design region to recover the low-rank matrix by space-filling design criterion, and then exploit this candidate design region by the optimality criterion such that the selected design achieves superior prediction accuracy over all candidate designs. The contributions of the proposed method are in two folds. First, a constrained optimality criterion is proposed to balance the optimal design for both the low-rank matrix response and the linear response decomposed from the recommendation score. This lays a foundation of initial training data sampling for the recommender system with a limited number of experiments. Second, an efficient design construction algorithm is proposed to find the optimal design to achieve the high recommendation accuracy over user and context space in the practical application.
The remainder of this paper is organised as follows. Section 2 provides a literature review. Section 3 gives a brief introduction to the PRIME model and then details the proposed prediction-oriented optimal design. Section 4 evaluates the performance of the proposed method by a numerical study. Section 5 validates the proposed design via a real case study of the visualisation recommender system. We conclude this work with some discussions in Section 6.
2. Literature review
In this section, we review existing recommender systems with a focus on visualisation recommendation, and experimental design methods for recommender systems.
2.1. Recommender systems and applications in visualisations
Recommender systems have become ubiquitous in e-commerce to generate customised recommendations for users (Ricci et al., Citation2015). In the context of visualisation recommendation, a visualisation recommender system aims to provide accurate suggestions of visualisation methods for users given specific contexts. Existing methods for visualisation recommender systems broadly fall into three categories: (i) content-based filtering; (ii) collaborative filtering; and (iii) hybrid filtering (Jones et al., Citation2015; Vartak et al., Citation2017).
The content-based filtering matches the attributes of users' profiles with those of items. Hence, visualisation recommender systems built by content-based filtering predict the recommendation score based on the covariates of users and contexts (Mutlu et al., Citation2016). However, the content-based filtering cannot provide satisfactory performance when limited information is available from the covariates. In contrast, collaborative filtering-based recommender systems suggest items based on the implicit similarity of a group of users on a set of items among the historical users' ratings. With a small sample size, the implicit similarity is usually modelled by a low-rank matrix with random Gaussian noise, and thus formulated as a matrix completion problem (Candès & Recht, Citation2009). But the collaborative filtering approach suffers from the so-called the cold-start problem (Schein et al., Citation2002). The cold-start problem in the context of visualisation recommendation refers to providing recommendations for new users or visualisation tasks without historical responses available, where the pure collaborative filtering cannot provide good results (Melville & Sindhwani, Citation2010; Schein et al., Citation2002). Therefore, a hybrid filtering method considering both explicit and implicit similarities is desired to leverage the advantages of both methods. For example, Mutlu et al. (Citation2016) developed VizRec as a hybrid visualisation recommender system considering the information of both the recommendation context and score via a weighted combination. However, the ambiguity of weights limits its practical application. In PRIME (Chen et al., Citation2020), the recommendation score is formulated as the compound response of two kinds of similarities, i.e., a low-rank matrix and a covariate-based linear regression term. In this work, we adopt PRIME, a more generic hybrid approach, as the underlying model for the visualisation recommender system.
2.2. Experimental designs for recommender systems
In the literature, few works focussed on offline experiment designs for recommender systems to collect informative training data under limited resources (e.g., limited runs, limited budget for user study, limited time). Most of the existing methods fall into the offline experimental design, including optimal designs and space-filling designs. The optimal designs belong to a class of experimental designs with respect to some statistical criteria (Pukelsheim, Citation2006). Several prediction-oriented criteria have been developed in the optimal design literature, including I-optimality criterion for minimising the average variance in prediction over the entire design space (Box & Draper, Citation1959), G-optimality criterion for minimising the maximum variance of the estimation across the design space (Kiefer & Wolfowitz, Citation1959), and V-optimality criterion for minimising the integrated variance over the region of interest within the design space (Laake, Citation1975). In terms of their related application to recommender systems, Anava et al. (Citation2015) formulated the cold-start problem in collaborative filtering as a model-based optimal design to minimise the prediction error based on A-optimality criterion. However, their method only considers the optimality of the linear interaction between users and items captured by the latent factor model. Bhat et al. (Citation2020) adopted optimal design for the offline user-treatment allocation problem in A/B testing under the linear relationship between the observed covariates of treatments and their impact on users. Similarly, this design only considers the explicit similarities represented by covariates. Thus, these methods may not work well for the visualisation recommendation due to their lack of joint consideration of both important similarities.
Another DoE strategy that has been adopted in related experimental design problems in recommender systems is the space-filling design (Joseph, Citation2016; Santner et al., Citation2003). Intuitively, such a design is suitable for enhancing the prediction accuracy over the design region with deterministic response since the prediction error can be considered as a function of its location relative to the design point. There is no direct application of this design criterion to recommender systems. As a related work, the idea of space-filling design criterion has been adopted by Mak and Xie (Citation2017) for an active matrix completion problem, which actively selects the entries to be observed to recover the low-rank matrix (Chakraborty et al., Citation2013; Ruchansky et al., Citation2015). Their study validated the effectiveness of the balanced property in the initial design (see the detail in Section 3), and as a design with balanced property, the space-filling design was thus adopted as the initial sampling strategy in the proposed active sampling scheme. Although the use of space-filling designs can enhance the estimation of low-rank matrix, it may not work well for the recommender system when the content-based information (i.e., linear response) is dominant in users' ratings and the number of runs of experiments is small. Moreover, without an accurate predictive model obtained by an initial training data set, it is difficult for the active sampling strategy to quantify the information of the entry to be observed on the matrix. Thus, the online schema does not fit the offline design problem. Except active matrix sampling, there is few work focussing on the offline design of optimal observation allocation for matrix completion in the context of recommendation problems.
In summary, there is limited research on the experimental design for offline initial training of recommender systems. The proposed method could be a pioneer work on the optimal experimental design, i.e., user-task allocation, for the user study of visualisation recommender systems catering to both implicit and explicit similarities.
3. The proposed prediction-oriented optimal design
As discussed in Section 2, an offline prediction-oriented optimal design criterion is desired to consider both low-rank matrix estimation and the linear estimation in order to enhance the recommendation performance over the user and context space. In this section, we first formulate the user-task allocation in the user study as an optimal design problem. Then we detail the prediction-oriented optimal design and the design construction algorithm.
3.1. Problem setup
Suppose that is the response matrix, where U is the number of users and T is the number of tasks. That is,
is the response to be obtained when the ith user is assigned to complete the jth task. The value of
represents the recommendation score (e.g., user's rating, preference score, cognitive workload). Denote the whole indices of the response matrix
as
which contains UT design points. The user-task allocation is to select an appropriate size-S subset
such that experimenters can assign users to complete the selected tasks to obtain the responses. Specifically, we define the design indicator variable
as
(1)
(1) Then the response entry
will be collected by conducting the corresponding experiment with
. The user-task allocation is to select
.
Denote to be a p-dimensional covariate vector (e.g., users' input logs, task's information) associated with the ith user and the jth task, which is observable before conducting the experiment. Thus, the whole set of covariate vectors can be written as
with each row being
. Note that
is a column vector. Here we assume
to be available before designing the experiment since they are gathered from the candidate users and candidate tasks. To prevent one user from conducting one task for multiple times, we do not consider the repetition in the design. Table illustrates an example of one possible design.
Table 1. Illustration of one possible design: the coloured rows represent the selected runs.
As an experimental design problem, instead of optimising the level of factors (i.e., the value of ), here our goal is to select the optimal design runs (i.e.,
) according to the covariates such that the obtained experimental outcomes can be used to accurately predict the full response matrix
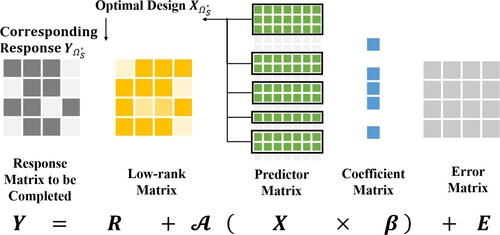
. Clearly, such an optimal design will depend on the model in use for quantifying the relationship between the covariates and the response. Here we consider the PRIME model based on matrix completion with the consideration of covariates information:
(2)
(2) where
is an error matrix with
,
is the low-rank matrix modelling the implicit similarity,
are the linear regression coefficients quantifying the explicit similarity among covariates
. Here
is a linear mapping operator from
to
.
3.2. The proposed optimal design criterion
As a user-task allocation problem, the optimal design is to choose S optimal design runs from the candidate of UT design points, with the aim to enable optimal prediction accuracy for the PRIME model. Denote to be a matrix of indicators with
as elements. In the setting of visualisation recommendation, we propose the prediction-oriented optimal design formulation as:
(3a)
(3a)
(3b)
(3b)
(3c)
(3c)
(3d)
(3d) The solution of
corresponds to the indices
of the selected design points in the optimal design space
. In the proposed design criterion, the objective function in (Equation3
(3a)
(3a) ) is a V-optimality criterion over the selected design points (Crary et al., Citation1992). The constraints in (Equation3
(3a)
(3a) ) are to pursue the space-filling characteristics on the selected design of size S. The proposed formulation takes both the low-rank matrix estimation and the linear estimation into consideration through the optimality objective and space-filling constraints.
Specifically, the PRIME model at selected design points can be expressed as
(4)
(4) where
is the element of the unknown low-rank matrix
. When
is given, it is easy to show that the model in (Equation4
(4)
(4) ) is a linear model, of which the V-optimal criterion (Crary et al., Citation1992) can be expressed as:
(5)
(5) where
and
represents the region of interest. Here
is a probability measure as a weighting for different regions of inputs, which can be specified based on the selection of the region of interest and the available information about covariates. Note that when one chooses
, it is improper to select the uniform distribution for the probability measure since it will lead to a constant objective function, resulting in a randomly selected space-filling design. It should be noticed that the objective of the original V-optimality is to minimise the average prediction variance over the region of interest
. The PRIME model is distinguished from the linear regression due to the unknown term
. The alternating direction method of multiplier (ADMM) was utilised to solve the PRIME model (Chen et al., Citation2020), in which the low-rank
and regression parameters
are iteratively estimated. Here we adopt the use of V-optimality criterion for constructing designs for the recommender system, which is new to the literature.
Regarding the region of interest , we adopted the choice to make
, under the consideration of the optimisation objective function and constraints. The constraints (Equation3c
(3c)
(3c) ) and (Equation3d
(3d)
(3d) ) pose space-filling characteristics to one feasible design
, which implies that the selected design points in
could enhance the estimation of low-rank matrix. Therefore, we apply V-optimality to
to further improve the estimation of the linear term. Moreover, since the region of interest with a larger size will be more informative when we want to optimise the estimation variance with a limited number of runs available, we will select all points in
as
instead of a subset of
.
It should be noticed that the region of interest can be selected among the whole experiment space Ω, which does not necessarily need to be the same as the selected design space
. Hence, with
, the V-optimal criterion in (Equation5
(5)
(5) ) becomes (Equation3a
(3a)
(3a) ) in the proposed design criterion.
With the V-optimality as the objective function in (Equation3(3a)
(3a) ), we further impose some constraints to enhance the prediction accuracy with respect to the low-rank matrix
. Specifically, we consider the constraints in (Equation3c
(3c)
(3c) ) and (Equation3d
(3d)
(3d) ) for a space-filling and balanced design. That is, we constrain the number of entries in each row (i.e., observed responses for each user) to be similar and the number of entries in each column (i.e., observed responses for each task) to be similar. Thus, the constraints in (Equation3d
(3d)
(3d) ) balance the number of selected experiments among users and the constraints in (Equation3c
(3c)
(3c) ) balance the number of selected experiments among tasks. It was proven that sampling an entry in every row and column (i.e., the balance property) improves low-rank matrix completion (Mak & Xie, Citation2017).
We would like to remark that the proposed design criterion in (Equation3(3a)
(3a) ) is a constrained V-optimality with the balanced constraints on the number of entries in the rows and columns of the observed response matrix. It was discussed by Mak and Xie (Citation2017) that when all row and column spaces are equally likely, all the observed response matrices with balanced characteristics yield the same performance on average in recovering
from the perspective of the expected information gain. Meanwhile, the objective of V-optimality criterion is to enhance the prediction from the perspective of minimising the average prediction variance over
in terms of
.
3.3. Design construction algorithm
Note that the V-optimality criterion in (Equation3(3a)
(3a) ) itself is NP-hard. Here we consider an efficient practical construction algorithm to obtain the optimal design. Specifically, a multi-step optimisation procedure is proposed as the construction algorithm. The key idea is to effectively seek and reduce the feasible region by the constraints so that the objective function can be optimised efficiently. In Step 1, a candidate pool is generated with designs feasible to the size constraint (Equation3b
(3b)
(3b) ). The candidate pool should be sufficiently large to support a wide searching space for space-filling designs. Denote the searching size of the candidate pool as K (i.e., to generate K candidate designs in the pool). In Step 2, we apply (Equation3c
(3c)
(3c) ) and (Equation3d
(3d)
(3d) ) as a screening step to keep the designs satisfying the balance constraints in the candidate pool. Denote the space-filling filter as
, where
if a design
satisfies the space-filling constraints (Equation3c
(3c)
(3c) ) and (Equation3d
(3d)
(3d) ). In Step 3, the objective of V-optimality criterion is optimised within the reduced candidate design pool efficiently through calculating and sorting the V-optimality criterion value. The design with the smallest V-optimality criterion value will be selected as the optimal design
. A pseudo-code of the algorithm is reported in Algorithm 1.
For Algorithm 1, the searching size K typically should be set large enough to find enough space-filling designs. In order to construct a larger candidate design set , an alternative approach is to find the feasible solutions to constraints (Equation3b
(3b)
(3b) ), (Equation3c
(3c)
(3c) ) and (Equation3d
(3d)
(3d) ) by the interior point method or directly by off-the-shelf solvers (e.g., CPLEX, Gurobi).
4. Numerical simulation
4.1. Simulation setting
In this section, we evaluate the performance of the proposed optimal design through several simulated data sets. For each run of experiment, suppose that the underlying PRIME model is used to generate the response, where
;
,
,
are the
th elements of
,
and
, respectively. Here
. The covariates
are independently and identically generated from a multivariate normal distribution
, where the covariance matrix
with
follows the simulation setup in Deng and Jin (Citation2015). In this simulation study, we set the dimension of covariates p = 12, the number of users and tasks U = T = 10, and
, where ρ controls the correlation among covariates. Given the covariates
, we choose a multivariate Gaussian distribution for the weighting function
. That is,
, where
and
are the mean vector and covariance matrix to be estimated from
. Specifically, we use the sample mean and sample covariance matrix as the estimates. Other covariance matrix estimation methods (Deng & Tsui, Citation2013; Kang & Deng, Citation2020) can also be adopted here. With all
design points, the searching size K in Algorithm 1 is set to be 10,000, which works well empirically to balance the optimality and computation speed. Figure shows a graphical representation of the proposed optimal design with PRIME as the underlying model.
Figure 1. A graphical representation of the proposed optimal design with PRIME as the underlying model.
Based on the setting of the covariates, we consider different scenarios to generate the simulation data by varying the number of runs of experiment S, the sparsity level of , the low-rank structure of
, and the relative significance of implicit and explicit similarities (i.e., magnitude ratio) of
over
. Since the maximal number of runs of experiments is
, we vary S in two levels:
, such that the cost for 60% and 40% experiment runs can be saved, respectively. For the explicit similarity modelled by a linear term
in PRIME model, the sparsity is defined as the percentage of zero elements in
. We consider the sparsity with two levels
with the zero elements in
independently and identically from a normal distribution
. Here
is randomly generated from a Bernouli distribution
for each scenario.
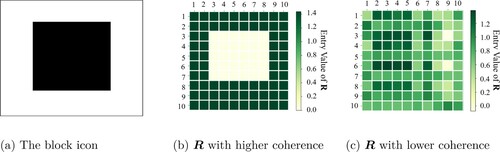
To generate with a low-rank structure, we set the rank q = 2 in all scenarios and consider the following two approaches based on coherence. Here, coherence measures the extent to which the singular vectors of a matrix are correlated with the standard basis, which can characterise the ability to extract information from a small subset of columns (Mohri & Talwalkar, Citation2011). The first method generates
from a block icon (see Figure (a)) to mimic the low-rank structure used in tensor regressions (Zhou et al., Citation2013). The second method generates
with rank q by the product of two base matrices:
, where
and
are two randomly generated matrices. Note that the first method provides a higher coherence (Donoho et al., Citation2005) for
, which is easier to recover given the same number of observations. Examples of the generated
from the two methods are presented in Figure (b,c), respectively.
Figure 2. (a) The block icon used to generate with higher coherence; (b) The value of entries in
generated by the block icon; (c) The value of entries in
generated by
.
The magnitude ratio indicates the dominant type of similarity in the response , which is denoted as mr. We select mr with two levels
following the simulation setup in Chen et al. (Citation2020). The ratio is controlled through rescaling the elements in
so that the value of the (i, j)th element in the rescaled
is:
. Note that all the low rank matrices
mentioned later have been rescaled in their generation process.
To examine the performance of the proposed method, we evaluate the recommendation accuracy for the PRIME model with the training data specified by the optimal design and the corresponding observed response matrix
. The Root-Mean-Square Error (RMSE) over the non-allocated entries (i.e., empty entries) in
predicted by PRIME model is adopted as the performance measure. The performance of the proposed optimal design is systematically evaluated for (
) evaluating the performance of V-optimality criterion as the objective Function (Equation3a
(3a)
(3a) ) over other optimal design criteria with the same set of space-filling constraints, (
) evaluating the performance of the space-filling Constraints (Equation3c
(3c)
(3c) ), (Equation3d
(3d)
(3d) ) over the same set of unconstrained optimality criteria, and (
) comparing the performance of the proposed optimal design (Equation3
(3a)
(3a) ) with randomly generated designs.
Here I-optimality (Box & Draper, Citation1959) and G-optimality criteria (Kiefer & Wolfowitz, Citation1959), both of which are related to the model prediction accuracy, are adopted as benchmarks to compare with the selected V-optimality criterion for the objective function (Equation3(3a)
(3a) ). The I-optimality is to minimise the average variance of prediction over the entire experiment region Ω. Given a design
with its corresponding indicator variable
, the I-optimality value can be computed as:
(6)
(6) The G-optimality aims at minimising the maximum variance of the predicted values, which gives the G-optimality value for design
as:
(7)
(7) Based on the benchmark criteria, four variants of the proposed optimal design method will be evaluated from the aforementioned three perspectives, which results in 12 constructions of optimal designs for each simulation scenario. Specifically, taking V-optimality criterion as the objective function (Equation3
(3a)
(3a) ), for each simulation scenario, the four variants include:
| V-Opt-SF: | the design optimal to the proposed V-optimality criterion with space-filling constraints (denoted as Opt-SF in Table ); | ||||
| V-Opt: | the design optimal to V-optimality criterion without considering space-filling constraints (denoted as Opt); | ||||
| V-SF: | one design randomly selected from the candidate pool of K designs which satisfies the space-filling constraints (denoted as SF), where K is the searching size in Algorithm 1; | ||||
| V-Random: | one design randomly selected from the candidate pool of K designs (denoted as Random). | ||||
Table 2. The average RMSEs for recommendation accuracy in simulation study.
Similarly, we can define I-Opt-SF to I-Random with respect to I-optimality criterion and G-Opt-SF to G-Random with respect to G-optimality criterion for each simulation scenario. Note that the V-Opt-SF method is the proposed optimal design. It should also be mentioned that the construction methods for (-SF) designs in each scenario are the same which do not need to consider the optimality criterion, thus can be viewed as three replicates. Same for the (-Random) designs.
4.2. Simulation results
Table summarises the RMSEs as the recommendation performance metric in 16 simulation scenarios. Overall, it can be observed that the proposed method (i.e., Opt-SF with V-optimality criterion) gives consistently better performance over benchmark criteria and variants by comparing the RMSEs when run size S = 60. However, for the scenarios when run size S = 40, the proposed method does not consistently outperform the benchmark methods, which could be due to the limited sample size. Xu (Citation2018)'s study on noisy matrix completion showed that is the tight lower bound for the number of entries to be observed to obtain a unique solution for the matrix completion for
with its rank
. With rank q = 2 to generate
in the simulation, S = 64 is the theoretical least number of entries to be observed to successfully recover the low-rank structure. It implies that, when S = 40, it is theoretically difficult to complete the low-rank matrix
in PRIME, especially when the linear regression coefficients
should also be estimated.
Regarding to the performance evaluation , it can be observed that the proposed V-optimality criterion with space-filling constraints (V-Opt-SF) outperforms I-Opt-SF and G-Opt-SF in most (i.e., 12 out of 16) scenarios by comparing RMSEs within Opt-SF columns in Table . For
, it is seen that the use of space-filling constraints significantly enhances the recommendation accuracy by comparing RMSEs between V-Opt-SF and V-Opt for 15 out of 16 scenarios. In terms of performance evaluation
, the proposed V-Opt-SF presents its superior performance in all scenarios in comparison with V-Random. The advantage of the proposed prediction-oriented optimal design method V-Opt-SF demonstrated from all three evaluation perspectives can be attributed to the integration of V-optimality criterion and space-filling constraints. This integration effectively balances the enhancement in estimating linear regression coefficients from V-optimality criterion and the enhancement in estimating low-rank matrix from space-filling constraints.
This simulation study also demonstrates the inferior performance of adopting I- and G-optimality criteria as the objective function in (Equation3(3a)
(3a) ). For example, I-optimality criterion does not perform well compared to another two criteria by investigating Opt-SF columns in Table . Another disadvantage of I-optimality criterion is the increasing computation burden caused by the integral over the entire design space (Equation6
(6)
(6) ). In terms of G-optimality criterion, with a small run size (i.e., S = 40), it leads to the design with better prediction accuracy when
is generated by the block icon and the significance of implicit similarity is higher (i.e., mr = 0.5). Since G-optimality criterion aims at optimising the worst estimation variance, it could provide a robust design against overfitting and other possible worse cases with a small observation and an underlying
with lower coherence. Correspondingly, when
is generated by the base matrices, the designs with the optimal I-optimality criterion value perform better without considering the space-filling constraints. A possible explanation can be that, due to the small run size and high coherence on
, directly optimising the overall estimation variance will lead to better overall estimation. As mentioned above, the three criteria are all related to prediction accuracy with similar expression. Therefore, it is not realistic for one optimality criterion to dominate all scenarios.
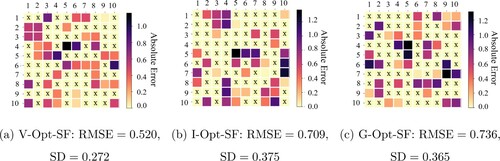
The advantage of V- over I- and G-optimality criteria can also be demonstrated by investigating the prediction errors for each entry of in PRIME model. Figures and present the absolute error of each entry
in V-Opt-SF, I-Opt-SF, and G-Opt-SF designs with run size
, where the optimal design points are marked with ‘X’. It can be observed that the prediction errors in the proposed V-Opt-SF design are more evenly distributed compared to the other two optimality criteria, which indicates its robustness in terms of the recommendation accuracy for all potential users and tasks.
Figure 3. Absolute value of prediction error of Opt-SF designs with generated by block, Sparsity
, mr = 0.1, annotated with RMSE and its Standard Deviation (SD). (a) V-Opt-SF:
,
. (b) I-Opt-SF:
,
and (c) G-Opt-SF:
,
.
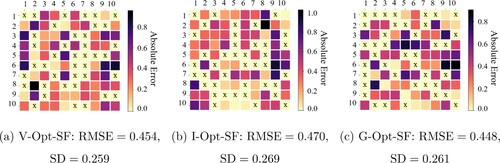
Figure 4. Absolute value of prediction error of Opt-SF designs with S = 60, generated by block, Sparsity
, mr = 0.1, annotated with RMSE and its Standard Deviation (SD). (a) V-Opt-SF:
,
. (b) I-Opt-SF:
,
and (c) G-Opt-SF:
,
.
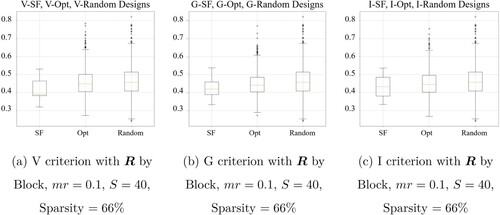
Furthermore, the advantage of space-filling constraints can be clearly demonstrated by comparing the performance of the designs with (i.e., SF) and without (i.e., Opt and Random) space-filling constraints. Figure shows the box plots of RMSEs by adopting SF designs, Opt designs and Random designs. Note that the SF designs represented by the box plots are generated from the candidate K designs in Algorithm 1 which satisfy the space-filling constraints. Correspondingly, we picked 500 designs with top-ranked criterion value for Opt designs. Similarly, 500 designs are randomly picked from the candidate pool of K designs for Random designs. In Figure , the box plots for SF designs have a narrow range with much fewer ourliers than those for Opt and Random designs. It implies the robustness provided by the space-filling constraints. The plausible explanation is that these space-filling constraints are effective in restricting the feasible region for design generation to prevent PRIME from making extreme predictions that directly lead to low recommendation accuracy.
Figure 5. Box plots of the RMSE of SF designs, Opt designs and Random designs. (a) V criterion with by Block, mr = 0.1, S = 40, Sparsity
. (b) G criterion with
by Block, mr = 0.1, S = 40, Sparsity
and (c) I criterion with
by Block, mr = 0.1, S = 40, Sparsity
.
4.3. An approximate sampling algorithm for scalability
The proposed design construction algorithm (Algorithm 1) is suitable for the small-scale user study in visualisation recommendation. However, in applications with large size of users and tasks, the searching size K should be set large enough to ensure the optimality, which can cause high computation workload. To address this challenge of scalability, we develop an approximate sampling algorithm as an alternative for an efficient implementation.
Firstly, we consider an approximation solution for the proposed optimal design criterion (Equation3(3a)
(3a) ) which relaxes the decision variable
to be continuous (i.e.,
) and relaxes the size constraints accordingly (Boyd et al., Citation2004). Denote
as the relative frequency of the
th design. The relaxed problem can be expressed as follows:
(8a)
(8a)
(8b)
(8b)
(8c)
(8c)
(8d)
(8d) In this way, the solution
can be viewed as the sampling probability where
is the probability of sampling the
th design point. Also, we have
. Secondly, we sample from the obtained distribution for M = 1000 times to get 1000 candidate designs. Finally, the design with the smallest V-optimality criterion value will be selected as the selected design
.
We applied this approximate sampling algorithm to all simulation scenarios and summarised the corresponding results in Table . We evaluated the recommendation accuracy for the PRIME model as well as the computational efficiency of the proposed algorithm and the approximate sampling algorithm. The continuous constrained optimisation problem (Equation8(8a)
(8a) ) is solved numerically by Nelder-Mead method (Nelder & Mead, Citation1965). From the results in the table, although the designs obtained by the approximate sampling (V-Approximate Sampling) are not as good as those obtained by the proposed algorithm (V-Opt-SF) in 12 out of 16 scenarios, it is seen than the performance of the V-Approximate Sampling is generally better than those of Opt, SF and Random in Table . Moreover, the approximate sampling algorithm achieves higher computational efficiency when comparing the computational time of these two methods in Table .
Table 3. The average RMSEs for recommendation accuracy and the corresponding computational time in simulation.
We further investigated the performance of the approximate sampling method using the relaxed formulation in (Equation8(8a)
(8a) ). Figure demonstrates the optimal design obtained by the proposed algorithm (V-Opt-SF) with run size
, where the optimal design points are marked with ‘X’ and the colour shows the value of each entry
obtained from the relaxed problem (Equation8
(8a)
(8a) ). The covariates
for these two scenarios are the same, which causes similar patterns in the heatmaps. It can be shown that in general the V-Opt-SF design points are allocated to entities
with higher value, which indicates the proposed Algorithm 1 and the approximate sampling algorithm optimise the design in a similar way. The slightly inferior performance of the V-Approximate Sampling designs might be caused by the existence of multiple local optimums in the optimisation process of problem (Equation8
(8a)
(8a) ), which indicates that the final solution can be easily affected by the choice of the starting point.
Figure 6. The optimal designs obtained by the proposed algorithm (V-Opt-SF) with different run size S and the corresponding value obtained from the relaxed problem (Equation8
(8a)
(8a) ).
![Figure 6. The optimal designs obtained by the proposed algorithm (V-Opt-SF) with different run size S and the corresponding zi,j∗ value obtained from the relaxed problem (Equation8(8a) minztr{[∑i=1U∑j=1Tλi,jxi,jxi,jTf(xi,j)]×(∑i=1U∑j=1Tλi,jxi,jxi,jT)−1}(8a) ).](/cms/asset/adbaa731-32a6-4fc7-bbce-c02222f1f8b8/tstf_a_1905376_f0006_oc.jpg)
In a short summary, the approximate sampling algorithm can be an efficient solution with less computation workload, and it can be easily extended to large-scale scenarios. To further improve the computational efficiency, one can consider a tractable convex programme formulation such as the second-order conic program (SOCP) (Sagnol & Harman, Citation2015) for the V-optimal criterion in (Equation8(8a)
(8a) ).
5. Case study
In this section, we demonstrate the merits of the proposed optimal design to support data collection in a user study for the visualisation recommender system PRIME. We refer Chen and Jin (Citation2017) for the details of the visualisation evaluation study. In this study, three interactive visualisation methods (i.e., static node-link tree, collapsible node-link tree, and zoomable layout) were evaluated for 14 participants performing 11 pre-defined visual searching tasks (Chen et al., Citation2020). Here we only focus on the visualisation method of static node-link tree as shown in Figure , and we target at making accurate predictions on recommendation scores for user i performing task j with this visualisation method.
Figure 7. The visualisation method of static node-link tree, where hierarchical relationships between names were reflected by the node links.
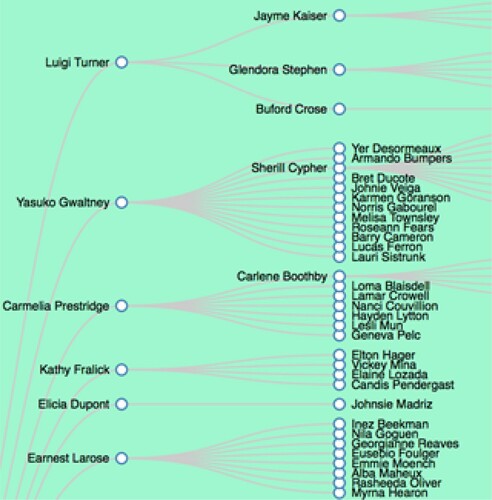
For the 11 tasks, their contents are about searching for the required information from a hierarchical data set with simple calculations. The 11 tasks can be classified into three types: (1) finding the nodes with target names; (2) finding the parent nodes of those with target names; (3) counting the number of children nodes of those with target names. The difficulty of the tasks can be divided into three levels, which directly result in different responses (i.e., perceived task difficulty rated by participants). These information will be utilised to generate covariates characterising each task. After performing the assigned tasks, the participants would rate the complexity of the performed tasks, which would form the response matrix representing the users' evaluation on the task complexity.
To develop the recommender system for visualisation tasks, covariates characterising the tasks and users are collected for the estimation of explicit similarity. Covariates
are mainly generated by the descriptive information related to users and tasks (i.e., gender, age, major information of the users, and the type, difficulty level of the tasks) so that they can be observed before conducting the experiments. The multivariate Gaussian distribution is adopted for the weight function
for each design point, which is similar as the setting in the simulation study. Same to the setting in the simulation section, the PRIME is adopted as the underlying model for the visualisation recommender system. In Chen et al. (Citation2020), the data of all 14 users performing all 11 tasks have been collected, which is helpful for us to evaluate the performance of the proposed design. When an optimal design is used to form the training data for the PRIME model, we still consider the Root-Mean-Square Error (RMSE) over the non-allocated entries (i.e., empty entries) in
predicted by PRIME model as the performance measure. We evaluated the proposed optimal design criterion on different numbers of runs of experiments. With total
(U = 14, T = 11) design points, the number of runs of experiments S is set as five levels
with a focus on smaller run size. For each size of runs of experiments, four designs will be evaluated on their prediction RMSE: (1) the proposed optimal design (Opt-SF); (2) the design optimal to the criterion without considering space-filling constraints (Opt); (3) one randomly selected space-filling design (SF); (4) one randomly generated design (Random). Here, K is also selected as
.
Table summarises the performance of all designs with different levels of run size, where the results in bold represent the best design with the highest recommendation accuracy in each run size. In general, the proposed optimal design achieves the best performance in four out of five scenarios, especially when the run size is small. With its high computational efficiency of V-optimality criterion, the proposed method establishes the superiority by its efficiency and robustness in practical applications. It is also seen that the designs achieving the optimality criterion with space-filling constraints (Opt-SF), perform better than the designs only considering the optamility (Opt) or the designs only considering the space-filling constraints (SF). Besides, the advantage of random space-filling designs over random designs demonstrates the effectiveness of imposing space-filling constraints. It can also be shown that the uncertainty of the recommendation accuracy rapidly increases when the run size is quite limited (i.e., 60/154). In such scenarios, the data collected by a randomly generated design will lead to very low recommendation accuracy (e.g., RMSE=2.117). A recommender system developed by such less informative data may not be able to provide trustworthy recommendations for new users, which could imply the necessity and importance of a prediction-oriented optimal design. In a short summary, the case study for visualisation method recommendation shows that the proposed optimal design can be efficiently and effectively adopted in practice to enable informative data collection and the development of an accurate recommender system with limited experiments.
Table 4. The RMSE recommendation accuracy in the case study.
6. Discussion
This work studies the optimal design problem for the visualisation recommender system. A V-optimality design criterion with space-filling constraints are integrated to form the proposed prediction-oriented optimal design criterion. The proposed optimal design jointly considers the low-rank property of the deterministic collaborative information and the content-based information with linear response. By constructing the proposed optimal design to collect informative data with limited runs of experiments, the resultant recommender system can achieve high recommendation accuracy over the possible users and contexts.
It is worth remarking that the proposed design strategy can be applied to other recommender systems with limited resources to collect the training data. For example, it can be adopted to the visualisation system based on augmented reality (AR) for worker's training and guidance in manufacturing processes (Chen et al., Citation2016). The proposed design can also be extended to support recommender systems in other fields with abundant covariates information of the tasks and users to be matched, such as personalised knowledge discovery (Vozniuk et al., Citation2016).
Note that in this work, the users' rating scores are used as the response in the proposed design for the recommender system. However, the ranking information can be more effective in suggesting the top-ranked visualisation methods to users. In this case, the pairwise loss can be adopted instead of the prediction error in the underlying model to provide pairwise comparisons of visualisation methods (Chen & Jin, Citation2018, Citation2020). Then the objective of the proposed optimal design criterion (Equation3a(3a)
(3a) ) can be modified accordingly to reduce the average variance in the ranking prediction, thus enhancing the accuracy of ranking recommendation. Besides, although we selected the selected design space
as the region of interest
based on the space-filling constraints and the objective function, further investigation is expected to find the optimal region of interest with theoretical support. Moreover, the proposed method is suitable for a small-size user study in visualisation recommendation. However, in practical scenarios with large size of users and tasks, a screening step is useful to select the users from a large user pool to conduct the user study. Various sampling strategies such as cluster sampling and stratified sampling can be used for the screening step before the proposed optimal design (Sharma, Citation2017). The ethical consideration such as the fairness for the screening process is also of great importance in practice.
There are several future research directions. First, the proposed method can be extended to optimal A/B testing to support the recommendation of the optimal visualisation method for a user given a task. Second, visualisation methods will be parameterised based on the characteristics (i.e., layout parameters, colour coding, etc.) to generate a continuous design space. Thus, more effective and efficient optimal design methods can be investigated based on the continuous design space to improve the recommendation performance for visualisation methods. Third, in practical applications, besides the observable covariates such as survey results and users' input logs, unobservable covariates are usually available, which can only be collected during the experiments (e.g., wearable sensor signals). Including unobservable covariates to better quantify the explicit similarity will enhance the performance of the recommender system, which can be considered by online optimal design methods. Besides, after conducting offline experiments, an online active sampling method can be investigated to adaptively enhance the performance of the recommender system. In the online sampling, the ensemble modelling method (Jin & Deng, Citation2015) can be utilised to ensemble the online schema with the initial offline design criterion.
Disclosure statement
No potential conflict of interest was reported by the author(s).
Additional information
Notes on contributors
Yingyan Zeng
Yingyan Zeng is a Ph.D. candidate in the Grado Department of Industrial and Systems Engineering at Virginia Tech. She received a B.E. degree from Shanghai Jiao Tong University, China in 2019. She is working as graduate research assistant and teaching assistant at Virginia Tech. Her research focused on data analytics and statistical modeling in smart manufacturing systems. Ms. Zeng is a member of INFORMS.
Xinwei Deng
Dr. Xinwei Deng is an associate professor in the department of statistics at Virginia Tech. His research interests include machine learning, design of experiment, and interface between experimental design and machine learning.
Xiaoyu Chen
Xiaoyu Chen is a Ph.D. candidate in the Grado Department of Industrial and Systems Engineering at Virginia Tech. He received a B.E. degree from School of Optoelectronics at Beijing Institute of Technology, China in 2015. He previously worked as Research assistant and Grado teaching assistant at Virginia Tech. His research focused on human-AI collaboration and Fog-Cloud computing in smart manufacturing systems. Mr. Chen is a member of INFORMS, IISE, and IEEE. His awards and honors include Doctoral Student of the Year in the Grado Department of Industrial and Systems Engineering at Virginia Tech, 2019.
Ran Jin
Dr. Ran Jin is an Associate Professor and the Director of Laboratory of Data Science and Visualization at the Grado Department of Industrial and Systems Engineering at Virginia Tech. He received his Ph.D. degree in Industrial Engineering from Georgia Tech, Atlanta, his Master's degrees in Industrial Engineering, and in Statistics, both from the University of Michigan, Ann Arbor, and his bachelor's degree in Electronic Engineering from Tsinghua University, Beijing. His research focuses on supervised learning and computation services in smart manufacturing and cognitive-based interactive visualization. His research includes lightweight middleware design in Industrial Internet, machine learning pipelines and deep neural networks in manufacturing, data fusion modeling for variation analysis, monitoring, prognosis, and virtual inspection, and Augmented Reality and web-based manufacturing visualization systems design. His research has been used by many manufacturing companies in additive manufacturing, thermal spray coating, broaching, semiconductor, printed electronics, optical and continuous fiber manufacturing industries. Dr. Jin is currently serving as an Associate Editor for IISE Transactions (Design and Manufacturing), Associate Editor for ASME Journal of Manufacturing Science and Engineering, and Associate Editor for INFORMS Journal on Data Science. For more information about Dr. Jin, please visit his faculty website at Virginia Tech: https://ise.vt.edu/ran-jin.
References
- Anava, O., Golan, S., Golbandi, N., Karnin, Z., Lempel, R., Rokhlenko, O., & Somekh, O. (2015). Budget-constrained item cold-start handling in collaborative filtering recommenders via optimal design. In Proceedings of the 24th international conference on world wide web (pp. 45–54). Florence, Italy: International World Wide Web Conferences Steering Committee.
- Bednarik, R., Vrzakova, H., & Hradis, M. (2012). What do you want to do next: A novel approach for intent prediction in gaze-based interaction. In Proceedings of the symposium on eye tracking research and applications (pp. 83–90). Association for Computing Machinery.
- Bhat, N., Farias, V. F., Moallemi, C. C., & Sinha, D. (2020). Near-optimal AB testing. Management Science, 66(10), 4477–4495. https://doi.org/10.1287/mnsc.2019.3424
- Bogdanov, D., Haro, M., Fuhrmann, F., Xambó, A., Gómez, E., & Herrera, P. (2013). Semantic audio content-based music recommendation and visualization based on user preference examples. Information Processing & Management, 49(1), 13–33. https://doi.org/10.1016/j.ipm.2012.06.004
- Box, G. E., & Draper, N. R. (1959). A basis for the selection of a response surface design. Journal of the American Statistical Association, 54(287), 622–654. https://doi.org/10.1080/01621459.1959.10501525
- Boyd, S., Boyd, S. P., & Vandenberghe, L. (2004). Convex optimization. Cambridge University Press.
- Candès, E. J., & Recht, B. (2009). Exact matrix completion via convex optimization. Foundations of Computational Mathematics, 9(6), 717. https://doi.org/10.1007/s10208-009-9045-5
- Chakraborty, S., Zhou, J., Balasubramanian, V., Panchanathan, S., Davidson, I., & Ye, J. (2013). Active matrix completion. In 2013 IEEE 13th international conference on data mining (pp. 81–90). IEEE.
- Chen, X., & Jin, R. (2017). Statistical modeling for visualization evaluation through data fusion. Applied Ergonomics, 65, 551–561. https://doi.org/10.1016/j.apergo.2016.12.016
- Chen, X., & Jin, R. (2018). Data fusion pipelines for autonomous smart manufacturing. In 2018 IEEE 14th international conference on automation science and engineering (CASE) (pp. 1203–1208). IEEE.
- Chen, X., & Jin, R. (2020). AdaPipe: A recommender system for adaptive computation pipelines in cyber-manufacturing computation services. IEEE Transactions on Industrial Informatics, 1–1. https://doi.org/10.1109/TII.2020.3035524
- Chen, X., Lau, N., & Jin, R. (2020). PRIME: A personalized recommendation for information visualization methods via extended matrix completion. ACM Transactions on Interactive Intelligent Systems, 11(1), 1–30. https://doi.org/10.1145/3366484
- Chen, X., Sun, H., & Jin, R. (2016). Variation analysis and visualization of manufacturing processes via augmented reality. In Presented at the IISE annual conference. Proceedings. IISE.
- Crary, S. B., Hoo, L., & Tennenhouse, M. (1992). I-optimality algorithm and implementation. In Computational statistics (pp. 209–214). Springer.
- Deng, X., & Jin, R. (2015). QQ models: Joint modeling for quantitative and qualitative quality responses in manufacturing systems. Technometrics, 57(3), 320–331. https://doi.org/10.1080/00401706.2015.1029079
- Deng, X., & Tsui, K. W. (2013). Penalized covariance matrix estimation using a matrix-logarithm transformation. Journal of Computational and Graphical Statistics, 22(2), 494–512. https://doi.org/10.1080/10618600.2012.715556
- Donoho, D. L., Elad, M., & Temlyakov, V. N. (2005). Stable recovery of sparse overcomplete representations in the presence of noise. IEEE Transactions on Information Theory, 52(1), 6–18. https://doi.org/10.1109/TIT.2005.860430
- Jin, R., & Deng, X. (2015). Ensemble modeling for data fusion in manufacturing process scale-up. IIE Transactions, 47(3), 203–214. https://doi.org/10.1080/0740817X.2014.916580
- Jones, B., Silvestrini, R. T., Montgomery, D. C., & Steinberg, D. M. (2015). Bridge designs for modeling systems with low noise. Technometrics, 57(2), 155–163. https://doi.org/10.1080/00401706.2014.923788
- Joseph, V. R. (2016). Space-filling designs for computer experiments: A review. Quality Engineering, 28(1), 28–35. https://doi.org/10.1080/08982112.2015.1100447
- Kang, X., & Deng, X. (2020). On variable ordination of Cholesky-based estimation for a sparse covariance matrix. Canadian Journal of Statistics. https://doi.org/10.1002/cjs.11564
- Kiefer, J., & Wolfowitz, J. (1959). Optimum designs in regression problems. The Annals of Mathematical Statistics, 30(2), 271–294. https://doi.org/10.1214/aoms/1177706252
- Kunkel, J., Loepp, B., & Ziegler, J. (2017). A 3D item space visualization for presenting and manipulating user preferences in collaborative filtering. In Proceedings of the 22nd international conference on intelligent user interfaces (pp. 3–15). Association for Computing Machinery.
- Laake, P. (1975). On the optimal allocation of observations in experiments with mixtures. Scandinavian Journal of Statistics, 2, 153–157. https://www.jstor.org/stable/4615596
- Mak, S., & Xie, Y. (2017). Active matrix completion with uncertainty quantification. Preprint. arXiv:1706.08037.
- Melville, P., & Sindhwani, V. (2010). Recommender systems. Encyclopedia of Machine Learning, 1, 829–838.
- Mohri, M., & Talwalkar, A. (2011). Can matrix coherence be efficiently and accurately estimated? In Proceedings of the fourteenth international conference on artificial intelligence and statistics (pp. 534–542). JMLR Workshop and Conference Proceedings.
- Mutlu, B., Veas, E., & Trattner, C. (2016). Vizrec: Recommending personalized visualizations. ACM Transactions on Interactive Intelligent Systems, 6(4), 1–39. https://doi.org/10.1145/2983923
- Nelder, J. A., & Mead, R. (1965). A simplex method for function minimization. The Computer Journal, 7(4), 308–313. https://doi.org/10.1093/comjnl/7.4.308
- Pukelsheim, F. (2006). Optimal design of experiments. SIAM.
- Ricci, F., Rokach, L., & Shapira, B. (2015). Recommender systems: Introduction and challenges. In Recommender systems handbook (pp. 1–34). Springer.
- Ruchansky, N., Crovella, M., & Terzi, E. (2015). Matrix completion with queries. In Proceedings of the 21th ACM SIGKDD international conference on knowledge discovery and data mining (pp. 1025–1034). Association for Computing Machinery.
- Sagnol, G., & Harman, R. (2015). Computing exact d-optimal designs by mixed integer second-order cone programming. Annals of Statistics, 43(5), 2198–2224. https://doi.org/10.1214/15-AOS1339
- Santner, T. J., Williams, B. J., Notz, W. I., & Williams, B. J. (2003). The design and analysis of computer experiments (Vol. Springer.
- Schein, A. I., Popescul, A., Ungar, L. H., & Pennock, D. M. (2002). Methods and metrics for cold-start recommendations. In Proceedings of the 25th annual international ACM SIGIR conference on research and development in information retrieval (pp. 253–260). Association for Computing Machinery.
- Sharma, G. (2017). Pros and cons of different sampling techniques. International Journal of Applied Research, 3(7), 749–752.
- Spence, R. (2001). Information visualization (Vol. Springer.
- Vartak, M., Huang, S., Siddiqui, T., Madden, S., & Parameswaran, A. (2017). Towards visualization recommendation systems. ACM SIGMOD Record, 45(4), 34–39. https://doi.org/10.1145/3092931.3092937
- Voigt, M., Pietschmann, S., Grammel, L., & Meißner, K. (2012). Context-aware recommendation of visualization components. In The fourth international conference on information, process, and knowledge management (EKNOW) (pp. 101–109). IARIA XPS Press.
- Vozniuk, A., Rodriguez Triana, M. J., Holzer, A. C., & Gillet, D. (2016). Combining content analytics and activity tracking to identify user interests and enable knowledge discovery. In 6th international workshop on personalization approaches in learning environments (PALE). ACM.
- Xu, Z. (2018). The minimal measurement number for low-rank matrix recovery. Applied and Computational Harmonic Analysis, 44(2), 497–508. https://doi.org/10.1016/j.acha.2017.01.005
- Zhou, H., Li, L., & Zhu, H. (2013). Tensor regression with applications in neuroimaging data analysis. Journal of the American Statistical Association, 108(502), 540–552. https://doi.org/10.1080/01621459.2013.776499