
 ?Mathematical formulae have been encoded as MathML and are displayed in this HTML version using MathJax in order to improve their display. Uncheck the box to turn MathJax off. This feature requires Javascript. Click on a formula to zoom.
Abstract
In this paper, we investigate the COVID-19 pandemic in Canada and evaluate the Canadian government policies on controlling COVID-19 outbreaks. The first case of COVID-19 was reported in Ontario on 25 January 2020. Since then, there have been over million cases by now. During this time period, the federal, provincial and local governments have implemented regulations and policies in order to control the pandemic. To evaluate these government policies, which may be done by analysing the infection rate, infection period and reproductive number of COVID-19, we approach the problem by introducing an extended susceptible-exposed-infectious-removed (SEIR) model and conduct the model inference by using the iterated filter ensemble adjustment Kalman filter (IF-EAKF) algorithm. We first divide the time period into phases according to the policy intensities in each province by segmenting the time period from 4 March 2020 to 31 October 2020 into three time phases: the exploding phase, the strict policy implementation phase, and the provincial reopening phase. We then use IF-EAKF algorithm to obtain the estimates of the model parameters. We show that the infection rate in the second phase is lower than that in both first and third phases. We also discuss the number of new COVID-19 cases under different policy intensities and different policy durations in the third wave of the pandemic.
1. Introduction
The first case of the novel coronavirus (COVID-19) was detected at the end of 2019 (Rodríguez-Morales et al., Citation2020), and since then, the disease has rapidly spread worldwide. The World Health Organization (WHO) declared COVID-19 as a pandemic disease involving all walks of life, and called on all countries to take urgent measures to respond to the pandemic on 11 March 2020. Correspondingly, various countries have taken various measures to control its spread (Jüni et al., Citation2020; Mossa-Basha et al., Citation2020; Zambrano-Monserrate et al., Citation2020).
In Canada, the first COVID-19 case was reported on 25 January 2020, while all provinces had documented cases by March 2020. Q. Li et al. (Citation2020) and Kucharski et al. (Citation2020) noted that the transmission rate of COVID-19 was very high, and their studies showed that if no policy was taken, the situation would have been serious (Ciuriak, Citation2020; Karaivanov et al., Citation2020). To control the spread of COVID-19, all provinces of Canada declared a state of emergency before mid-March 2020 and implemented a series of policies to limit its spread including travel bans, required social distancing and school closures, which were highly effective (Deo & Grover, Citation2021; Lai et al., Citation2020; Prem et al., Citation2020). Gu et al. (Citation2020) evaluated effectiveness of the control measures on the pandemic in 25 countries and obtained the reproductive number , the number of people on average a patient can infect. However, it did not take into consideration of other important indicators such as the infection rate in the model.
Some researchers have used infectious disease models for measuring disease transmission. R. Li et al. (Citation2020) divided infected people into two categories according to whether or not his or her infection was documented, i.e., confirmed. In fact, the infected individuals were documented only if their symptoms were severe enough to be confirmed, while the infected individuals were undocumented if they had mild symptoms or no symptoms at all. They used the iterated filter ensemble adjustment Kalman filter (IF-EAKF) framework (Anderson, Citation2001) to obtain prediction of the variables (,
,
and
which are respectively the susceptible population, exposed population, documented infected individuals and undocumented infected individuals at the time t) and estimation of the parameters (β, μ, Z, α, θ and D which are respectively the transmission rate of documented infected individuals, attenuation in the transmission rate of undocumented infected individuals, the average latent period, the fraction of infections that are documented, the travel multiplicative factor and the average duration of the infection). Even though they obtained time-dependent parameter estimates, they used their average instead since their parameters were assumed to be constant over time. In fact, many things have happened during the pandemic, and hence the parameters might take different values at different times. For example, due to the policy changes through the pandemic, the parameter values might be dependent on what policies were currently in effect.
The policy implementation has affected people's behaviours such as the frequency of going to public places, which can be seen by using Google community mobility. The community mobility reports trends across different categories of places such as retail and recreation, groceries and pharmacies, parks, transit stations, workplaces and residential. By To et al. (Citation2020), Xie and Zhu (Citation2020) among others, temperature also had an impact on the spread of the pandemic. Thus, in this paper, we present a qualitative analysis on the relationship among temperature, Google community mobility and . Note that when a province was in the strict policy implementation phase, the values of the community mobility data were small and the daily
was also relatively low. We remark that in fact the temperature was high in this phase.
In this paper, we propose to extend the model in R. Li et al. (Citation2020) by allowing the parameters to vary across different time phases. The new model also takes into account the air passenger traffic entering Canada in early 2020 since most of the initial new cases in Canada were imported from abroad. We first divide the COVID-19 pandemic period into three phases in each province: the exploding phase, the strict policy implementation phase and the provincial reopening phase. Here, the exploding phase corresponds to the first outbreak where the COVID-19 cases rapidly shot up; the strict policy implementation phase began when both federal and provincial governments started taking a strong stance on COVID-19 and imposed wide-sweeping policies to address the rapid spread of the pandemic; the provincial reopening phase aligns with the reopening of the provinces and the second COVID-19 outbreak over summer. Then, we apply IF-EAKF to obtain the parameter estimates for each province under study.
The provincial governments have implemented various policies in the third wave of the pandemic. It is important to predict the impact of different policy intensities on controlling the third COVID-19 outbreak. We will use the proposed model to forecast the new COVID-19 cases in each of the four Canadian provinces: Ontario, Quebec, Alberta and British Columbia from March 2021 (the values of the model parameters are set to be proportional to the parameter estimates obtained in the second phase, i.e., strict policy implementation phase, with different ratios corresponding to different policy intensities). Compared with some other prediction methods (Chimmula & Zhang, Citation2020; Peng et al., Citation2020; Xu & Tang, Citation2021) such as the varying coefficient susceptible-infected-removal (vSIR) model and long short-term memory (LSTM) network model, our method takes into account the impact of policies. Note that for different policy intensities, the peak times of COVID-19 cases are different. Here, we take Ontario as an example. We find out that if only of the policy intensity of the strict implementation phase would be implemented, the new COVID-19 cases would be very large. However, if
of the policy intensity of the strict implementation phase would be implemented, the new COVID-19 cases would be expected to decline in May.
The paper is arranged as follows. In Section 2, we describe the proposed methodology. In Section 3, we present the data analysis. We conclude the paper in Section 4.
2. Methodology
The Canadian government of various levels has implemented regulations and policies at different intensities at various phases during the pandemic. For convenient presentation, a government policy below refers to an non-pharmaceutical intervention on COVID-19 including travel bans, school closures, gathering restrictions and mask mandates, etc. in Canada throughout the rest of this paper.
A susceptible-exposed-infectious-removed (SEIR) model was used in R. Li et al. (Citation2020). Before we extend it for analysing the spread of COVID-19 under different policy intensities, we first define the following notations:
: the susceptible population on day t;
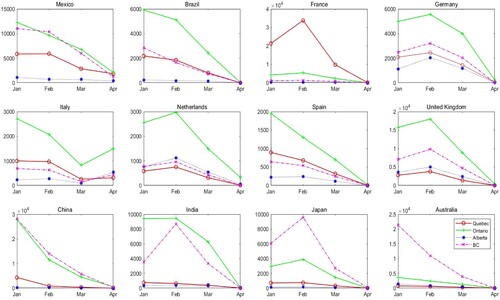
We also consider imported cases from other countries, and incorporate air passenger traffic data into our model. We account for air passenger traffic data from the 13 countries including the United States whom Canada has the most air traffic with. From the air passenger traffic data displayed in Figure , it can be observed that the number of people entering Canada had a sharp drop from March 2020 to April 2020, which was related to the domestic travel ban started in March 2020. In our paper, we assume that the imported cases from abroad became exposed in Canada and some were documented infected or undocumented infected, and those confirmed infected individuals would remain in the same provinces.
Figure 1. The number of people who came to the four Canadian provinces by air from January 2020 to April 2020. The sign 'o' is for Quebec, the sign '+' is for Ontario, the sign '*' is for Alberta and the sign '×' is for British Columbia.
We are now ready to introduce the extended SEIR model as follows:
(1)
(1) where
is the imported cases from the other 13 countries on day t,
is the reported cases in the country j on day t,
is all infected cases reported in the country j (Tian et al., Citation2020), and
is the air passenger traffic data from the country j to a Canadian province on day t, in which the province index is suppressed as the extended SEIR model is only applied to the data within each province. For convenience, we still call this model as a SEIR model. Note that the SEIR model in R. Li et al. (Citation2020) incorporated the spatial interaction by the daily number of people travelling from city j to city i (
). We simplify the model by only considering the impact of the influx from overseas, because at the early stage of the outbreak of COVID-19, the cases imported from overseas have a great impact on the spread of the epidemic.
We regard ,
, in the SEIR model as the latent vector, where t may be suppressed for a simple presentation. Denote the documented COVID-19 cases on day t by
and denote
by
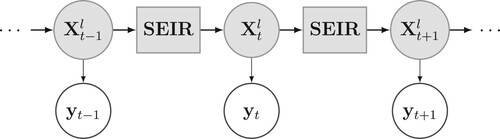
. We conduct the model inference by using IF-EAKF algorithm (see the supplementary materials of R. Li et al. Citation2020), an efficient EAKF algorithm proposed in Anderson (Citation2001). In light of R. Li et al. (Citation2020), we assume that
has mean
and variance
, where
denotes the infected new cases on the day t. Similar to IF-EAKF algorithm given in the supplementary materials of R. Li et al. (Citation2020), the initial value of
is the population of a province, the initial value of
is from a uniform distribution [0,10], the initial value of
is from a uniform distribution [5,10], the initial value of
is from a uniform distribution [0,10], and initial values of
are uniformly taken such that
,
,
,
,
, and
in the first iteration. The ranges of the initial prior for the parameters are chosen to cover their most possible values in light of R. Li et al. (Citation2020), which have little effect on the estimation of the parameters. At the mth iteration, we first generate 300 initial ensemble state members from the multivariate normal distribution with mean vector
and covariance matrix
, where
is the sample mean of the 300 ensemble state members of
from the
th iteration, Σ is a diagonal matrix such that its ith diagonal element is equal to
,
,
,
, and 0<c<1 is the discount factor of the given covariance matrix Σ. As in R. Li et al. (Citation2020), we have
, where
and
, in which
denotes the lth ensemble member at time t−1, and
means the output variable
obtained from the SEIR model with the input
at time t−1. We then update its lth ensemble member by using the observation
with the formula of Gaussian convolution as follows:
(2)
(2) where
as in R. Li et al. (Citation2020). Following R. Li et al. (Citation2020), other elements in
are updated through their covariability with the observed variable, which can be computed directly from the ensemble. For example, consider
in
, whose lth ensemble member can be updated by
(3)
(3) where
,
and
is the sample covariance between
and
. A flowchart of EAKF is shown in Figure . The details of the EAKF used to estimate
in the first phase are shown in Algorithm 1. The algorithms for the second and third phases are the same.
Figure 2. A flowchart of EAKF.
3. Results and analysis
3.1. Data set
The Canadian COVID-19 pandemic data and the air passenger traffic data used in this paper are respectively obtained from Berry et al. (Citation2021) and Statistic Canada (Citation2020). We collect daily new COVID-19 cases in ten provinces of Canada (Ontario, Quebec, British Columbia, Alberta, Manitoba, Nova Scotia, New Brunswick, Saskatchewan, Newfoundland and Labrador and Prince Edward Island) from 4 March 2020 to 4 February 2021. Since the confirmed cases in Prince Edward Island were very small, we only consider COVID-19 cases in the other nine provinces in this paper.
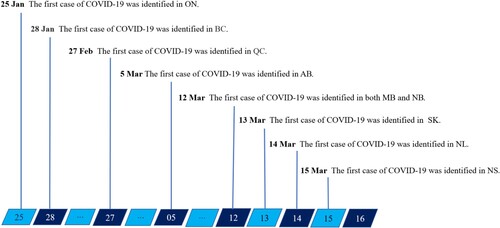
Although Canada had the first documented COVID-19 case in Ontario on 25 January 2020, there was almost no COVID-19 case in each of the other eight provinces before March 2020. Therefore, we only consider daily new COVID-19 cases starting from early March 2020. Figure displays when the first COVID-19 case was documented in each of these nine provinces.
Figure 3. The time of the first documented COVID-19 case in each of the nine provinces: Ontario (ON), Quebec (QC), Alberta (AB), British Columbia (BC), Manitoba (MB), New Brunswick (NB), Saskatchewan (SK), Nova Scotia (NS), Newfoundland and Labrador (NL).
As the air passenger traffic data could also have an effect on the spread of the pandemic, we also consider air passenger traffic data from January 2020 to April 2020, especially the number of non-residents travellers from various countries entering Canada. Because there are too many countries that have mobility with Canada, we only take into consideration of the country where the amount of air passenger traffic data was more than 2000 and we thus reduce the number of countries to 13. We also collect the key policies (e.g., travel ban, school closures, gathering restrictions, and mandatory use of mask or face covering) of various provinces in Canada for controlling the pandemic. Since October 2020, the policies were different in different districts of a province. We thus only consider them from 4 March 2020 to 31 October 2020.
3.2. Analysis and prediction
First, we use IF-EAKF to fit the number of new cases each day from nine provinces of Canada. The parameter estimates change dynamically in the fitting by the Kalman filter, so the fittings in terms of SEIR model are also dynamic. The fitting results for the nine provinces are displayed in Figure , which shows that the fitting results are very good. Hence, the extended model can be used for forecasting.
Figure 4. The fitting graph of the number of new cases per day in nine provinces, where the true number and the fitted values are plotted respectively in solid and dashed lines.
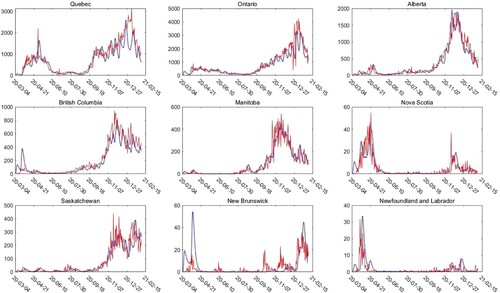
It can be observed that there are downward trends in all nine graphs in Figure , which demonstrate that the measures taken by each of the nine provincial governments had played important roles in stemming the spread of the pandemic. Note that the state of emergency began in each of the nine provinces around mid-March 2020, followed by travel bans, school closures, etc. To evaluate the effects of different important policy intensities during the pandemic, following Karaivanov et al. (Citation2020), we assign the numerical values to the four policy intensities: travel ban, school closures, gathering restrictions and mandatory use of mask or face covering. The travel ban is set to be accompanied by international and inter-provincial travel restrictions. The value is 1 if only the citizens and residents of a province were allowed to enter this province for international travel restrictions. The same is true for inter-provincial travel restrictions. Similarly, for the school closures, 1 stands for no classes, and 0 stands for classes in session. For the gathering regulations, 1 means the strictest restrictions, that is, very limited outdoor gathering, and 0 means no or little restrictions. For the mandatory use of mask or face covering policy, 1 requires people to wear a mask in indoor and public places, while 0 means it is not mandatory. Figure displays the numerical value of these policy implementation intensities in each of the six provinces in Canada from 4 March 2020 to 31 October 2020. The closer the value is to 1, the stricter the policy implemented.
Figure 5. The numerical values of the four policy intensities in six provinces in Canada over time.
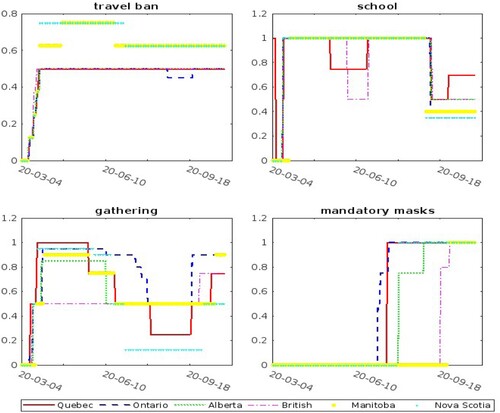
As can be seen from Figure , the travel ban of each province had been maintained at a strict level since it was implemented in mid-March 2020. Regarding the policy of mandatory use of mask or face covering, each province had no such requirements at the beginning of the pandemic, and the government mandated that people wore masks indoor in early July 2020. Many schools had been closed from March 2020. However, schools began to reopen in September 2020, which may be related to the outbreak of the pandemic in many local schools during the second outbreak. In the implementation of the gathering restriction policy, the number of people gathering outside was restricted at the beginning of the outbreak in each province, and then each provincial government relaxed the restrictions on gathering in June 2020. The provinces started the recovery plan from April 2020, and strengthened policy intensities in the second wave of the pandemic in September 2020.
In order to study the policy intensities on controlling the pandemic, we divide the time period ( 4 March 2020 to 31 October 2020) into three phases: the exploding phase, the strict policy implementation phase and the provincial reopening phase. The first period is an exploding period, and the government began to make and implement some policies for controlling the pandemic slowly. The second period is the strict policy implementation period. In the third period, provinces reopened and the number of new cases increased gradually. The time segmentations of each province and the parameter estimates are given in Table .
Table 1. The model parameter estimates of the six provinces – Quebec, Ontario, British Columbia, Alberta, Manitoba and Nova Scotia at three different phases.
Figure 6. The reproductive number , temperature and Google mobility data over time. The shaded part corresponds to the reproductive number, while the temperatures and Google mobility data are plotted respectively in red dashed line and blue solid line.
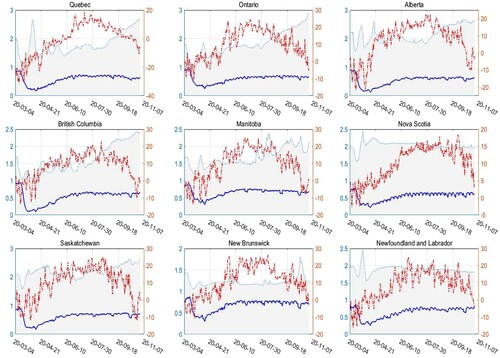
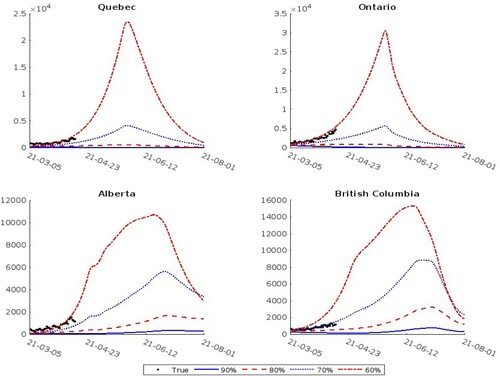
Figure 7. The predicted number of new cases in the four provinces with policy intensity lasting 80 days, 70 days, 60 days and 50 days, respectively.
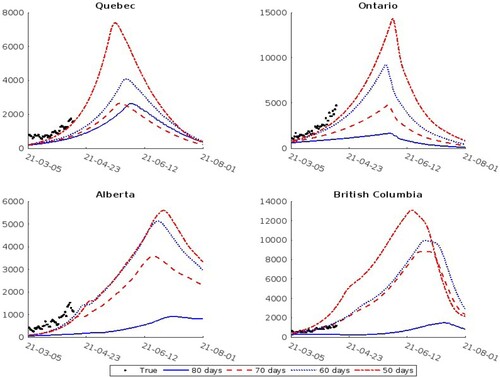
Figure 8. The predicted number of new cases in the four provinces with ,
,
and
of the policy intensity for 70 days, respectively.
We use the province of Quebec to explain how the above three phases are decided. The government of Quebec declared a public health emergency on 14 March 2020. And in April, it announced that health measures de-escalation and regional travel restrictions would be lifted. However, the number of confirmed cases rose again in August, and the government announced a regional alert in September 2020. For this province, the three time periods are 4 March 2020 to 23 April 2020, 24 April 2020 to 3 August 2020 and 4 August 2020 to 31 October 2020. During the first period, the number of cases increased rapidly. The infection rate β was 0.8318. Due to the government's emergency measures including the limitation of large parties, closure of some public places and improved public health awareness of COVID-19 in the second period, β reduced to 0.3697. In the third period, some restrictions were relaxed with the reopening of the province, but large parties were still banned and people were advised to wear masks. The pandemic rebounded and the number of confirmed cases increased rapidly. β reached 0.9378 during this period. Similarly, for other provinces, we also obtain three time periods. It can also be seen that the documented cases accounted for an increasing proportion of all cases over time. In Quebec, α increased from 0.2247 in the first period to 0.8072 in the third period, which also indicates that the government attached great importance on controlling COVID-19 and improved technology for detecting more infected individuals.
To examine the spread ability of COVID-19 in different time periods, we introduce reproductive number .
means the number of people on average a patient can infect. The relationship between
and the parameters in the SEIR model is:
. Considering the factors such as the policies on controlling the pandemic and temperature that may affect the
, we present a qualitative analysis on the relationship between
, temperature and the Google mobility data. The relationship between them can be seen in Figure . From this figure, it can be seen that
in Quebec, Ontario and Alberta were at a high level in the first wave of the pandemic. Meanwhile, the temperature was low. Because of the travel bans and gathering restrictions, the Google mobility data had small values in the first wave of COVID-19. Afterward, the reproductive number
remained stable. With the second wave of the pandemic in September 2020,
increased gradually. At the same time, the temperature was still low, and due to the gradual relaxation of travel bans and gathering restrictions, people's mobility also increased slowly, which was contributed to the rise of the reproductive number
.
In the following, we use the parameter estimates of the SEIR model, obtained via IF-EAKF, to predict the number of new cases in the four provinces, i.e., Ontario, Quebec, Alberta and British Columbia in 150 days from March 2021, in which the pandemic broke out in the third wave of Canada. Two scenarios are considered in the prediction part. The first one is to obtain the number of cases in different days with the same policy implementation intensity. The second one is to obtain the number of cases in the same number of days with different policy intensities.
Many provinces began to implement gathering restrictions again from March 2021 to combat a third wave, but this time the provincial policy intensities were not as high as those in the first two waves of the pandemic. Therefore, we set the parameter values used for prediction proportional to the parameter estimates in the strict policy implementation phase with different ratios corresponding to different policy intensities (e.g., infection rate corresponding to of the policy intensities defines as estimated infection rate in phase 2 divide
). Figure displays the predicted number of new cases in each of the four provinces in the first scenario. For Quebec and Ontario, the same policy intensity with different days (50, 60, 70, 80 days) would have resulted in different peak times that would be close to each other, and the number of new cases would decline in May. For Alberta and British Columbia, if
of the policy intensity of the strict implementation phase would be implemented for 60 days, the number of new cases would be expected to decline in June. Figure displays the second scenario of the prediction. The lines represent
,
,
and
of the policy intensity of the strict implementation phase for 70 days in each province, respectively. In this scenario, the policy intensities are different, and the peak number of new cases is also different. For each province, the tighter the policy is implemented, the peak number of new cases is lower relatively. We can see that if only
of the policy intensity of the strict implementation phase would be implemented in a province, the increase in the number of new cases would be very large in that province. Therefore, policy intensities should be strengthened in the third wave of outbreaks. Various measures implemented by the provincial governments to control the spread of COVID-19 are very necessary. We give the predicted errors for 39 days in the early stage of third wave of outbreaks in Tables and .
Table 2. The predicted errors in the four provinces with 70 of the policy intensities for different days (80, 70, 60, 50 days).
Table 3. The predicted errors in the four provinces with different policy intensities (90, 80
, 70
, 60
) for 70 days.
4. Discussion
In the article, we use the modified SEIR model to fit the daily new cases of COVID-19 and conduct the model inference by the iterated filter ensemble adjustment Kalman filter algorithm. Considering the great impact on the spread of the epidemic in Canada by the imported cases from oversea in the early stage of the outbreak, we simplify the model in R. Li et al. (Citation2020) only considering the effect of the influx from oversea. According to the policy intensities, we segment the research period as three phases (the exploding phase, the strict policy implementation phase and the provincial reopening phase). After getting the estimated parameters of SEIR model, we analyse the impact of policy intensities qualitatively, showing that the government policies on the pandemic (some non-pharmaceutical interventions on COVID-19: travel bans, school closures, gathering restrictions and mask mandates, etc.) were effective in controlling the spread of COVID-19, which could reduce the infection rate β obviously. Finally, our model can forecast the daily new cases by incorporating different policy intensities.
However, we have not investigated which specific measures have been more effective for controlling COVID-19. By solving this, an intuitive idea is to incorporate the policy intensities as unknown parameter in the SEIR model, and introduce a regression model following Karaivanov et al. (Citation2020). This will be studied in future work. Another interest extension of the model is to consider the spatial interaction, when the research involves not only the early stage of the outbreak and considers the impact of the influx between provinces.
Disclosure statement
No potential conflict of interest was reported by the authors.
Additional information
Funding
References
- Anderson, J. L. (2001). An ensemble adjustment Kalman filter for data assimilation. Monthly Weather Review, 129(12), 2884–2903. https://doi.org/10.1175/1520-0493(2001)129<2884:AEAKFF>2.0.CO;2
- Berry, I., O'Neill, M., Sturrock, S. L., Wright, J. E., Acharya, K., Brankston, G., Harish, V., Kornas, K., Maani, N., Naganathan, T., Obress, L., Rossi, T. M., Simmons, A. E., Van Camp, M., Xie, X. T., Tuite, A. R., Greer, A. L., Fisman, D. N., & Soucy, J. R. (2021). A sub-national real-time epidemiological and vaccination database for the COVID-19 pandemic in Canada. Scientific Data, 8(1), 1–10. https://doi.org/10.1038/s41597-021-00955-2
- Chimmula, V. K. R., & Zhang, L. (2020). Time series forecasting of COVID-19 transmission in Canada using LSTM networks. Chaos, Solitons & Fractals, 135, 109864. https://doi.org/10.1016/j.chaos.2020.109864
- Ciuriak, D. (2020). The policy response to the coronavirus pandemic: Recommendations for Canada. Opinion, Centre for International Governance Innovation.
- Deo, V., & Grover, G. (2021). A new extension of state-space SIR model to account for underreporting – an application to the COVID-19 transmission in California and Florida. Results in Physics, 24, 104182. https://doi.org/10.1016/j.rinp.2021.104182
- Gu, J., Yan, H., Huang, Y., Zhu, Y., Sun, H., Zhang, X., Wang, Y., Qiu, Y., & Chen, S. (2020). Better strategies for containing COVID-19 epidemics – a study of 25 countries via an extended varying coefficient SEIR model. medRxiv.
- Jüni, P., Rothenbühler, M., Bobos, P., Thorpe, K. E., da Costa, B. R., D. N. Fisman, Slutsky, A. S., & Gesink, D. (2020). Impact of climate and public health interventions on the COVID-19 pandemic: A prospective cohort study. CMAJ, 192(21), E566–E573. https://doi.org/10.1503/cmaj.200920
- Karaivanov, A., Lu, S. E., Shigeoka, H., Chen, C., & Pamplona, S. (2020). Face masks, public policies and slowing the spread of COVID-19: Evidence from Canada. Technical report, National Bureau of Economic Research.
- Kucharski, A. J., Russell, T. W., Diamond, C., Liu, Y., Edmunds, J., Funk, S., Eggo, R. M., Sun, F., Jit, M., Munday, J. D., & Davies, N. (2020). Early dynamics of transmission and control of COVID-19: A mathematical modelling study. The Lancet Infectious Diseases, 20(5), 553–558. https://doi.org/10.1016/S1473-3099(20)30144-4
- Lai, S., Ruktanonchai, N. W., Zhou, L., Prosper, O., Luo, W., Floyd, J. R., Wesolowski, A., Santillana, M., Zhang, C., Du, X., & Yu, H. (2020). Effect of non-pharmaceutical interventions to contain COVID-19 in China. Nature, 585(7825), 410–413. https://doi.org/10.1038/s41586-020-2293-x
- Li, Q., Guan, X., Wu, P., Wang, X., Zhou, L., Tong, Y., Ren, R., Leung, K. S., Lau, E. H., Wong, J. Y., & Xing, X. (2020). Early transmission dynamics in Wuhan, China, of novel coronavirus-infected pneumonia. New England Journal of Medicine, 382(13), 1199-1207. https://doi.org/10.1056/NEJMoa2001316
- Li, R., Pei, S., Chen, B., Song, Y., Zhang, T., Yang, W., & Shaman, J. (2020). Substantial undocumented infection facilitates the rapid dissemination of novel coronavirus (SARS-CoV-2). Science (New York, N.Y.), 368(6490), 489–493. https://doi.org/10.1126/science.abb3221
- Mossa-Basha, M., Medverd, J., Linnau, K. F., Lynch, J. B., Wener, M. H., Kicska, G., Staiger, T., & Sahani, D. V. (2020). Policies and guidelines for COVID-19 preparedness: Experiences from the university of Washington. Radiology, 296(2), E26–E31. https://doi.org/10.1148/radiol.2020201326
- Peng, L., Yang, W., Zhang, D., Zhuge, C., & Hong, L. (2020). Epidemic analysis of COVID-19 in China by dynamical modeling. Preprint arXiv:2002.06563.
- Prem, K., Liu, Y., Russell, T. W., Kucharski, A. J., Eggo, R. M., Davies, N., Flasche, S., Clifford, S., Pearson, C. A., Munday, J. D., & Abbott, S. (2020). The effect of control strategies to reduce social mixing on outcomes of the COVID-19 epidemic in Wuhan, China: A modelling study. The Lancet Public Health, 5(5), e261–e270. https://doi.org/10.1016/S2468-2667(20)30073-6
- Rodríguez-Morales, A. J., MacGregor, K., Kanagarajah, S., Patel, D., & Schlagenhauf, P. (2020). Going global – travel and the 2019 novel coronavirus. Travel Medicine and Infectious Disease, 33, 101578. https://doi.org/10.1016/j.tmaid.2020.101578
- Statistic Canada (2020). Non-resident travellers entering Canada. https://www120.statcan.gc.ca/stcsr/en/sr1/srs?q=24100003&fq=stclac%3A2&wb-srch-sub=search
- Tian, H., Liu, Y., Li, Y., Wu, C.-H., Chen, B., Kraemer, M. U., Li, B., Cai, J., Xu, B., Yang, Q., Wang, B., Yang, P., Cui, Y., Song, Y., Zheng, P., Wang, Q., O. N. Bjornstad, Yang, R., Grenfell, B. T., & Dye, C. (2020). An investigation of transmission control measures during the first 50 days of the COVID-19 epidemic in China. Science (New York, N.Y.), 368(6491), 638–642. https://doi.org/10.1126/science.abb6105
- To, T., Zhang, K., Maguire, B., Terebessy, E., Fong, I., Parikh, S., & Zhu, J. (2020). Correlation of ambient temperature and COVID-19 incidence in Canada. Science of the Total Environment, 750, 141484. https://doi.org/10.1016/j.scitotenv.2020.141484
- Xie, J., & Zhu, Y. (2020). Association between ambient temperature and COVID-19 infection in 122 cities from China. Science of the Total Environment, 724, 138201. https://doi.org/10.1016/j.scitotenv.2020.138201
- Xu, J., & Tang, Y. (2021). An integrated epidemic modelling framework for the real-time forecast of COVID-19 outbreaks in current epicentres. Statistical Theory and Related Fields, 5(3), 1–21. https://doi.org/10.1080/24754269.2021.1872131
- Zambrano-Monserrate, M. A., Ruano, M. A., & Sanchez-Alcalde, L. (2020). Indirect effects of COVID-19 on the environment. Science of the Total Environment, 728, 138813. https://doi.org/10.1016/j.scitotenv.2020.138813