
 ?Mathematical formulae have been encoded as MathML and are displayed in this HTML version using MathJax in order to improve their display. Uncheck the box to turn MathJax off. This feature requires Javascript. Click on a formula to zoom.
ABSTRACT
The aim of this research is to determine the commercial and environmental attractivity of solar panels applied to ships. In this case, a 40 m short route ferry is converted to a solar-electric operating in the Strait of Messina. The powering configuration of the ship is modelled, and a simulation is run using MATLAB. Finally, after the results were found, the solar-electric ship’s powering costs and environmental impact using the Life Cycle Assessment method with the help of GaBi, were compared to a fully electric and a diesel alternative. GaBi is a very useful software to perform LCAs as it provides a very large database on various product’s emissions which can be modulated depending on their quantity. The results were encouraging as approximately 400,000 € were saved when using solar panels compared to only electricity and 500,000 € when comparing to diesel. Moreover, an observable reduction in the emissions in the solar-electric alternative. Remarkably, the electricity in the national grid produces a non-negligible impact on the environment. Therefore, any device which produces zero emissions but is powered by electricity coming from the national grid like an electric car is far from being emissions-free. On the other hand, the electricity coming from solar panels is close to being totally green and should all the electricity be coming from them if future advances on this technology are made, then the vehicle can be considered eco-friendly. The numerous advantages of solar panels in short route ferries observed in this research could lead to the replacement of the traditional oil powered ferried creating a huge positive impact on the environment. When looking at the future, some thought should be given the recycling of solar panels in order to stop our impact on the environment.
Introduction
Background
The shipping industry’s priorities have changed throughout the years, passing from increasing the size and power of the vessels throughout the second half of the 20th century to adopting a greener and more efficient approach in recent years. In fact, the efficiency and eco-friendliness of ships has now become the top priority. This can be seen as international maritime regulators are imposing strict standards, such as MARPOL’s Annex VI on NOx (Nitrogen Oxides) and SOx (Sulphur Oxides) emission limits which are the most dangerous gases as they are toxic. In particular, this issue is even more concerning to the marine industry as it accounts for 15% and 4–9% of the global NOx and SOx emissions respectively (Endresen Citation2003) (Eyring et al. Citation2010) (Viana et al. Citation2014). In addition to these toxic gasses, the marine industry is also an important player in CO2 emissions (greenhouse gasses), as it produced 796 million tonnes of CO2 in 2012 corresponding to 2.2% of the global emission (Smith et al. Citation2014). Hence, it is key that these numbers are reduced, which is why many international organisations have set goals to reduce greenhouse gas emissions thus global warming such as the EU which will try to cut the GHG emissions by 80–95% by 2050 compared to 1990 emission levels (European Commission and Günther H. Oettinger, Citation2012). Given these premises, the number of researches aiming to find alternative powering solutions have multiplied exponentially. Indeed, fuel oils are tried to be replaced by electric power which does not produce any emissions. Nevertheless, the first problem, is that there has not been a way to produce electric energy in such quantities to replace fossil fuels and with no impact on the environment. To name a few, the most popular devices to generate clean electricity are, solar panels (solar energy), wind turbines (wind energy), fuel cells (hydrogen or ammonia) and water turbines (hydraulic energy). Moreover, electric energy is very difficult to store, and the quantities needed to power marine vessels are enormous. For this reason, a combined approach of both fuel oil and electric power is being widely experimented nowadays.
Having drawn the wider picture, a particular interest has to be put on a specific field of the marine industry which are ferries and more particularly short route passenger ferries which will be studied in this paper. Even though ferries are not among the largest contributors of carbon emissions in the maritime world, they still produced 1 million tonnes of CO2 and consumed 3.7 million tonnes of fuel in 2012 (Smith et al. Citation2014). Although these numbers are much smaller compared with other categories, it remains quite large as it has to be considered that the deadweight transported (humans) is much lighter than other deadweight like oil or containers which require a larger power. However, since short route passenger ferries do not require huge amounts of power compared to oil tankers for example, it makes it easier to propel the vessel using electricity stored in batteries. When choosing the device used to transform a renewable source into electric power, solar panels come as the preferred option as they can be installed onboard the vessel and thus collect energy while the vessel is in operation without compromising its efficiency (unlike turbines).
When setting the focus on solar powered crafts, there are some vessels which are powered by solar panels, most of them operating in freshwater environments carrying passengers as shown in (Sharma and Kothari Citation2018; Banerjee; Bleicher Citation2013; Gowrisankar; Guellard et al. Citation2013; Kreutzmann Citation2000; Watterson et al. Citation2002; Zapałowicz and Zeńczak Citation2021). Although one of them, the Indian ferry Aditya which is a solar powered ferry, still in function, carrying 75 passengers throughout a distance of 2.5 km taking 15 minutes is a vessel with an operational profile similar to the one studied in this paper. An encouraging fact of the success of this solar panel application is that the vessel has allowed to save more than 100 thousand litres of diesel oil (Sharma and Kothari Citation2018), representing a saving of over 50 thousand USD per year (Gkerekos, Lazakis, and Theotokatos Citation2019).
Table 1. List of notable solar powered vessels
Even though, this is a remarkable achievement, as shown below in the literature review, there has not yet been a ferry which is fully or partly solar powered operating in open sea conditions. This is why in this paper, a ferry using solar panels operating in the Mediterranean Sea will be studied where the benefits compared to a diesel oil powered ferry will be examined.
Literature review
Although solar panels can be found more and more frequently around us in cities or in the countryside, this technology is not yet employed in large scale in what regards the transport industry. As a matter of fact, many articles have been written about solar panels especially on top of buildings. To name one of the many, Eskew and his colleagues, when working on a case study on PV panels on a building’s roof in Bangkok (Thailand) embraced the LCA approach to estimate effects on the environment (John Eskew et al. Citation2018). Nevertheless, some examples of manufactured prototypes can be found especially in the marine industry. The table below groups a pretty complete list of solar powered boats.
After having seen the PV vessels which have really floated on water, there have been an important number of researches which have studied the application of solar panels in the marine industry but not with a real life experiment. As a matter of fact, Yuan and his fellow team mates, have decided to apply solar panels to a Pure Car and Truck Carrier (PCTC) (Yupeng Yuan et al. Citation2018), where the solar panels contributed to the charging of the batteries in parallel with the diesel generator. The team’s results were encouraging even for this project as the solar panels allowed a reduction of 4.02% in fuel consumption and 8.55% in CO2 emissions in a year. Similarly, Qiu et al., also used a PCTC in their case study, more precisely the COSCO TENGFEI where a techno-economic analysis was performed for various routes. Moreover, an approach similar to the first one was adopted by Ghenai and his team but this time the solar panels were fitted to a cruise ship to contribute to the electric load and again encouraging results were found with a reduction of 9.84% in emissions (Chaouki Ghenai, Brdjanin, and Hamid Citation2019). Always in the commercial vessels’ field, Karatug and his team members investigated the benefits of a solar PV system fitted on a Ro-Ro ship (Çağlar Karatuğ and Durmuşoğlu Citation2020). Similarly, to the previous cases, they have noted a considerable reduction in emissions and 7.38% of the fuel requirement is produced by the solar panels. On another note, as seen in Wu et al. research, solar panels are also employed in offshore electricity generation in the form of solar panel arrays off the coast as the Chinese projects mentioned in the article (Yunna Wu, Citation2019). Indeed, the researchers perform a risk assessment of an array of China’s littoral with a resultant risk is medium high thus some risk prevention measures are proposed. Another interesting PV panel application which does not regard vehicles is the project for a seawater reverse osmosis (SWRO) desalination plant powered by solar energy (Delgado-Torres, María Jiménez, and Del Moral Citation2020). Delgado-Torres and his colleagues claim that this type of desalination plant has never been studied before and therefore is a proof of the ongoing research and development concerning the marine application of solar panels.
In addition to studying the marine applications of solar panels, researchers have also focused on the environmental benefits with some using the Life Cycle Assessment (LCA) approach. In the same way, some studies have also been assessing the economic benefits of PV panels. However, few reports include both benefits. Indeed, Glykas et al., have conducted a cost-benefit analysis of solar hybrid power installation on merchant marine vessels resulting in great findings on the payback period and the fuel savings (Alexandros Glykas, Citation2010). Although, the report does not include many details about the environmental impact of the PV panels which could have been assessed using LCA. Moreover, the research does not reflect a real-world scenario as it does not propose a case study. Similarly, Liu and his team, propose a binary energy storage scheme in order to reduce the battery’s ageing due to power fluctuations stemming from the solar panels’ working conditions (Hongda Liu et al. Citation2017). They manage to find a solution which allows to reduce the battery replacement by 24.8 to 35% thus presenting a financial benefit. Again, this research does not include a holistic environmental assessment. In contrast, there are some studies which focus mainly on environmental impacts and technical details excluding the financial point of view. For example, Kobougias and his teammates, have produced an overview of the different technological aspects of the PV systems which are installed onboard marine vessels (Kobougias, Tatakis, and Prousalidis Citation2013). Nevertheless, even if the technical specifications are very detailed, the economic and financial benefits are not mentioned. On the contrary, some researches focus entirely on the economic and financial benefits neglecting the environmental aspect. As a matter of fact, Al Mamun and his team perform a techno-financial analysis on an intelligent-assisting system for a hybrid solar-diesel engine generator powered boat (Mamun et al. Citation2016). The team’s findings focus mainly on the financial feasibility without explaining the environmental benefits. Having said that, there are some studies which include both economic and environmental benefits. To name one of them, Yehia et al., have investigated fuel savings (economic impact) and the pollution cuts (environmental impact) of a solar hybrid power system for a short route ferry in Egypt (Yehia et al. Citation2020). It can be noted, that its aim differs from this report’s aim as the vessel studied is hybrid and therefore not entirely powered by solar energy. Moreover, it does not provide a life cycle assessment to investigate the long-term impacts. After some further research, some studies which used the LCA method appeared. Indeed, even if the scope of the report differs from the current aim, as it does not consider a PV ferry, Salloum et al., performed a life cycle assessment on a floating photovoltaic system in Thailand (Cromratie Clemons et al. Citation2021). Finally, after a thorough literature review, the article which was closest to the current report is the one written by the brilliant Dr. Jeong and his colleagues who performed a life cycle assessment on a solar panel array installed on a short route ferry (Haibin Wang, Jeong, and Zhou Citation2019). Even if the research is very close to the current one, there will be some differences which will make this project worth to be undertaken. Indeed, as a first point, the geographical location is different and therefore it will help to understand if this type of project is feasible in various locations. Moreover, to name another difference, the case ship ferry in report of Jeong et al. is a hybrid unlike the fully electric ferry in this research.
As seen above, there are many applications of solar panels in the marine industry, but many of the researches lack in investigating the holistic environmental impact of the PV panels using the Life Cycle Assessment (LCA) approach. In this research, the LCA approach will be used as it is the most thorough way to determine the eco-friendliness of the project. On the other hand, it will also include a financial and economic review of the project in order to determine the project’s viability. Indeed, a suggested theoretical ticket price has never been proposed before. Finally, as a future independent from fossil fuels is envisioned, a fully solar powered vessel will be studied rather than a hybrid one.
Aim and objectives
The aim of this project is to study the feasibility and both economic and environmental benefits of a solar powered passenger ferry sailing in the Strait of Messina (Italy) compared to an all-electric and a diesel-powered ferry. Indeed, this project is quite important, in the sense that it could mark a significant progress in the development of vessels powered by renewable energy. As per now, this type of vessel can be found mainly under the form of prototypes and a successful outcome could lead to a transformation in the industry which could make the current vessels look obsolete and thus lead to their replacement. Should this be the case, it will result in a large reduction of greenhouse gasses and toxic emissions. Given the current situation, where time is not our side, drastic cuts in gas production are crucial if the Paris agreements on climate change are to be respected. Moreover, it is important to try and be completely independent from non-renewable energies as these are not a viable solution which can last forever. It is important that a big player such as the marine industry modernises itself. In fact, there has been a lot of progress regarding the efficiency, but the core of the technology has not changed in a century. From a social point of view, it is important that the perception of public opinion that regards the marine industry as extremely pollutant. In order to assess if the project is successful, it needs to fulfil an overall aim, namely the viability of a solar powered ferry in the Strait of Messina with the assessment of its environmental and economic impact. The research’s outcome will automatically fulfil its aim by achieving a certain number of measurable objectives.
The first objective regards the current problems and limitations and more generally the current progress of the research in the marine photovoltaic panel field. In order assess it, a literature review was constructed including some examples of solar panels in the marine industry as well as an overview and limitations of the Life Cycle Assessment (LCA) approach. As a result, ways to improve the current research will be proposed. Secondly, so that progress can be made, a step-by-step detailed methodology has been devised. The general objective of the methodology, which will be further investigated below, is to satisfy the overall aim of the project. Thirdly, as the overall aim is quite general, the third objective is to apply the developed methodology to a specific case study, namely a real ferry which would operate in the Strait of Messina. Subsequently, the fourth objective lies in the interpretation and analysis of the findings stemming from the methodology, namely, to discuss whether the research really brings benefits in the real world (is it really more economical and green?). Finally, the fifth objective consists in addressing the eventual future researchers on what were the scientific limitations for this project such as recycling but also highlight which areas of the report show encouraging signs for future research and development.
Methodology
The overall aim of this project is automatically fulfilled by producing an organised solution of the objectives. The detailed way in which every objective is solved is enclosed in the various steps of the programme and methodology. For this project, the solution is divided into four steps (see ).
Figure 1. Flowchart of methodology.
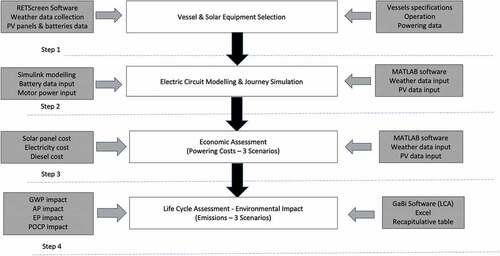
Flowchart
Step 1
The main outcome of this step is to elect the vessel which will be taken for the case study of this project. In order to do so, a large data collection will begin which will include details of various types of existing ferries which could possibly be the candidates for this research. The data which will be collected will try gather as many information as possible regarding the vessel such as the size, the speed, power, etc. The ideal ship would need to have all this information, especially the power requirements already available to view in order not spend time calculating them which would require further simulation. Moreover, the solar panels need to be selected and estimate how many of them can be fitted in the ship. In order to do so, RETScreen is used which is a software specialised in renewable energies which provides both the meteorological and panel data needed for the research. Finally, the batteries need to be selected after undergoing thorough research and calculations of the voltage, energy and rated capacity will need to be performed.
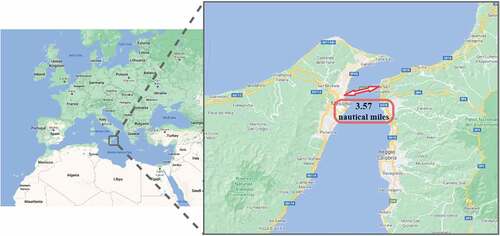
Figure 2. Map of case ship’s journey.
Step 2
The main outcome of this step is to establish the vessel’s performances after its conversion. In order to find these results, the vessel’s powering circuit will be modelled in MATLAB and a simulation of an operating day will be performed. The MATLAB software and more specifically the Simulink package are very useful to model electric circuits as it has a large quantity of ready to use electric systems. It also allows to perform simulations on the created circuits. In this case, PV panels will supply electricity to sets of batteries which will then power the electric motor. The data of solar panels as well as meteorological data from the area of operation taken from RETScreen will be inserted. Moreover, the data concerning the batteries such as the nominal voltage and the rated capacity will also be input during the modelling. In addition, the electric motor’s consumption will be input referring to the data provided by the shipyard at cruising speed. The simulation will give the energy consumed by the motor as well as the energy generated by the panels for different conditions.
Step 3
The main outcome of this step is to establish the commercial attractivity of the project by estimating the powering costs of three powering configurations. After having established the number of solar panels as well as their model and manufacturer in step 2, RETScreen also gives the price of the equipment which needs to be fitted. Moreover, as it will be found that the solar power is not sufficient, the remaining power will be coming from onshore electricity. Therefore, the national cost electricity should be found and adding it to the panel’s cost will give the total powering costs. Moreover, the powering costs will also be estimated for an all-electric configuration, meaning that all the electricity will be coming from shore. Finally, the costs of a diesel alternative will also be calculated given the fuel consumption. A profitable outcome will be key in the development of new projects similar to the latter.
Step 4
The main outcome of this step is to assess the environmental benefits of the solar powered ferry compared to the two other configurations. In order to do so, the Life Cycle Assessment will be performed for the three cases. These LCAs will then be modelled in GaBi which is a very useful software when designing LCAs as it contains a large database of products with all the different energies and emissions required to manufacture the desired quantity of that product. When evaluating the environmental impact, four factors will be considered, namely the Global Warming Potential, the Acidification Potential, the Eutrophication Potential and the Photochemical Ozone Creation Potential. For instance, for the solar panels, no emissions are produced when in operation. However, some pollution arises when manufacturing them and the quantity will be calculated based on other research. Moreover, using GaBi, emissions coming the production of electricity for the national grid are calculated depending on the quantity of electricity needed. In addition, when talking about the diesel-powered vessel, the emissions coming from the production and consumption need to be assessed. For the production of diesel oil, GaBi software is used as the quantity which needs to be produced is inserted and automatically the emissions are calculated. In addition, thanks to other research articles, it was possible to estimate the emissions generated by the consumption of a certain quantity of fuel.
Case ship
Vessel specifications and area of operation
After having done some research and a thorough literature review the case ship chosen is a hybrid RoPax ferry built by Scottish shipyard Ferguson marine normally operating around the Scottish Isles. This vessel is 39.99 m long, 12.2 m wide and has a draught of 1.73 m with a deadweight of 100 t (Ferguson-Marine-Engineering-Limited). The advantage of this vessel is that it was originally hybrid so the conversion to a fully electric solar assisted vessel (solar not providing 100% of the powering requirements) is easier given that the diesel generator will be replaced by battery packs although the electric motors can be kept.
Moreover, another reason why this ship was chosen is because the shipyard already provides the powering requirements for the cruising speed which will be applied to the solar scenario, namely 9 knots. Indeed, the vessel will be sailing at 9 knots for 6 hours a day which will require 267.5 kW daily and an additional 86.5 kW a day to account for the losses and hotel load. In addition, the manoeuvring which takes place 0.6 hours a day will need 120 kW a day which needs to be summed to 32 kW daily used for the hotel load and various losses. Finally, during port operations which account for 3.7 hours a day will consume a daily 72 kW which will be added to 32 kW of losses and hotel load (Ferguson-Marine-Engineering-Limited).
The area where the ferry will operate needs to be changed for meteorological reasons as Scotland does not provide sufficient sunny hours without cloud coverage. Therefore, the new selected location is the Strait of Messina in southern Italy. The geographical choice of the Strait of Messina as the location for the ship’s operation was taken due to many advantageous factors for an eventual solar panel ferry. Firstly, it is a region where sunny weather is very frequent during the day with 2448 hours of sunlight per year representing 56% of daylight hours or the equivalent of 6.42 hours per day (Climatemps, Citation2009–2014) which is one of the highest in Europe. This is an important factor for a solar powered vessel given that the main source of energy is the sun and thus it will not be very efficient in a cloudy or rainy environment such as Glasgow with 1243 hours of sunlight per year or 28.4% of daylight hours (Climatemps, Citation2009–2014). Secondly, the distance of the journey which has to be undertaken is relatively short, namely 3.57 nautical miles which means that the range of the ship does not need to be enormous which is often what causes the most inconveniences in electric powered means of transport. Furthermore, with a cruising speed of 9 knots, the journey can be completed in under 25 minutes (23 mins and 48 secs). Finally, as there is no bridge in the Strait of Messina, almost everything which has to be brought from mainland Italy to Sicily has to be carried on a boat which means that ferries are essential for the circa 10 million people who need to cross the strait every year (10,332,133 pax in 2006) (AUTORITÁ-PORTUALE-DI-MESSINA Citation2007). As a matter of fact, Messina is the third largest port in Europe for embarking and disembarking passengers (European-Union Citation2020) which is very encouraging for the commercial side of this project ().
Solar panels and batteries
Once all details about the ship have been established, it is now time to take a look at what kind of equipment needs to be fitted in the ferry to turn it fully electric. First of all, as this ship is solar assisted, the area where the solar panels will be installed needs to be determined. To simplify calculations the usable area will be 80 % of the area formed by the total length and total breadth. This is done in order to compensate for the loss of space due to the presence of the bridge deck and some of the shading caused by it. Therefore, the area of PV panels is 390 m2 (Equation 1).
After that, the solar panel model needed to be determined in order to know its dimensions and thus how many can be fitted onboard. In order to do so, a software called RETScreen was used. The software RETScreen is a clean energy management software created by the Canadian government, very useful to perform simulations for a certain type of renewable energy production. In the software, a list of photovoltaic panels was proposed and finally the SunPower mono-si–SPR–X21–345–COM was chosen thanks to a very high efficiency of 21.5% which is one of the highest when comparing to other panels. The number of units was increase in order for the total area value to be around the value of the area calculated above. RETScreen determined that 245 panels were needed to cover an area of 393 m2 and at a total cost of 227,286 $.
Moreover, in order to have an idea of how much solar energy will be supplied by the sun to the panels, some meteorological data must be collected and analysed. Again, using RETScreen, the geographical position of the area of operation, namely Messina, has been inserted in the software and a table with various meteorological factors appears. The two main information which are important for this research as they will need to be inserted in the simulation are the daily solar radiation (horizontal) and the air temperature. In order to simplify the problem, the angle between the solar panels and the solar radiation will be neglected as it very complicated to estimate as it varies continuously given the constant oscillations of the ship. In addition to the data provided by RETScreen, the daily sunny hours also need to be taken into account as they will determine during how much time will the panels harvest energy. The daily sunny hours are found thanks to the Climatemps website (Climatemps, Citation2009–2014). Finally, a conversion from kWh/m2/day given by the software to W/m2 needed for the simulation (Equation 2).
Finally, in order to complete the conversion of the vessel to fully electric, battery packs need to be fitted. Therefore, the number and type of batteries have to be chosen according to the capacity and the energy which have to fulfil the powering requirements of the ferry. When looking at Ferguson Marine SHIPLYS presentation, it can be seen that the total daily power consumption is 2603 kWh including losses (Ferguson-Marine-Engineering-Limited). After researching possible solutions, the Energy-88 lithium industrial batteries manufactured by Sterling PlanB Energy Solutions (PBES) (Sterling-PlanB-Energy-Solutions). This company is specialised in marine energy storage systems.
After having a look at its specification sheet, two information can be extracted which are energy of 8.8 kWh and the capacity of 100 Ah (Sterling-PlanB-Energy-Solutions). For instance, knowing the energy of each single battery allows to calculate the number of batteries needed. Indeed, the number of batteries is 296 (Equation 3 & 4).
However, the batteries will be configured so that when the state of charge of the battery reaches 75% it will be discharge and power the electric motor, whereas when the SOC reaches 25% the battery is charged by the solar panels. Therefore, the battery only uses 50% of its energy which means that they will be separated into two bundles of 296 batteries therefore the total number of batteries is 592. Moreover, the batteries need to be arranged into specific series and parallel connections. It is given from the specification that the nominal voltage of each battery is 88 V and in order to reduce losses and for the solar panels to work at their best it is recommended that the voltage should be kept at around 700 V. Therefore, the number of series connection will be 8 (Equation 5) giving a voltage of 704 V (Equation 6).
Furthermore, the rest of the batteries will be placed in parallel and thus the electric charge can be determined. In order to reach the desired number of batteries, 37 parallel connections need to be configured (8 * 37 = 296). Moreover, from the specification sheet, it is given that the battery’s capacity is 100 Ah. Therefore, the rated capacity is equal to 3700 Ah (Equation 7).
Finally, even if it is not the scope of this research, it is also interesting to know how much space and weight the battery bundles will take. Again, taking a look at the specification sheet, it is found that the batteries are 0.58 m long, 0.38 m wide and 0.32 m high and weigh 90 kg (Sterling-PlanB-Energy-Solutions). Therefore, the area needed to accommodate the batteries if they are not piled up is 0.58 × 0.38 × 592 = 130.5 m2. In order to have the freedom of arranging them freely, the volume can be calculated and is equal to 0.58 × 0.38 × 0.32 × 592 = 41.75 m3. Finally, the attribute which causes most concern when talking about batteries is the weight which amounts to 90 kg per battery giving 592 × 90 = 53.3 tonnes.
Simulation
Modelling
Once all the ship’s specifications and route data were set, a simulation of the electric circuit was ready to be modelled using the MATLAB software with the Simulink package. MATLAB/Simulink is a very useful tool as it allows users to model electric circuits with many systems already given by the software but also to run the simulation and view the results using some monitors and dials. As mentioned previously, the electric circuit of the ship was modelled so that the power coming from the photovoltaic panels would recharge one of the two battery bundles depending on the state of charge. For instance, electric switches were created so that the power from the solar panels would charge the set of battery which state of charge (SOC) would reach 25% and charge it up to 75%. Meanwhile, the other set of batteries would be discharged and power the electric motor. The final result can be found below in and will be explained further on.
Figure 3. MATLAB/Simulink model.
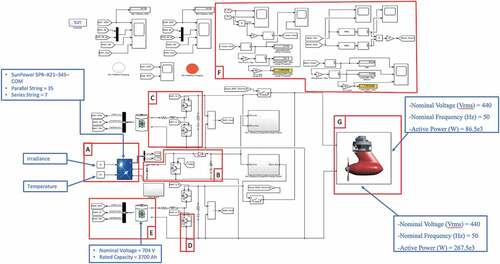
Firstly, starting by the solar side (area A), a PV array was created and subsequently the photovoltaic panel data found in was inserted. For instance, the exact solar panel model was selected from a large list, namely the SunPower mono-si–SPR–X21–345–COM. Moreover, the number of solar panels were divided in series connected strings and parallel connected strings where the series connected string number was chosen in order to achieve the desired voltage and the other so that the total would equal to 245 panels. In addition, the previously calculated irradiances were inserted in the top constant and the temperature in the bottom constant. The voltage and current were measured respectively by V_PV and I_PV and can be visualised in the third monitor from the left with the corresponding go-to.
Table 2. Case ship power consumptions by Ferguson Marine (Ferguson-Marine-Engineering-Limited)
After leaving the PV array, the electricity will pass through various devices scattered around the circuit which will help maintain the voltage as uniform as possible. Indeed, the boost converter (area B) is a device used to increase the voltage of DC. Here, it is used together with the control mode that enables the optimal power output from the solar panel through the Maximum Power Point Tracking (MPPT), so that the optimal solar panel power output is raised to an appropriate voltage for transmission to the battery and transmitted. In addition, the buck-boost converter (area C) is used as a buck converter when charging power to the battery, and as a boost converter when discharging power from the battery. The buck converter is a device that lowers the voltage of DC, and when charging the battery, it lowers the voltage of the supply power to the appropriate voltage for the battery. On the contrary, when power is supplied from the battery, it operates as a boost converter to increase the voltage and output it in consideration of the voltage and transmission used in the grid. Also distributed around the circuit are Insulate Gate Bipolar Transistor (IGBT) switches (Area D). These switches have an input signal coming from a sort of control room where voltage, SOC and other information arrive which an algorithm will process and send the command to the switch to open or close. There are several power semiconductor devices such as MOSFET and IGBT. When selecting the appropriate device, purpose, power, voltage, current and switching frequency need to be considered. Among the various power semiconductor devices, IGBT is the best option to use in this situation. Even though MOSFET has the benefit of faster switching characteristic, it can be used only for low voltage. Therefore, when considering voltage range and switching frequency, IGBT is the most appropriate.
After leaving the solar panels, depending on the state of charge, the electricity will reach one of the two battery packs (Area E). The batteries have been configured using the data and the calculations of section 1.2. Indeed, the nominal voltage and the rated capacity calculated were entered as well as the battery type, namely lithium-ion. In addition, to monitor their state of charge (Batt2_SOC), voltage (Batt2_VB) and current (Batt2_IB), some go-to tags have been added which will send the information to the first and second monitors from the left for respectively each set of battery.
Finally, the electricity ends it course in the electric motor (Area G) which is actually a resistance with inserted the active power corresponding to the motor’s power at 9 knots (267.5 kW). Moreover, in order to account for the hotel load and losses, another resistance was modelled with an active power corresponding to it (86.5 kW). These values were given in section 1.1 (). Serise of information as data input for analysis can be presensted (see ); solar irradiances over year for the project area (see ), onboard battery specification (see ), relavent equations (see ), Powering costs (see ), Aggregated LCA inventory results for single carbonate Si panels (see ).
Table 3. Photovoltaic panels’ specifications by RETScreen
Table 4. Daily solar irradiances conversion
Table 5. Batteries’ specifications
Table 6. Summary of section 3.2 equations
Table 7. Powering costs
Simulation results
The final part of modelling consisted of creating all the monitors and displays which will show numerical values of the various measuring. As mentioned earlier, there are monitors and displays for voltage and current the batteries and solar panels. However, more importantly, there are also monitors and displays for the motor’s and PV panel’s power (area F). Even though the motor’s power was already given it was interesting for the simulation to include the results and also multiply this result to give the daily and yearly results given the operation hours. On the other hand, the crucial result of the simulation was the power generated by the solar panels. In order to find it, the voltage output and the current were multiplied to form a unique display/monitor. Again, the daily production was given in relation to the daily sunny hours in which the PV panels will be able to harvest energy.
After having finalised the modelling, the simulation was run entering different values for the meteorological data namely the daily irradiance, the temperature and the daily sunny hours. As these parameters vary monthly the operation was repeated twelve times in order to see the difference between the produced output depending on the month. Once the results were gathered as shown in , it could be seen that the output generated by the panels had a large variation depending on the month, where the lowest values is almost 4 times lower than the highest value. It can be said that the energy production by solar panels is very variable and therefore a configuration where the solar panels are the only source of power is not advised. Indeed, in addition to the monthly data changes which are statistical and can very a lot year by year, there are also a large number of other variables which could affect the harvesting such as clouds or swell modifying the angle incidence. Therefore, it can be said that this type of ship would be ideal somewhere where the weather is the same every day and where there are almost no seasons.
Figure 4. Graph representing the power generated by PV panels.
Economic and environmental assessment
Economic assessment
One of the main aims and objectives of this paper is to understand if solar panels are a commercially attractive technology for the marine industry and if so, encourage a large-scale use as opposed to the prototype scale at which they are employed these days. In order to do so, three scenarios have been built. Firstly, scenario 1, describes a case ship which is fully powered by the electricity coming from shore which charges the batteries carrying enough power to propel the ship in its daily operations. The charging of these batteries will take place at night in port when the ship is not sailing. Secondly, scenario 2 is similar to scenario 1 as the power produced onshore but also by photovoltaic panels fitted on the ferry. This means that the power coming from shore is reduced from 2603 kWh to 2000 kWh as the panels are able to take care of 603 kW at most. Finally, in scenario 3 the full powering demand is satisfied by diesel oil fuelling a diesel engine. Having described the three scenarios, a simple economic assessment can be undergone which consists of estimating the fuelling costs for three scenarios for the 30 years estimated life of the ship. For instance, in scenario 1, the fuelling costs come entirely on the cost of electricity in Italy which is set at 0.0856 €/kWh for non-household consumers as (European-Union, Citation2020).
Figure 5. Electricity prices in the EU by country.
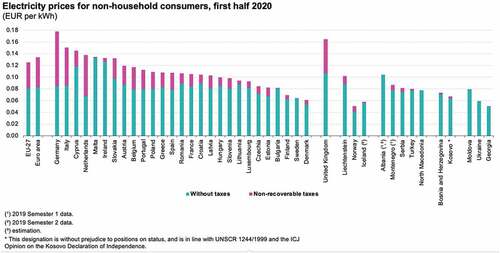
Figure 6. Diagram of Scenarios.
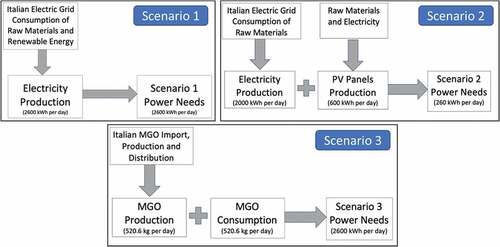
Figure 7. Diagrams representing emission levels of the three scenarios: (a) GWP, (b) AP, (c) EP and (d) POCP.
Moreover, in scenario 2, the costs come from the price of electricity at 0.0856 €/kWh plus the cost of solar panels which is only their initial cost at 192,146.00 € as they do not require extra money when operating. Lastly, the powering expenses in scenario 3 come solely from the cost of Marine Gasoil (MGO) which is equal to 443.6 €/tonne as per the time of this research. In order to estimate the quantity of fuel used, the given specific fuel oil consumption (SFOC) of 200 g/kWh must be used (DNV-GL Citation2021). Therefore, the daily quantity of fuel is:
M = daily power consumption × SFOC = (2603 × 200)/1000 = 520.6 kg or 0.5206 tonnes
To conclude, the table below summarises the fuelling costs of the case ship for the three different scenarios in 30 years’ time.
Environmental assessment
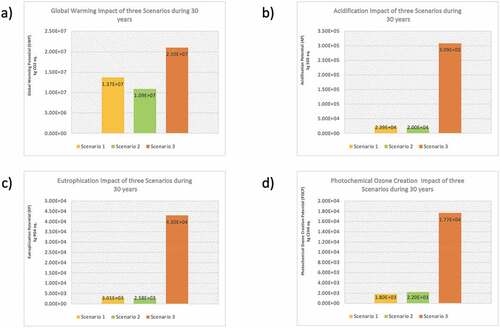
illustrates the proposed three scenarios The other main aim and objective of this research is to understand how much difference solar panels make in the environmental impact and thus if they are real completely eco-friendly. In order to do so, a life cycle assessment was performed for the three scenarios described in section 2.1 using GaBi software. The life cycle assessment technique consists of evaluating the emissions produced during the manufacturing (minerals, electricity) and the emissions formed in the utilisation of a certain object. In this research, four types of environmental impacts will be determined namely the Global Warming Impact, the Acidification Impact, the Eutrophication Impact and the Photochemical Ozone Creation Impact. These four are considered the most significant impacts as they consider a serious threat to the environment See .
Firstly, in scenario 1, emissions come from the consumption of natural resources or renewable energies used to power the electric grid of a specific country, in this case Italy. Indeed, every country has a different percentage of ways to generate electricity which GaBi has got in its database. Therefore, to assess the impact of the Italian electricity production, the amount of energy required in scenario 1 needs to be inserted in the software and it will directly give the daily emissions. As electricity consumption does not produce any emissions, the whole of the environmental impact will come from the electricity production.
Secondly, in scenario 2, emissions are produced by the same factors as scenario 2 but the environmental impact of the solar panel’s manufacturing needs to be estimated too. In order to find the emissions coming from the electricity production in the Italian electric grid, the daily power need must be inserted (2603 kWh) minus the daily power generated by the photovoltaic panels (603 kWh) considering the highest value using GaBi.
However, to estimate the environmental impact of the panel’s manufacturing GaBi could not be used as it does not include a ready to use database with this process’ emissions. Therefore, after doing a literature review, a research article Milousi et al. was found where the values of the emissions per kWh were shown depending on the solar panel type (Milousi et al. Citation2019). The three first environmental impacts were calculated by multiplying their respective emissions and the power produced by the PV panels. On the other hand, for the Photovoltaic Ozone Creation Potential (POCP), since the kg C2H4 eq. was not given, the kg SO2 eq., kg CO eq., kg NOx eq., were multiplied by the POCP factors explained below in . Since the solar panel’s operation does not produce any emissions, these are the only two factors causing an impact on the environment.
Table 8. Aggregated LCA inventory results for single carbonate Si panels (Milousi et al. Citation2019)
Table 9. Emissions caused by manufacturing of PV panels
Finally, in scenario 3, the impact on the environment is entirely coming from the diesel oil. Nevertheless, two different processes will impact the environment in distinctive ways. Firstly, there is the oil production and distribution which adds up all the emission up to the moment where the fuel is fed into the ship. This process is different depending on each nation, as for example the oil in Italy will have a larger environmental impact than oil in Saudi Arabia as the latter is an oil producing country whereas Italy needs to import it from further away. In order to estimate the impact, it is sufficient to input the mass of the oil which needs to be produced.
However, in scenario 3, the environmental impact caused by diesel consumption also needs to be taken into account. In order to do so, GaBi could not be used as it does not provide a ready to use fuel consumption emissions database. Therefore, after some research, a study by Dr. Jeong et al. was found where the quantity of polluting gases can be calculated given the mass of fuel burnt (Jeong et al. Citation2018). This can be done using a factor shown in . Moreover, each of these gasses will affect some of the previously citated environmental impacts with different weight. The weight of the effect caused in these impacts can be calculated by multiplying the gas quantity with the impact’s factor found in . shows the emssions from MGO whereas summerise all emissions under the proposed three scenarios.
Table 10. Emission factors for marine diesel engine operation (Jeong et al. Citation2018)
Table 11. Type of representative pollutants and their impact factors (Jeong et al. Citation2018)
Table 12. Emissions produced by MGO consumption
Table 13. Summary of all emissions produced in the three scenarios
Finally, a recapitulative table of the main environmental impacts for the three scenarios can be found below as well as four graphs of the impacts in order to have an understanding of the least polluting scenario at first glance.
Discussion
This research has shown that a zero-emission ferry is not obtainable, although emissions and thus the impact on the environment can be drastically reduced when preferring electricity to diesel. This impact is even further reduced with the help of solar panels which have shown to make a non-negligible difference. Indeed, it was proved that an all-electric ship is feasible without even having a loss in performance compared to a traditional diesel ferry. On the contrary, a large number of advantages come from electric propulsion. For instance, the acoustic pollution is eliminated which is incredibly beneficial for passenger comfort and marine wildlife’s wellbeing. Moreover, as demonstrated, the powering costs are also reduced when using fully electric propulsion, but the biggest difference is seen when solar panels are added making the savings significant. The utilisation of photovoltaic panels will also have a social impact as the ships will be less costly to run and thus the fare will be less expensive. This is a great impact especially in this area as many passengers are obliged to cross the strait every day for work and have no other alternative as there is no bridge. The same struggle is quite common and similar examples can be found around the world. Therefore, given the non-negligible advantages demonstrated in this research, this could one day lead to the replacement of all traditional short route ferries with ones which are electric assisted or fully powered by photovoltaic panels. This could mean that IMO’s goal of cutting 40 % of the 2008 CO2 emissions by 2030 could be one step closer. In addition, this could represent a small yet important part of the worldwide signed Paris climate agreement to limit the global warming to 1.5 °C a year.
Even though solar panels have proven to be an excellent technology which can be installed onboard ferries to reduce emissions, they are not sufficient to generate enough power to propel the ship during the day. In other words, they are helpful as they produce some clean electricity and thus the not eco-friendly electricity coming from shore is reduced. Indeed, the highest source of emissions when looking at both electric configurations comes from the emissions produced when generating electricity for the national grid. As a matter of fact, the main source of energy to produce electricity still comes from fossil fuels, mostly natural gas. Therefore, a ship which would be fully powered by solar panels would have practically no emissions except when manufacturing. A fully solar powered ship could be possible in future if the advances in the solar panel technology such as a higher efficiency allowed them to cover the whole load. This issue could be a possible starting point for future research. Moreover, in this paper, the non-negligible impact of batteries has not been discussed. Indeed, batteries are problematic as they are manufactured using harmful materials and their efficiency rapidly decreases with time. Finally, another crucial aspect which could be investigated in future research is the whole process of recycling these two components and their environmental and economic impact. Indeed, batteries and photovoltaic panels are quite tricky to recycle as they are made from toxic materials which are not easily disposable in nature and cannot be recycled. Therefore, it would be interesting to know if they are still less polluting than diesel and if some money could be recouped by reusing the materials to manufacture new batteries and PV panels.
Conclusion
Having come to an end of this research, here is a summary of the main findings found throughout the paper:
The solar-electric option has proven to be the most efficient in all fields demonstrating the utility of the photovoltaic technology in the marine industry.
The energy production coming from the solar panels can be up to 4 times lower depending on the month compared to the highest value.
The solar-electric configuration is approximately 370,000 € cheaper than the all-electric option and 462,000 € cheaper than the diesel alternative when looking at the powering costs in 30 years.
The solar-electric configuration allowed to reduce the 30 years’ GWP impact by 2,800 tonnes of CO2 eq. compared to the all-electric option and by 10,100 tonnes of CO2 eq. when compared the diesel alternative.
The solar-electric configuration allowed to reduce the 30 years’ AP impact by 3.8 tonnes of SO2 eq. compared to the all-electric option and by 288.7 tonnes of SO2 eq. when compared the diesel alternative.
The solar-electric configuration allowed to reduce the 30 years’ EP impact by 432 kg of PO4 eq. compared to the all-electric option and by 40,400 kg of PO4 eq. when compared the diesel alternative.
The solar-electric configuration allowed to reduce the 30 years’ POCP impact by 15,470 kg of C2H4 eq. compared to the diesel alternative. However, there is an increase of 400 kg of C2H4 eq. when compared the all-electric option.
Abbreviations
Disclosure statement
No potential conflict of interest was reported by the author(s).
References
- Alexandros Glykas, G. P., and S. Perissakis. 2010. “Application and Cost–benefit Analysis of Solar Hybrid Power Installation on Merchant Marine Vessels.” Ocean Engineering 37(7): 592–602. Retrieved from http://www.sciencedirect.com/science/article/pii/S0029801810000272
- AUTORITÁ-PORTUALE-DI-MESSINA. May 2007. “TRAFFICO MARITTIMO: ANDAMENTO, SCENARI ED OBIETTIVI.” PIANO REGOLATORE PORTUALE DI MESSINA. Accessed on 15th May 2021Retrieved from http://www.porto.messina.it/files/Documenti%20Pagine/Piano%20Regolatore%20Portuale%20Messina-Tremestieri/Allegato%20D.2.pdf
- Bleicher, A. 2013. “Solar Sailor [Dream Jobs » 2013 - Renewables].” IEEE Spectrum 50 (2): 45–46. doi:10.1109/MSPEC.2013.6420144.
- Çağlar Karatuğ, Ç., and Y. Durmuşoğlu. 2020. “Design of A Solar Photovoltaic System for A Ro-Ro Ship and Estimation of Performance Analysis: A Case Study.” Solar Energy 207: 1259–1268. http://www.sciencedirect.com/science/article/pii/S0038092X20307696
- Chaouki Ghenai, M. B., B. Brdjanin, and A. K. Hamid. (2019). “Hybrid Solar PV/PEM Fuel Cell/Diesel Generator Power System for Cruise Ship: A Case Study in Stockholm, Sweden.” Case Studies in Thermal Engineering, 14. Retrieved from http://www.sciencedirect.com/science/article/pii/S2214157X19302278
- Climatemps. 2009-2014. “Sunshine & Daylight Hours in Messina, Sicily, Italy.” Retrieved from http://www.sicily.climatemps.com/sunlight.php
- Cromratie Clemons, S. K., C. R. S. Salloum, G. Herdegen, M. Kamens, and S. H. Gheewala. 2021. “Life Cycle Assessment of a Floating Photovoltaic System and Feasibility for Application in Thailand.” Renewable Energy 168: 448–462. http://www.sciencedirect.com/science/article/pii/S096014812032022X
- Delgado-Torres, A. M., L. G.-R. María Jiménez, and Del Moral. 2020. “Preliminary Assessment of Innovative Seawater Reverse Osmosis (SWRO) Desalination Powered by a Hybrid Solar Photovoltaic (PV) - Tidal Range Energy System.” Desalination, 477. Retrieved from http://www.sciencedirect.com/science/article/pii/S0011916419313529
- DNV-GL 2021. “Current Price Development Oil and Gas.” Accessed on 17th April 2021 https://www.dnv.com/maritime/lng/current-price-development-oil-and-gas.html
- Endresen, Ø. 2003. “Emission from International Sea Transportation and Environmental Impact.” Journal of Geophysical Research Atmospheres 108 (D17). doi:10.1029/2002JD002898.
- European-Union. March 2020. “Maritime Ports Freight and Passenger Statistics.” Statistics Explained. Accessed 20th March 2021Retrieved from https://ec.europa.eu/eurostat/statistics-explained/pdfscache/6652.pdf
- Eyring, V., I. S. A. Isaksen, T. Berntsen, W. J. Collins, J. J. Corbett, O. Endresen, R. G. Grainger, J. Moldanova, H. Schlager, and D. S. Stevenson. 2010. “Transport Impacts on Atmosphere and Climate: Shipping.” Atmospheric Environment 44 (37): 4735–4771. doi:10.1016/j.atmosenv.2009.04.059.
- Gkerekos, C., I. Lazakis, and G. Theotokatos. 2019. “Machine Learning Models for Predicting Ship Main Engine Fuel Oil Consumption: A Comparative Study.” Ocean Engineering 188: 106282. doi:10.1016/j.oceaneng.2019.106282.
- Guellard, B., X. De Montgros, P. P. De La Barriere, G. Wolfensberger, and P. D’oliveira 2013. “An Overview of Electric and Solar Boats Market in France.” Paper presented at the 2013 World Electric Vehicle Symposium and Exhibition (EVS27). Spain.
- Haibin Wang, E. O., B. Jeong, and P. Zhou. 2019. “Life Cycle and Economic Assessment of a Solar Panel Array Applied to a Short Route Ferry.” Journal of Cleaner Production, 219. Retrieved from http://www.sciencedirect.com/science/article/pii/S095965261930513X
- Hongda Liu, H., Q. Zhang, X. Qi, Y. Han, and F. Lu. 2017. “Estimation of PV Output Power in Moving and Rocking Hybrid Energy Marine Ships.” Applied Energy 204: 362–372. http://www.sciencedirect.com/science/article/pii/S030626191730884X
- Jeong, B., H. Wang, E. Oguz, and P. Zhou. 2018. “An Effective Framework for Life Cycle and Cost Assessment for Marine Vessels Aiming to Select Optimal Propulsion Systems.” Journal of Cleaner Production 187: 111–130. doi:10.1016/j.jclepro.2018.03.184.
- John Eskew, J., M. Ratledge, M. Wallace, S. H. Gheewala, and P. Rakkwamsuk. 2018. “An Environmental Life Cycle Assessment of Rooftop Solar in Bangkok, Thailand.” Renewable Energy 123: 781–792. http://www.sciencedirect.com/science/article/pii/S0960148118301897
- Kobougias, I., E. Tatakis, and J. Prousalidis. 2013. “PV Systems Installed in Marine Vessels: Technologies and Specifications.” Advances in Power Electronics, 2013 2013: 1–8. doi:10.1155/2013/831560.
- Kreutzmann, A. 2000. “The Alster Sonne Solar Boat, Hamburg’s New Attraction; Das Solarboot’Alster Sonne’ist Die Neue Attraktion Auf Hamburgs Gewaessern.” Paper presented at the Photon.
- Mamun, S. A., Z. I. Chowdhury, M. S. Kaiser, and M. S. Islam. 2016. “Techno-financial Analysis and Design of On-board Intelligent-assisting System for a Hybrid solar–DEG-powered Boat.” International Journal of Energy and Environmental Engineering 7 (4): 361–376. doi:10.1007/s40095-016-0218-0.
- Milousi, M., M. Souliotis, G. Arampatzis, and S. Papaefthimiou. 2019. “Evaluating the Environmental Performance of Solar Energy Systems through a Combined Life Cycle Assessment and Cost Analysis.” Sustainability 11(9): 2539. Retrieved from https://www.mdpi.com/2071-1050/11/9/2539
- Oettinger, H. “Europas Herausforderungen: Wirtschaft–Währung–Energie. Erste Vigoni Lecture.” Integration (2012): 51–58.
- Sharma, A. K., and D. Kothari (2018). “Solar PV Potential for Passenger Ferry Boats in India’s National Waterways.” Paper presented at the 2018 2nd International Conference on Inventive Systems and Control (ICISC). Seoul, South Korea.
- Smith, T., J. Jalkanen, B. Anderson, J. Corbett, J. Faber, S. Hanayama, … A. Pandey 2014. “Third IMO GHG Study 2014: Executive Summary and Final Report.” Sterling-PlanB-Energy-Solutions. System Specifications for the PBES Lithium Industrial Batteries. In.
- Viana, M., P. Hammingh, A. Colette, X. Querol, B. Degraeuwe, I. de Vlieger, and J. Van Aardenne. 2014. “Impact of Maritime Transport Emissions on Coastal Air Quality in Europe.” Atmospheric Environment 90: 96–105. doi:10.1016/j.atmosenv.2014.03.046.
- Watterson, P. A., W. M. Holliday, C. E. Evans, V. S. Ramsden, V. Ramaswamy, and G. P. Hunter 2002. “UTS Brushless DC Motors and Controllers for the Solar Sailor Ferry.” Paper presented at the Proceedings of Pacific 2002 International Maritime Conference. Sydney
- Wu, Y., L. Li, Z. Song, and X. Lin. 2019. “Risk Assessment on Offshore Photovoltaic Power Generation Projects in China Based on a Fuzzy Analysis Framework.” Journal of Cleaner Production 215: 46–62. http://www.sciencedirect.com/science/article/pii/S0959652619300307
- Wu Yunna, Buyuan Zhang, Chenghao Wu, Ting Zhang, and Fangtong Liu. “Optimal site selection for parabolic trough concentrating solar power plant using extended PROMETHEE method: A case in China.” Renewable Energy 143 (2019): 1910–1927.
- Yehia, W., L. Kamar, M. A. Hassan, and M. M. Moustafa. 2020. “Proposed Hybrid Power System for Short Route Ferries.” Naše More 67 (3): 226–231. doi:10.17818/NM/2020/3.6.
- Yupeng Yuan, Y., J. Wang, X. Yan, Q. Li, and T. Long. 2018. “A Design and Experimental Investigation of A Large-scale Solar Energy/diesel Generator Powered Hybrid Ship.” Energy 165: 965–978. http://www.sciencedirect.com/science/article/pii/S0360544218318498
- Zapałowicz, Z., and W. Zeńczak. 2021. “The Possibilities to Improve ship’s Energy Efficiency through the Application of PV Installation Including Cooled Modules.” Renewable and Sustainable Energy Reviews 143: 110964. doi:10.1016/j.rser.2021.110964.