
ABSTRACT
In line with the global trend for environmental protection, the shipping industry is also making significant efforts. The International Maritime Organization introduced carbon intensity indicator and energy efficiency existing ship index to reduce greenhouse gases and presented “Initial IMO Strategy on reduction of GHG emissions from ships”. In contrast to previous environmental indices, carbon intensity indicator is calculated based on the operation information of ship. In this study, the annual fuel consumption was calculated based on the operation information of 4,151 ships and CO2, N2O, and CH4 emissions among greenhouse gases were estimated. The results of the study showed that CO2 accounted for 98% of the greenhouse gases emitted from ships, the highest, and N2O and CH4 were found to be insignificant at 1.5% and 0.5%. The major types of ships that emitted greenhouse gases were cargo ships, chemical tankers, oil tankers, and gas carriers. Ships subject to data collection system and carbon intensity indicator regulations include only 69% of the fuel consumed by all ships. This proportion increases to 87% of the total fuel consumption if it is expanded to include ships over 400 GT that are regulated by energy efficiency existing ship index.
Introduction
Recognizing the risks of climate change globally, efforts are being made through mutual cooperation between countries, such as the 1992 Convention on Climate Change, the 1997 Kyoto Protocol, and the 2015 Paris Agreement. In 1997, IMO began regulating air pollutants through MARPOL Annex VI in the shipping industry (Chu Van et al., Citation2019).
At the 62nd MEPC meeting in 2011, specific discussions were held, including the introduction of EEDI and SEEMP to MARPOL Annex VI. The regulation of GHG and air pollutants was first initiated in a resolution of the General Assembly in December 2003 (Joung et al., Citation2020; Shi, Citation2016). Air pollutants are regional pollutants, and the damage is short-term and direct, so they can be managed at the individual national level, such as establishing an ECA region, but GHG are global pollutants, and the damage is long-term and indirect, so multinational cooperative management should be implemented (Ramanathan & Feng, Citation2009; Tan, Citation2014).
The initial strategy for GHG emissions was adopted at the MEPC meeting in 2018. This strategy aims to lower CII, the average carbon emission per unit of transport, by at least 40% by 2030, compared to 2008, and by 70% by 2050 (Agarwala et al., Citation2021). Based on the operation information of ships, “attained CII” is calculated through actual consumed fuel consumption, and classified into A-E grades, and appropriate measures for each grade must be implemented. The basis for CII calculation is the DCS, and it is an important factor for securing basic data for establishing a ship’s GHG reduction strategy and developing a reduction policy. However, applicable ships are limited to ships in ocean-going with over 5,000 GT. The EEXI, which is a carbon emission regulation implemented together with CII, is a calculating method using ship specifications, and the target ship is applied to ocean-going ship with GT greater than 400 tonnages (Kim et al., Citation2020; Lindstad et al., Citation2021).
Since the past, efforts have been made to estimate fuel consumption and GHG by ships. Moreira et al. estimated the fuel consumption of ships using engine power, wave height, and ship speed. It was expected that fuel consumption might be predicted using the sea conditions and ship speed (Moreira et al., Citation2021). Le et al. developed an estimation model for fuel consumption for 143 container ships operating from 2012 to 2016. Fuel consumption was calculated based on speed and operation time for five different types of container ships (Le et al., Citation2020).
Meng, Du, and Wang computed the fuel consumption rate utilizing the speed, displacement, wave direction/height, and wind size for four container ships (S. Wang & Meng, Citation2012). Psaraftis and Kontovas estimated the GHG emissions from commercial fleets. Considering 320 operating days per year, it was estimated that 840 million tons of GHG were emitted in 2007 (Psaraftis & Kontovas, Citation2009).
Prior research has mainly focused on enhancing the accuracy of estimated fuel consumption under specified situations, and there have been few analyses based on actual operational data using diverse criteria. Particularly lacking are analyses of GHG emissions according to CII and EEXI regulations.
In this study, fuel consumption and major GHG emissions of diesel-powered Korean ships were calculated and compared based on ship type and total tonnage. Specially, by comparing ships of over 5,000 GT, which are subject to DCS and CII regulations, to ships of 400 to 5,000 GT, which are subject to EEXI regulation but excluded from CII regulation, were analyzed. To respond to continuous environmental regulations and establish preventive policies, it is becoming increasingly important to analyze basic data on fuel consumption and GHG emissions of ships currently in operation, in addition to understanding the specifications of the vessels and considering technological implementation. As Korea is a country with a high volume of trade and possesses a hub port, it operates ships of various sizes ranging from large to small, and due to geographical factors, it operates various types of vessels, thus providing it highly effective for analyzing basic data on various ship types and size (Ducruet et al., Citation2010; Hoffmann et al., Citation2017).
The results of this study will help quantify the impact of Vessels excluded from regulations on GHG emissions by ship type and will be useful for establishing more systematic GHG emission policies based on ship size and type in the current initial Strategy’s expanded discussions on GHG reduction.
Classification of subjects
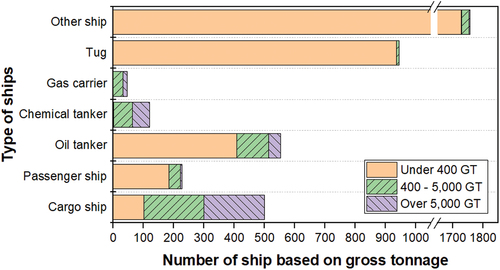
As of 2021, this study was conducted on 4,151 Korean-registered ships with diesel engines for ships, omitting gasoline engines and onshore diesel engines. shows the statistics of the studied ship classified by ship type based on gross tonnage. On the basis of cargo characteristics, ships were classified into seven distinct groups. More than 98% of ships are less than 400 GT, with more than 1,757 other ships and 945 tugs making up the largest percentage. The proportion for chemical tanker and gas carriers are quite small, with 121 and 47 vessels.
Figure 1. Number of ships according to gross tonnage by ship type.
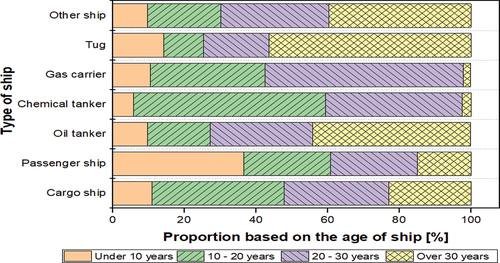
shows the proportion of ships by type and age. More than 40% of oil tankers, tugs, and other ships, ships are at least 30 years. On the other hand, the proportion of gas carriers and chemical tankers on ships older than 30 years is only 2%. Considering that the average lifecycle of a typical ship is 30 years and that the age of a ship is decreasing owing to ship characteristics and regulations change, it is likely that an eco-friendly ship will replace the aged ship in the near future (Chatzinikolaou & Ventikos, Citation2016).
Figure 2. Proportion of ships according to the age.
How to calculate fuel consumption and greenhouse gas emissions
This study focused on CO2, CH4, and N2O, which are currently being discussed in IMO, among the six GHG established by the Kyoto Protocol. Among the methods provided by IPCC, a bottom-up approach (BUA) was used to calculate emissions based on activity data. Since the information required for the calculation is subdivided, the bottom-up method for calculating emissions is characterized by greater accuracy. However, the engine output value of each ship, the specifications of engines, operation duration data, and engine load factor data according to operation are limited in the shipping industry (Merien-Paul et al., Citation2018; Van Vuuren et al., Citation2009).
In this study, the type of oil used, annual operating hours, load factor, and correction factor were substituted for each ship type as shown in , and the fuel consumption rate was further subdivided according to the age of the ship (IMO, Citation2021). The annual operation time was calculated using arrival and departure time information for 41 ports through PORT-MIS (Port Management Information System). The correction factor was determined by comparing and analyzing the fuel data of actual ships, including 34 Cargo ships, 81 oil tankers, 15 Gas carriers, and 29 Tugs (Ministry of Oceans and Fisheries, Citation2022).
Table 1. Information for calculating ship’s fuel consumption.
To calculate GHG emissions, emission factors selected by IMO were adopted based on ship fuel as indicated in . HFO, the existing ship fuel oil, was converted to VLSFO containing less than 0.5% sulfur in compliance with the sulfur oxides regulation, and Emission factors for VLSFO were applied identically to HFO (IMO, Citation2021; D. Wang et al., Citation2020). For relative comparison of GHG emissions, the unit was matched to tonCO2e (Ton of Carbon Dioxide Equivalent) using the Global Warming Potential (GWP) as shown in to convert based on carbon dioxide (IPCC, Citation2022).
Table 2. Greenhouse gas emission factors for ship fuel.
Table 3. Global warming potential value of GHG.
Calculation result of fuel consumption and greenhouse gas emissions
shows the annual ship fuel consumption results calculated by the information in . This is shown in as fuel consumption per ship after conversion. Regardless of the type of ship, the fuel consumption per ship increased as its gross tonnage larger. Passenger ships, oil tankers, chemical tankers, and tugs did not have a substantial difference in consumption based on the difference in tonnage. but, cargo ships and gas carriers did have a large difference in consumption based on the difference in tonnage.
Figure 3. Annual fuel consumption per ship in 2021.
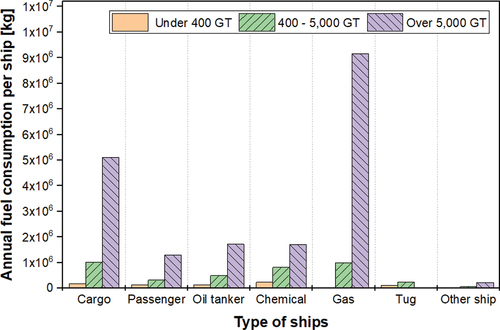
Table 4. Annual fuel consumption results for 4,151 Ships.
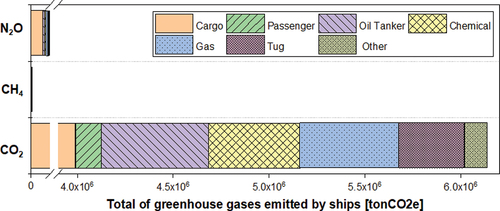
shows the annual total amount of CH4, CO2, and N2O among GHG emitted by ships as of 2021. CO2 emissions were over 50 times more than N2O emissions, and CH4 emissions were almost insignificant. As for the main types of ships that emitted GHG, cargo ships had the greatest emission rate, followed by ships in the commercial ship sector, such as oil tankers, gas carriers, and chemical tankers.
Figure 4. Comparison of greenhouse gas emissions by ship type.
illustrates that after classifying this data by tonnage, it was found that the ratio of cargo ships increased by more than 10% and the emission ratio of other ships decreased overall when only ships of over 5,000 GT were checked compared to the standard of all ships studied.
Figure 5. Comparison of greenhouse gas emissions by gross tonnage.
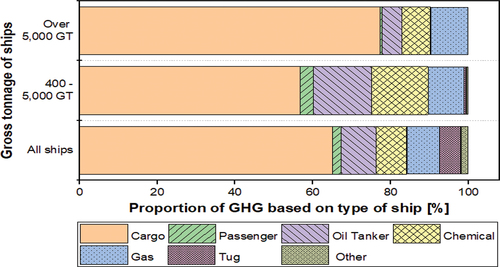
In addition, for ships in the 400 to 5,000 GT range, the cargo ship ratio decreased while the oil tanker and chemical tanker proportion increased. This is judged to be because, as shown in , many ships other than cargo ships have less than 5,000 GT, and the difference in fuel consumption according to the gross tonnage is negligible.
Regardless of the ship type and tonnage, the GHG with a high proportion of emission is CO2, but it was confirmed that the emission rate by ship type varies according to the range change in gross tonnage.
To quantify the impact of the range of gross tonnage, compares the GHG emissions of all target ships with 400–5,000 GT ships that are not included in the CII regulation but are included in the EEXI regulation. GHG emitted from ships with over 5,000 GT subject to CII regulations were compared as shown in .
Figure 6. Comparison of GHG emissions from all ships and GHG emissions from ships in the 400 GT to 5,000 GT.
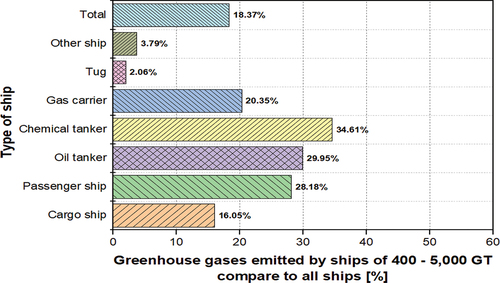
Figure 7. Comparison of GHG emissions from all ships and GHG emissions from ships in the over 5,000 GT.
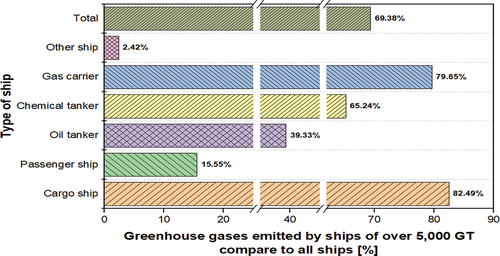
GHG emitted by ships over 5,000 GT account for a significant proportion of the total GHG emissions from ships, 69.38%. In particular, 82% of cargo ships and 80% of gas ships were very high, indicating that the information collected through DCS is suitable for sufficiently determining the GHG emission rate of the ship. Passenger ships and other ships account for a low rate of 16% and 2%, indicating that the approach now under investigation does not adequately reflect GHG emissions from ships. Compared to the expansion of the range to over 400 GT, which is the standard of EEXI, the proportion of passenger ships increases considerably to 44%, whilst the proportion of other ships remains low at 6%.
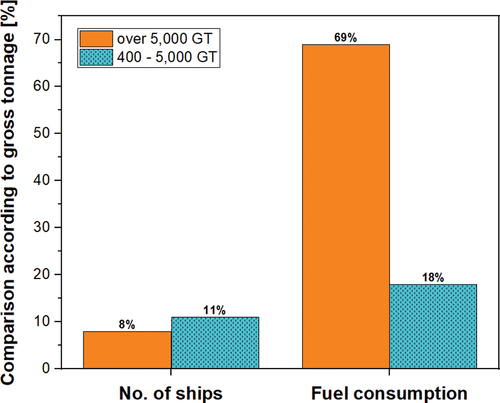
As shown in , ships over 5,000 GT subject to CII regulations and reported through DCS account for 8% of the total ship and 69% of the total fuel consumption. If this is expanded to 400 GT based on EEXI regulation, the standard group will be 19%, but the annual fuel consumption rate would increase to 87%, which might increase the accuracy with which GHG emissions from ships are estimated.
Figure 8. Comparison of the number of subject ships and fuel consumption by ship tonnage.
Conclusions
In this study, fuel consumption and GHG emissions were calculated based on the operating time of 4,197 Korean-flagged ships propelled by diesel engines. As a result of the analysis, it was confirmed that there was a difference in GHG emissions based on the type and the size of ship, and the need for future discussions of the subdivision and expansion of regulatory objectives.
CO2 was the largest proportion of the three GHG evaluated in this study, accounting for 98%, whereas N2O and CH4 were negligible, accounting for 1.5% and 0.5%. The main sources of GHG emissions were cargo ships, chemical tankers, oil tankers, and gas ships, and fuel consumption was high due to relatively longer operation hours and a significant proportion of ships with large tonnage. The proportion of cargo ships is particularly high, at 65%, and confining this to the tonnage range of the CII regulation, it rises to 77.3%. However, in terms of 400–5,000 GT ships which is between the CII and EEXI regulations, the proportion of cargo ships decreased to 56.8%, while oil tankers and chemical tankers increased significantly. Compared to cargo ships, there is not a significant difference in fuel consumption per ship between oil tankers and chemical tankers based on tonnage. Particularly, it is important to control chemical tankers of a broader size due to the extremely low number of chemical tankers older than 30 years, which is expected to impede the replacement of environmentally friendly alternative ships.
For ships that fall under CII regulations, the proportion was very low at 8%, and the proportion of total fuel consumption was also found to be 69%. Expanding the scope to include EEXI-regulated vessels raises the number of vessels covered to 19%, and the proportion of total fuel consumption to 87%. It is necessary to consider the expansion of DCS’s subject to the application given that acquiring additional statistical data can enhance the validity of the regulation.
Abbreviation
| BUA | = | Bottom-Up Approach |
| CII | = | Carbon Intensity Indicator |
| DCS | = | Data Collection System |
| ECA | = | Emission Control Area |
| EEDI | = | Energy Efficiency Design Index |
| EEXI | = | Energy Efficiency Existing ship Index |
| GHG | = | Greenhouse Gases |
| GT | = | Gross Tonnage |
| GWP | = | Global Warming Potential |
| IMO | = | International maritime organization |
| IPCC | = | Intergovernmental Panel on Climate Change |
| MEPC | = | Marine Environmental Protection Committee |
| SEEMP | = | Ship Energy Efficiency Management Plan |
Disclosure statement
The author(s) declared no potential conflicts of interest with respect to the research, authorship, and/or publication of this article.
Correction Statement
This article has been republished with minor changes. These changes do not impact the academic content of the article.
Additional information
Funding
References
- Agarwala, P., Chhabra, S., & Agarwala, N. (2021). Using digitalisation to achieve decarbonisation in the shipping industry. Journal of International Maritime Safety, Environmental Affairs, and Shipping, 5(4), 1–8. https://doi.org/10.1080/25725084.2021.2009420
- Chatzinikolaou, S. D., & Ventikos, N. P. (2016). Critical analysis of air emissions from ships: Lifecycle thinking and results. Green Transportation Logistics: The Quest for Win-Win Solutions, 226, 387–412. https://doi.org/10.1007/978-3-319-17175-3_11
- Chu Van, T., Ramirez, J., Rainey, T., Ristovski, Z., & Brown, R. J. (2019). Global impacts of recent IMO regulations on marine fuel oil refining processes and ship emissions. Transportation Research, Part D: Transport & Environment, 70, 123–134. https://doi.org/10.1016/j.trd.2019.04.001
- Ducruet, C., Lee, S.-W., & Ng, A. K. (2010). Centrality and vulnerability in liner shipping networks: Revisiting the Northeast Asian port hierarchy. Maritime Policy & Management, 37(1), 17–36. https://doi.org/10.1080/03088830903461175
- Hoffmann, J., Wilmsmeier, G., & Lun, Y. (2017). Connecting the world through global shipping networks. In In (Vol. 2, pp. 1–4). SpringerOpen. https://doi.org/10.1186/s41072-017-0020-z
- IMO. (2021). Fourth IMO GHG Study 2020 - Full report and annexes. IMO 2020. https://wwwcdn.imo.org/localresources/en/OurWork/Environment/Documents/Fourth%20IMO%20GHG%20Study%202020%20-%20Full%20report%20and%20annexes.pdf
- IPCC. (2022). Ipcc_ar6_wgiii_fullreport. IPCC. https://www.ipcc.ch/report/ar6/wg3/downloads/report/IPCC_AR6_WGIII_FullReport.pdf
- Joung, T.-H., Kang, S.-G., Lee, J.-K., & Ahn, J. (2020). The IMO initial strategy for reducing Greenhouse Gas(GHG) emissions, and its follow-up actions towards 2050. Journal of International Maritime Safety, Environmental Affairs, and Shipping, 4(1), 1–7. https://doi.org/10.1080/25725084.2019.1707938
- Kim, H., Koo, K. Y., & Joung, T.-H. (2020). A study on the necessity of integrated evaluation of alternative marine fuels. Journal of International Maritime Safety, Environmental Affairs, and Shipping, 4(2), 26–31. https://doi.org/10.1080/25725084.2020.1779426
- Le, L. T., Lee, G., Kim, H., & Woo, S.-H. (2020). Voyage-based statistical fuel consumption models of ocean-going container ships in Korea. Maritime Policy & Management, 47(3), 304–331. https://doi.org/10.1080/03088839.2019.1684591
- Lindstad, E., Lagemann, B., Rialland, A., Gamlem, G. M., & Valland, A. (2021). Reduction of maritime GHG emissions and the potential role of E-fuels. Transportation Research, Part D: Transport & Environment, 101, 103075. https://doi.org/10.1016/j.trd.2021.103075
- Merien-Paul, R. H., Enshaei, H., & Jayasinghe, S. G. (2018). In-situ data vs. bottom-up approaches in estimations of marine fuel consumptions and emissions. Transportation Research, Part D: Transport & Environment, 62, 619–632. https://doi.org/10.1016/j.trd.2018.04.014
- Ministry of Oceans and Fisheries. (2022). Port Management Information System https://new.portmis.go.kr/portmis/websquare/websquare.jsp?w2xPath=/portmis/w2/main/intro.xml
- Moreira, L., Vettor, R., & Guedes Soares, C. (2021). Neural network approach for predicting ship speed and fuel consumption. Journal of Marine Science and Engineering, 9(2), 119. https://doi.org/10.3390/jmse9020119
- Psaraftis, H. N., & Kontovas, C. A. (2009). CO 2 emission statistics for the world commercial fleet. WMU Journal of Maritime Affairs, 8(1), 1–25. https://doi.org/10.1007/BF03195150
- Ramanathan, V., & Feng, Y. (2009). Air pollution, greenhouse gases and climate change: Global and regional perspectives. Atmospheric Environment, 43(1), 37–50. https://doi.org/10.1016/j.atmosenv.2008.09.063
- Shi, Y. (2016). Reducing greenhouse gas emissions from international shipping: Is it time to consider market-based measures? Marine Policy, 64, 123–134. https://doi.org/10.1016/j.marpol.2015.11.013
- Tan, Z. (2014). Air pollution and greenhouse gases: From basic concepts to engineering applications for air emission control. Springer Singapore. https://doi.org/10.1007/978-981-287-212-8
- Van Vuuren, D. P., Hoogwijk, M., Barker, T., Riahi, K., Boeters, S., Chateau, J., Scrieciu, S., van Vliet, J., Masui, T., Blok, K., Blomen, E., & Kram, T. (2009). Comparison of top-down and bottom-up estimates of sectoral and regional greenhouse gas emission reduction potentials. Energy Policy, 37(12), 5125–5139. https://doi.org/10.1016/j.enpol.2009.07.024
- Wang, D., Ding, R., Gong, Y., Wang, R., Wang, J., & Huang, X. (2020). Feasibility of the northern sea route for oil shipping from the economic and environmental perspective and its influence on China’s oil imports. Marine Policy, 118, 104006. https://doi.org/10.1016/j.marpol.2020.104006
- Wang, S., & Meng, Q. (2012). Sailing speed optimization for container ships in a liner shipping network. Transportation Research Part E: Logistics & Transportation Review, 48(3), 701–714. https://doi.org/10.1016/j.tre.2011.12.003