
 ?Mathematical formulae have been encoded as MathML and are displayed in this HTML version using MathJax in order to improve their display. Uncheck the box to turn MathJax off. This feature requires Javascript. Click on a formula to zoom.
ABSTRACT
We investigate whether WSB can provide valuable advice and possibly even outperform financial institutions. In a data-driven study using more than 1.6 million WSB posts published within 3.5 years, we extract and evaluate WSB’s signals for all S&P 500 stocks and compare them to more than 16,000 recommendations from the largest investment banks. While not all WSB recommendations prove profitable, their average returns compete with the best investment banks and outperform them in certain cases. Furthermore, WSB outperformed almost all investment banks at detecting top-performing stocks. We conclude that WSB may indeed constitute a freely accessible, valuable source of investment advice.
1. Introduction
Retail investing, i.e., the stock-trading activity of non-professionals, has seen a significant rise in popularity over the last years (Gurrola-Perez et al., Citation2022), supported by the rapid growth of retail trading apps such as Robinhood (Curry, Citation2024). Retail investors often lack any formal training on financial trading, as it is not their occupation – however, they mitigate this by accessing and researching information via publicly available sources such as Google searches (Hsieh et al., Citation2020). In general, financial markets are becoming more accessible to retail traders, as sources such as online financial news outlets and social media offer a rich selection of investment signals and advice.
However, most online sources of investment advice have notable drawbacks and pitfalls – many are centrally-controlled outlets that either require payment for access, or they pursue indirect financial goals by advertising their own or others’ paid products: Investment banks release analyst reports in paid subscriptions; widely known online news outlets such as The Motley Fool or Seeking Alpha provide paid access to their analyses (while publishing some freely accessible articles that each recommend a subscription of their paid services); and influential individuals share advice on their blogs or on social media platforms such as Twitter (recently renamed to X). Analyst reports from investment banks, which one might presume are the most proficient source of trading advice, remain difficult to access due to their prohibitively high prices (Brush & Spezzati, Citation2017). The publishers of The Motley Fool could exploit the impact and reach of their free publications to influence demand for stocks that they have recommended to their paying subscribers beforehand (this is of course hypothetical, as a separate in-depth analysis is required to confirm or deny this). Similarly, popular public figures could promote a specific security on social media they have invested in, then sell profitably once their fans have followed their advice. Hence, there is typically either a cost barrier to access investment advice or a certain degree of opacity regarding the author’s motives and own investment activities. In addition, most of these information sources have a single source in control of which recommendations are published.
The WallStreetBets (WSB) online community, one of many on the social media platform Reddit, offers an alternative: WSB is an anonymous and democratic place for millions of users to share content or comment and vote on others’ posts – a post’s success and visibility is thus decided by the community. A brief look at popular posts reveals a large number of stock market-related memes and posts, in which community members envy each others’ gains or ridicule their losses, all accompanied by vulgar language. At first glance, this may not appear to be a promising source for valuable investment advice, but rather one to visit for mere entertainment purposes. A closer look at the community, however, reveals that analysis reports (Due Diligence) authored by members and discussions about possible investment opportunities are an important part of WSB as well. In addition, WSB authors are expected to have a stake in the investment advice they share and it is custom that authors share their positions (“Positions or ban”). WSB skyrocketed in public awareness in early 2021, when it played a major role in the hype surrounding the GameStop stock and the resulting short squeeze. WSB is one of the most popular and active online communities about investing in the world and related research suggests that the community may indeed be a source for investment advice, but with varying success (Bradley et al., Citation2021; Buz & de Melo, Citation2023).
We investigate whether an openly accessible, anonymous online community such as WSB can serve as a valuable source for stock market analysis and investment advice, especially when compared to trading recommendations from expert sources such as investment banks. For this purpose, we utilise a large dataset of WSB posts spanning 3.5 years, starting in 2018. We present an approach for successfully extracting and filtering valuable information from the large amount of unstructured text posted on WallStreetBets. The identified investment signals are benchmarked against the 20 largest investment banks’ analyst recommendations (according to the number of published reports) for all companies of the S&P 500 index. Our analysis results yield three main insights: (1) WSB discusses a range of stocks and sectors, showing more diversification than some investment banks. (2) With regard to the number of unique stocks discussed, the WSB community is relatively skilled in identifying and discussing top-performing stocks. (3) While not all of WSB’s signals are profitable, the community achieves average profits that are competitive with those of the best-performing investment banks.
Overall, our results suggest that WSB’s recommendations are competitive with the best professional investment banks, in some cases outperforming them in terms of the average returns. Our research contributes to understanding the role and value of communities such as WSB, showing that they can serve as a source for investment advice and offer a valuable alternative to mainstream channels when signals are extracted with an appropriate methodology.
2. Background
2.1. Reddit and WallStreetbets
Reddit is an online social media platform that provides a place for a diverse range of communities (known as subreddits), each focusing a specific topic, such as humorous memes, politics, or relationship advice. Reddit was established in 2005 and has since grown to host over 100,000 active subreddits with more than 73 million daily active participants, accumulating more than 16 billion posts and comments (Reddit, Inc, Citation2021). Members can post submissions (e.g., texts, links, images, videos), comment on them, an use the up- or down-vote buttons to rate submissions and comments.
WallStreetBets ranks among the largest subreddits with more than 15 million subscribers and describes itself as “a community for making money and being amused while doing it. Or, realistically, a place to come and upvote memes when your portfolio is down”. In January 2021, the community witnessed a sudden staggering growth from 1.7 million to around 8.5 million members within a few days (Subredditstats.com, Citation2021), due to the widespread attention stemming from the GameStop hype. In comparison to other Reddit communities related to the stock market, WSB has the highest subscriber count and activity. In addition, WSB is significantly larger than any finance-related community we could find outside of Reddit (with the largest ones having around 100,000–300,000 users, often being restricted by an application process or a subscription fee).
The community is notorious for its unique slang and the pervasive use of offensive terms which are subject to less strict moderation compared to other subreddits. For instance, members of the community are officially referred to as “degenerates” and often refer to each other as “apes” or “retards” (Agrawal et al., Citation2022) (or more recently, “regards”).
The unprecedented rise in popularity and news coverage in January 2021 mentioned above occurred after the community focused discussions on a series of stocks, including GameStop, that were in part deemed undervalued while simultaneously exhibiting a high short interest, i.e., the ratio of shares being sold short (or shorted) by financial institutions (Anand & Pathak, Citation2022). Short-selling a stock refers to the speculative practice of borrowing shares of a stock in order to sell them immediately with the goal of buying them back later at a lower price (Reed, Citation2013). However, if prices increase further, a short position can cause significant losses that exceed the initial investment.
While discussions of potentially undervalued investment opportunities with growth potential are common in investment-focused online communities, the fact that the GameStop stock showed a pronounced short interest by institutional investors led to the situation being portrayed as an ideological David-and-Goliath battle of small retail investors rallying against hedge funds: by buying and holding the stock, its price could be driven up, thus forcing the financial institutions to close their short positions at a significant loss. This, in turn, drove the stock price up even further, a phenomenon known as a short squeeze, at which point the retail investors could sell their shares at a large profit. This turned WallStreetBets into a place where the broader community of Reddit users could unite in a movement, driven by the prospect of large financial gains through risky investments. In addition, there is an appeal of supposedly advancing the greater cause of punishing financial institutions, particularly hedge funds, which have been accused of ruining many people’s lives during the financial mortgage crisis of 2008, among other events. While WSB has stopped attempting further short squeezes, the community remains a popular place for discussing higher-risk investment ideas and entertainment. In this paper, we measure how the advice disseminated on WSB performs against that of professional analysts working for financial institutions.
2.2. Related research
Social sensing and social media analytics are established research disciplines that use datasets of online communities to analyse a variety of topics. For example, messages disseminated on social media, in some circumstances driven by bots, have been shown to empower social movements (Manikonda et al., Citation2018) and to have political influence on an international scale (Gorodnichenko et al., Citation2018; Howard et al., Citation2011). In a more finance-related context, studies have investigated the monitoring of consumer confidence (Daas & Puts, Citation2014) and the effect of public sentiment on a company’s stock price (Yu et al., Citation2013). Extensive research has attempted to show how particular cues from social media can enable predicting stock price changes (Duz Tan & Tas, Citation2021; Nguyen et al., Citation2015; Sul et al., Citation2017; Theodorou et al., Citation2021) – however, most of these studies mainly consider aggregated data from Twitter (X) and employ sentiment analysis techniques. There are studies that reviewed specific Reddit communities in an adjacent line of work focusing on the forms of interaction in modern online platforms, e.g., the social support mechanisms in r/StopSmoking (De Santo et al., Citation2023), social roles in the r/userexperience community (Kou et al., Citation2018), or the interactions in parenting-related subreddits (Ammari et al., Citation2019; Sepahpour-Fard & Quayle, Citation2022). One study investigated the social interaction on WallStreetBets (Boylston et al., Citation2021), explaining the nature of the community’s conversations and language as of 2020.
In the field of finance and economics research, the behaviour and financial literacy of retail investors has been examined from particular angles, with differing results. For example, Bellofatto et al. (Citation2018) report that while retail investors have varying skills and experience, the more experienced ones invest smartly and achieve higher returns. Hsieh et al. (Citation2020), in contrast, find that retail investors obtain free information via the internet to decide on investments, but exhibit predictable herding behaviour depending on market conditions, potentially leading to unwise investment decisions. Tahir and Danarsari (Citation2023) investigated the impact of overconfidence and other biases on rational investment decision-making of retail investors, finding that users with higher education make better investment decisions. We contribute to this field by investigating the proficiency (and, indirectly, the financial literacy) of retail investors that share their advice on social media.
Fuelled by the 2021 GameStop hype on WallStreetBets, recent research has provided a number of insights on the dynamics and background of the matter. This includes studies on the social dynamics within the WSB community that led to the hype (Lyócsa et al., Citation2022; Semenova & Winkler, Citation2021), on how the episode affected WSB’s users (Haq et al., Citation2022), and on the idea of retail investors fighting against Wall Street (Chohan, Citation2021; DiMuzio, Citation2021; H. Jones & Hietanen, Citation2023). Other studies focused on the financial mechanisms driving the sudden price spike (Aharon et al., Citation2023; Anand & Pathak, Citation2022; Wang & Luo, Citation2021) and on the effect of retail traders on prices and volatility, along with their participation in transactions (Eaton et al., Citation2021; Hasso et al., Citation2021; van der Beck & Jaunin, Citation2021). Further research considered the implications of the events for market regulators and brokerages (Feinstein, Citation2022; C. M. Jones et al., Citation2021; Macey, Citation2021; Umar et al., Citation2021). Yet another study provided an analysis of selected posts from an anthropological perspective (Mendoza-Denton, Citation2021).
The variety of related research shows that WallStreetBets and the GameStop hype can be investigated from multiple angles. However, most recent research focuses on socio-economic and general market effects and implications, or very specific matters such as predicting price movements of a single stock using posts and comments. There are only limited studies about the collective investment skills of WSB and the merits of their investment advice (Bradley et al., Citation2021; Buz & de Melo, Citation2023; Chacon et al., Citation2023), and, as to our knowledge, none that benchmark WSB’s skills against alternative sources for investment advice, such as financial institutions. Additionally, there is a lack of longitudinal research from an information science perspective – studying data that span a longer time frame and a large number of different postings and assessing longer-term effects and trends. This paper presents new insights from this data-driven perspective on the WSB community’s proficiency in order to evaluate how well investors following the investment recommendations of WSB would have performed financially against those following the analyst reports of the largest investment banks.
3. Methodology
In order to have a sufficiently large basis for the analysis, we compiled an extensive dataset consisting of posts from WallStreetBets, along with financial information of all reviewed stocks obtained via the Yahoo! Finance API (specifically historic closing prices and recorded investment bank recommendations), which can be accessed either directly via web request or through Python libraries such as yfinance. As a baseline portfolio, we consider the entirety of S&P 500 stocks, which are widely viewed as representing the broader, established market. On top of the collected data, we establish a methodology for information extraction and evaluation in order to achieve a standardised and comparable analysis across the large number of considered stocks.
3.1. Data acquisition from WallStreetbets
3.1.1. Data compilation
For our study, we review 1,614,976 WSB submissions in total, ranging from January 2018 to March 2022, using the Pushshift service (Baumgartner et al., Citation2020). In order to increase the quality of the data, we exclude all posts that have been deleted or removed (either by their author or moderators), as these posts are also not visible to WSB’s visitors. Prior work by Buz and de Melo (Citation2023) has indicated that it is beneficial for the quality of detected investment signals to filter for posts of a proactive nature, i.e., those anticipating a change in the stock market as opposed to reacting to it. Therefore, we consider the community’s post flair (label) system to select posts that are actually intended to provide predictive value – these include discussions and investment analyses, but exclude memes and so-called “sh**posts” (censored for this paper), among others. This results in a cleaned dataset of 222,301 submissions.
It should be noted that a normal Reddit and WallStreetBets visitor would not be able to access the entirety of posts that are analysed in this dataset during a single visit – instead, the standard post ranking (“hot” posts) are the most successful posts regarding their upvote score of the last few days. If users wish to see other posts, they may choose to view the newest ones, which shows a few hundred items starting with the most recent post, or the top posts (in terms of upvote scores) of a specific time window that the user may select, e.g., day, month, year, or all-time. Our analysis assumes a normalised or equal treatment of all relevant posts as long as they are not removed or deleted, in order to be as representative as possible. In addition, we aggregate posts per 24-hour time window when extracting signals. This simulates a user that visits the community at least two to three times per week to remain up-to-date and observe most relevant posts, which we consider a realistic approximation of WSB users.
3.1.2. Attributes and data examples
Nearly all submissions have a categorical label (referred to as “flair” in Reddit), which in the case of WSB distinguishes between discussions, memes, news, etc. The distribution of submission flairs shows that the WSB community enjoys serious subject discussions, news, and analyses to a similar extent as posts for entertainment purposes, such as memes, gain and loss posts – the flairs in our dataset are distributed as follows: Discussion (121,228), YOLOFootnote1 (32,805), DDFootnote2 (29,762), News (16,492), Options (5,578), Stocks (4,441), Technical Analysis (4,346), Fundamentals (2,340), Chart (1,985), Technicals (1,451), Daily Discussion (1,348), and Futures (525). This excludes submissions labelled as Meme, Gain, Loss, Sh**post (censored), Satire, Storytime, and Donation, which are all intended to be of reactive nature. For instance, Gain or Loss posts are made after an investment has been sold after holding it for some time, while Meme posts react to events in the community or in the stock market.
The flairs help in dividing submissions into two categories: those that are posted proactively in anticipation of stock price movements, e.g., DDs, YOLOs, Discussions, Options, and Technical Analysis, and those that show a person’s reaction to stock price movement, e.g., Gain, Loss, and Meme. shows the beginning of an example for a well-received DD post on WSB about the insurance company The Progressive Corporation ($PGR). The full post is relatively long with 902 words and written in a serious and factual manner, starting with a summary and then explaining all its arguments while incorporating figures to prove or underline them.Footnote3 While there are no specific requirements for how to write an analysis for WSB, DD’s usually present fundamental analysis of a stock (sometimes accompanied by technical analysis of the stock chart) to explain their reasoning – in addition, it is a customary for WSB authors to share their own positions in the discussed stock (“Positions or ban”). , in contrast, shows a very popular meme post that is a representative example for the type of language the users employ (calling other members of the community “degenerates”) and the type of content they share (questioning the community’s investing proficiency).Footnote4 In order to assess the predictive, proactive capabilities of the WSB community, we retain only the submissions for the former set of categories. A comparison of results with the unfiltered dataset shows that focusing on “proactive” flairs consistently improves the quality of buy signals, confirming the assumption.
Figure 1. The beginning of a relatively well-received DD (due diligence) post from WallStreetBets about the insurance company The Progressive Corporation ($PGR) showing the seriousness and level of detail assumed in many of these types of posts.
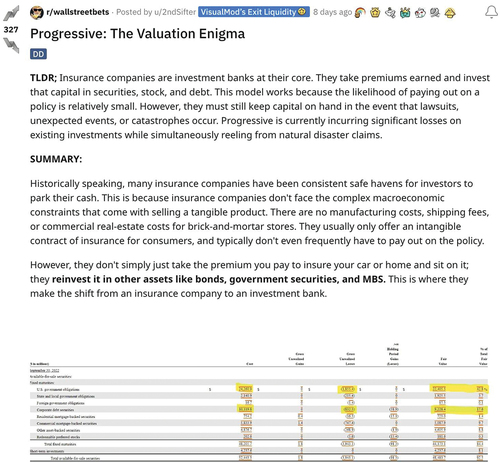
Figure 2. An example meme post from WallStreetBets showing the type of language and content shared frequently in the community.

While the Pushshift service provides a variety of attributes along with each submission, many of them are Reddit-specific metadata that do not provide any informative signal for the purposes of our analysis. Hence, we focus on the data of each submission’s title, body text (also called “selftext” in the Reddit API), timestamp, flair, and score. By combining the titles and body texts, we obtain one text per submission. During this process, we tokenise the text snippets and discard punctuation and repetitive or unwanted symbols and characters.
3.2. Selection and detection of stock tickers
3.2.1. Reference portfolio
We consider the companies of the S&P 500 index as the reference portfolio for comparing investment recommendations, due to its popularity and widespread use among financial professionals as a representative index for the broader market. The S&P 500 covers the largest US companies listed on the stock market, which are distributed across many different industries. In order to become part of the index, a company’s stock must satisfy multiple criteria regarding market capitalisation, amount of traded shares, liquidity, and earnings. The companies included in the index are weighted by their market capitalisation, currently resulting in large technology companies such as Apple, Microsoft, and Google being the most important components of the index.
For the remainder of this study, we thus limit our focus to the list of all companies included in the index (as of March 2022). It has to be noted that this approach may put WSB at a disadvantage compared to other investors, as the WSB community frequently engages in discussion of stocks of smaller companies with higher growth potential that are not listed on the S&P 500. In particular, restricting the scope of the study excludes many of the meme stocks of WSB. On the plus side, this leads to a baseline portfolio that has shown less volatility and potential “pump and dump” activity (stocks that are hyped until a very high increase in price, just before they crash down to a price similar to or slightly higher than before).
For our analysis, we obtain market data on all S&P 500 stocks, encompassing general stock information, the daily price history including open, close, high, low, and trading volume. This data is obtained via the Yahoo! Finance service.
3.2.2. Detection of stock tickers on WSB
For the analysis, we present a detailed approach to detect stock mentions in WSB submissions. For this, we iterate through all post submissions and detect those that contain a particular stock ticker. In each such submission, considering the title and body text, we count the occurrences of a given ticker (in upper case, with and without a prefixed “$”, e.g., “AAPL” and “$AAPL” for Apple, Inc.). For single-character tickers, such as Ford Motor Company’s “$F”, we consider only occurrences with the dollar sign in order to avoid false positives, as our analysis has shown that single-character stock tickers are almost always written with the prefixed “$” by the WSB community in order to avoid confusion, while occurrences without the prefix often do not refer to the stock: For example, the letter “F” is often invoked as an abbreviation for a popular swear word. Additionally, we compile a list of S&P 500 stock tickers that are often used as words or abbreviations with a meaning unrelated to the company, which consists of the following tickers: “ALL”, “IT”, “IP”, “DD”, “NOW”, “ARE”, “SO”, “GM”, “LOW”, “ICE”, “COST”, “INFO”, “KEY”, “KEYS”. These are only considered when mentioned with a prefixed “$”.
Having detected the relevant submissions for each of the stock tickers in the S&P 500 index, we use two approaches to extract investment recommendations. Our default approach computes the score of a ticker as
i.e., it counts the (case-standardised) frequency of buy-related words
from a set
(i.e., “buy”, “call”, “calls”, where calls refer to stock options that anticipate a stock price increase), from which it subtracts the counts of negation phrases
, e.g., “not buy” and “n’t buy” (as in “don’t buy” or “shouldn’t buy”). Similarly, we apply this approach to “hold” and “sell” (including “put”/“puts” for the corresponding stock option). We focus on words written in present tense, as past tense indicates that the post has been written retroactively. In order to decide whether a single post can be deemed a buy, hold, or sell signal, we identify the highest of the three calculated values. As a more sophisticated alternative to this method, we also consider another variant (denoted as “WSB (prox)” later on). In this case,
only considers occurrences of the keywords occurring in close proximity (within 20 characters) of the stock ticker
. After detecting which submissions provide an investment recommendation for a stock, we aggregate the number of recommendations per type for each day, resulting in a dataset that enables an analysis of WSB investment recommendations with a daily granularity. As a requirement for a daily consensus of a stock buy signal, we set a threshold requiring that the number of submissions recommending an investment be 50% higher than the number of submissions with a sell signal (and vice versa for a daily sell signal).
The resulting data is enriched with additional features in order to provide further flexibility during the analysis: the number of all submissions posted on WSB, the average number of mentions over a window of three days, and the weekday. We also compute the relative change of the stock closing price since and after specific time windows: e.g., one day, one week, one month, three months. Furthermore, we calculate the moving average of the closing price for seven, 30, and 90 days, and add a conditional buy signal which only counts WSB’s and the professional investors’ buy signals if the closing price is below the respective moving average. We compile this data for each of the S&P 500 stocks separately.
3.3. Recommendations of professional investors
3.3.1. Data compilation
Investment recommendations of investment banks are usually based on extended analyst reports that are regularly published. We compile a history of investment advice from financial institutions from the aforementioned Yahoo! Finance service. While the full reports are only available upon payment, the final verdicts, e.g., “Buy” or “Hold”, are freely available via the API (see for an example of the recommendations data). We select the top 20 financial institutions within the Yahoo! Finance data with regard to the number of investment recommendations they have made over the reviewed time frame as a benchmark to compare WSB against. While the number of published investment recommendations is not fully correlated with the banks’ size and transaction volume, most of these institutions are nonetheless among the largest investment banks in the world. The count of investment recommendations per institution is distributed as follows: Morgan Stanley (6,724), Credit Suisse (2,416), Citigroup (2,231), Wells Fargo (2,180), Barclays (1,987), Deutsche Bank (1,915), UBS (1,831), JP Morgan (1,507), Raymond James (1,503), BMO Capital (1,132), RBC Capital (1,007), KeyBanc (1,002), Goldman Sachs (859), Bank of America (843), BofA Securities (778), Mizuho (749), Baird (710), Jefferies (632), Piper Sandler (562), Stifel Nicolaus (523). These investment banks play an important role in the industry and are well-known and highly regarded for their analyses and decisions. In light of this, we consider these 20 institutions as a suitable benchmark of financial professionals against which we can assess the performance of recommendation advice offered by WSB.
Table 1. Excerpt of investment bank recommendation data for $AMD extracted from Yahoo! Finance.
3.3.2. Labels
While there are similarities in how reports by different banks are created and published, there is still some variety in the exact wording of positive and negative investment recommendations among the different sources. In order to standardise them, we summarised the 20 most common recommendation types into three different categories:
Buy signals: Contain all recommendations with “Buy”, “Overweight”, “Outperform”, “Strong Buy”, “Positive”, “Market Outperform”, “Sector Outperform”.
Hold signals: Contain all recommendations with “Neutral”, “Hold”, “Equal-Weight”, “Market Perform”, “Sector Perform”, “In-Line”, “Sector-Weight”, “Equal-Weight”, “Peer Perform”.
Sell signals: Contain all recommendations with “Underweight”, “Underperform”, “Sell”.
These three types of signals from each of the top 20 investment banks are aggregated on a daily basis per stock. In total, all investment recommendations of the top 20 professional investors from the Yahoo! Finance data sum up to 42,730 over the reviewed time frame of approximately 50 months. The distribution of these signals is highly skewed, as 24,097 represent a buy 16,079 a hold, and only 2,554 a sell recommendation. We attribute this to three main factors: During the reviewed time frame, the stock markets have shown an upward trend with the S&P 500 gaining approximately 80% in value (despite a temporary 30% drop in March 2020 driven by the COVID-19 related stock market crash) up until the beginning of 2022, when stock prices started falling. Additionally, it can be much more difficult to make accurate sell recommendations due to the nature of the stock market, which tends to increase in small increments in value over longer periods of time, while specific, unexpected events can cause a crash with significant value loss within very short time. Finally, we are only reviewing S&P 500 companies, which are well established and are expected to fulfil specific quality criteria that require a certain degree of financial success.
4. Results
4.1. WSB and institutional portfolios
For every source of investment advice (i.e., WSB and the top 20 investment banks), we define a portfolio consisting of their respective 50 most frequently recommended stocks. Using these portfolios, we can compare how the choices of each investor are distributed across sectors. Our results in show that most of the sources emphasise the sectors Consumer Cyclical and Technology, including Wells Fargo (WEL), Barclays (BAR), KeyBanc (KEY), Jefferies (JEF), and others. We identify a second group including Morgan Stanley (MOR), Citigroup (CIT), UBS, and Deutsche Bank (DEU), which has a stronger focus on the sectors Financial Services and Industrials in addition to Consumer Cyclical, but less interest in the Technology sector. Additionally, some of the banks indicate higher interest in the Healthcare sector, e.g., Mizuho (MIZ), Stifel Nicolaus (STI). A few emphasise other sectors such as Utilities (Morgan Stanley) and Energy (Wells Fargo). There are thus notable differences between the portfolios of similarly large institutions. Potential reasons for this include a different strategic focus or varying domain expertise among their analysts.
Figure 3. Distribution of investment recommendations per source (WSB and top 20 investment banks, abbreviated) across stock market sectors (coloured to indicate sectors of higher interest for each source).
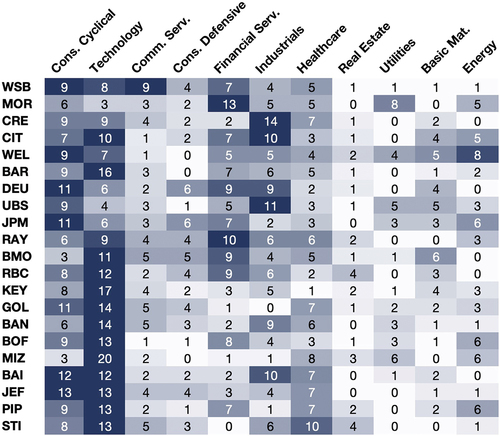
While WSB’s portfolio of S&P 500 stocks exhibits a certain degree of similarity to those of some professional investors, the portfolio is distributed more evenly across a set of sectors, including Consumer Cyclical, Technology, Communication Services, and Financial Services. We conclude from these insights that there is not a single standard investment strategy uniformly adhered to by all professionals, while WSB either hits or misses, but instead there are many different opinions and foci depending on each investor’s inclinations and capabilities. The fact that WSB’s portfolio is actually fairly similar to multiple of the world’s largest investment banks suggests that the community’s focus may be less skewed towards a small part of the stock market than one might expect.
4.2. Detecting top-performing S&P 500 stocks
4.2.1. Identification criteria
In our evaluation, we first consider the following question: Which S&P 500 stocks have been the most successful and how many of them have actually been recommended by the different investors?
In order to answer this question, we consider two scoring methods per stock: (1) the total change in value throughout the reviewed time frame (January 1 2018 to March 22 2022), and (2) the median three-month price development in percent. For example, the 3M Company ($MMM) was priced at 72.96% of its initial value at the end of the reviewed time frame ($205.52 in January 2018 and $149.94 in March 2022), and exhibited a median price change of −0.37% after three months. While the former is a simple indicator for a stock’s success over a time frame, the latter provides a better metric for how consistently the stock price has increased or decreased in value (stocks that have lost value most of the time, but then gained a large percentage at one point are unable to perform very well on the latter). The top 15% of the S&P 500 stocks have been able to increase their stock price to at least 261.35% of the initial value or have shown a median three-month price increase of 7.21% (depending on which feature is chosen to select the top stocks). We considered the stocks in the top 15% with regard to their total growth as well as the stocks in the top 15% with regard to the median three-month growth as the group of best-performing S&P 500 stocks. This group consists of 56 stocks, including Apple, Tesla, Alphabet, Nvidia, Moderna, MSCI, AMD, and Microsoft, among others.
4.2.2. Comparison of recommendations
Having identified the S&P 500’s top-performing stocks, we compared this list to the stocks that WSB and each of the financial institutions recommended over the same time frame. It should be noted that the number of buy signals published by the top 20 professional investors ranges from 285 to 2,693 per source, while our methodology for detecting signals in WSB has detected 9,868 buy signals on WSB. This is a substantial difference due to WSB being a community of millions of users voicing their opinions and analyses. However, WSB’s recommendations are more repetitive, and ultimately amount to a very similar number of unique recommended companies: Overall, the large number of considered WSB recommendation signals still just correspond to a set of 231 unique companies, with some of the investment banks coming close to or surpassing this number, e.g., Morgan Stanley (278), Credit Suisse (261), Citigroup (310), Wells Fargo (296), Barclays (311), and UBS (273). Thus, despite the systematic difference of how many voices publish recommendations (millions of users on WSB versus a single institution per investment bank), the number of unique companies that the investors have recommended is fairly comparable (see ).
Figure 4. Unique discussed stocks and detection rate of best performing stocks per investment signal source (WSB and investment banks).
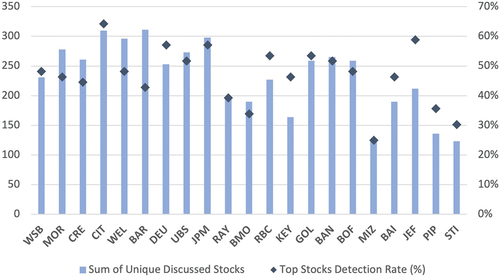
We can thus proceed to answer the question. Our analysis shows that WSB has performed well compared to the investment banks regarding the detection rate of top performing S&P 500 stocks: WSB has detected 27 of the 56 top performing stocks, with seven banks reaching a higher ratio: Citigroup (36), Deutsche Bank (32), JP Morgan (32), RBC Capital (30), Goldman Sachs (30), Bank of America (29), Jefferies (33). Two banks reached the same ratio: Wells Fargo (27), B of A Securities (27). While there are multiple banks reaching a higher ratio of detected top stocks, it has to be noted that all except for RBC Capital and Jefferies have a higher number of unique discussed stocks and therefore a higher chance to mention the right stocks. The results are similar when applying the same method to all S&P 500 stocks that only fulfil one of the two criteria (top 15% in total growth or top 15% in median three-month growth).
4.2.3. Discussion
We conclude from this analysis that not only has the WSB community performed well in detecting the right companies and recommending an investment in them, but for the considered time period, they also produced a better selection than a number of investment banks that employ large teams of analysts. While investment banks require their customers to pay substantial fees to obtain access to their analyses, the recommendations of WSB are freely accessible and even include the reactions and opinions of other community members to each recommendation. However, investment banks tend to provide their analysis in a convenient condensed form, while discerning valuable advice among the numerous posts on WSB requires more effort. For a usual WSB user to adopt our data-driven approach, they would have to spend time to regularly visit the community to recognise the most actively discussed and recommended stocks within a time window such as 24 hours to be able to infer the community consensus on all relevant stocks.
4.3. Evaluation of investment signals
This part of our study assesses in further detail what performance the specific buy recommendations of WSB achieve in comparison to buy recommendations made by professional investors. For this evaluation, we focus on buy signals and omit hold and sell signals, as our prior analysis has shown that sell signals performed poorly, likely due to the general upwards trend of the stock markets (except in a few cases in which sell signals achieved short-term success) and the general difficulty of predicting and timing stock price decreases correctly. Hold signals provide limited value for investors looking to make new investments and are therefore more difficult to include in an investment strategy. In addition, hold signals are usually part of more conservative investment strategies related to stock prices that stagnate or increase slowly. In contrast, WSB focuses on high-risk, high-reward opportunities, which can either be caused by significantly increasing or decreasing stock prices. As WSB’s sell signals do not seem to be valuable, we focus on the buy signals for our analysis. In order to evaluate the buy signals from the data described in the previous section, we create an aggregated overview of all of the 500 reviewed stocks. We define two main metrics for evaluating a buy signal’s success: the accuracy and the price performance. Our first metric, the accuracy of buy signals, measures the percentage of signals that have experienced an increase in value at all. The second metric, the price performance, measures the average price change after a hypothetical investment. For both metrics, we review the stock price on exact time windows after each buy signal, specifically one week, one month, and three months. To test the statistical significance and robustness of our results, we conduct additional tests with randomly sampled data subsets to review their mean performance and standard deviation, and the Kruskal-Wallis -test (Kruskal & Wallis, Citation1952) followed by Dunn’s test for post-hoc comparisons (Dunn, Citation1964) to validate whether the population of WSB’s investment signals are statistically different from the investment banks’ signals. We choose the latter statistical tests instead of ANOVA (Stuhle et al., Citation1989), as the Shapiro–Wilk test (Shapiro & Wilk, Citation1965) indicates that our data is not drawn from a normal distribution (
).
4.3.1. Accuracy
An analysis of the accuracy of buy signals (i.e., ratio of signals that yielded a positive price change) shows that the WSB community is able to attain the level of performance of the top investment banks – the results of the WSB signals filtered with the moving average condition are better than most of the top 20 investment banks. While the short-term performance is quite similar among almost all sources and close to 50%, the differences in accuracy emerge clearly when looking at the average accuracy after the three-month time window. shows that 64.8% of WSB buy signals (for S&P 500 stocks) would have led to a positive price development after three months, ranking WSB close to the best of the top 20 investment banks, with only KeyBanc and B Of A Securities achieving a higher accuracy for the three-month window and only a third of the investment banks above 60% on the time frame. WSB’s accuracy can be slightly improved by filtering for the buy signals that occurred on days when the stock price was below the calculated moving averages of the last 30 or 90 days, with the best accuracy being 67% when the closing price was below the moving average of the last 90 days at the time of the signal. The results show that the accuracy of WSB’s signals are competitive and that they would rank among the best investment banks. However, it should be noted that in general, the accuracy values do not exceed 70%, meaning that for all signal sources, at least 30% of the signals do not yield a profitable result after the assessed time frames. Also, the number of signals (support) for the WSB variants are significantly higher than for the investment banks, which means that in absolute terms, a higher number of “bad” signals originate from WSB. This could cause a higher risk in case an investor only has limited funds for a certain number of investments.
Table 2. Accuracy of buy signals from WSB and selected investment banks (i.e., positive price change after time ; with
as one week, one month, and three months; “WSB (prox)” indicating WSB buy signals detected in proximity of tickers; “MA” indicating the moving average condition), and number of recommendations (
). Most profitable signals per WSB and investment bank groups are highlighted.
While this metric does not reflect how well the buy signals have worked in terms of a relative price increase, it is an indicator of how consistently a buy recommendation could have been trusted. Hence, if an investor’s main concern is reliability and positive price development even if they do not receive the highest yields, this analysis approach could help in evaluating the different sources for investment recommendations.
4.3.2. Price performance
With regard to our second metric, the price performance, WSB’s average performance is even more competitive and it is found to beat most of the investment banks. When filtering WSB buy signals using the moving average condition, the median price increase ranks close to the best investment banks, while the mean outperforms all investment banks after one month and after three months (see ). Our choice of the moving average as an additional condition is due to its ability to serve as a simple method of indicating whether a stock has recently experienced increases in its stock price – if this is the case, a buy recommendation may be too late and therefore reactive. As evinced in , WSB’s buy signals achieve a mean price increase of 8.2% after three months and 9.2% when filtered with a moving average, respectively. In comparison, the best investment banks achieve 9.2% (BofA Securities), 7.6% (KeyBanc), 7.5% (Piper Sandler), and 6.6% (UBS). This means that an investor following all of WSB’s buy signals over the reviewed time frame would have achieved similarly high profits as one that followed the most successful investment banks, when selling after three months. An investor that followed only WSB signals fulfilling the moving average condition would have achieved substantially higher profits. However, the difference between the median and mean performance of WSB together with the higher standard deviation indicate that WSB’s signals seem to have more variance and therefore a higher associated risk.
Table 3. Median (), mean (
), and standard deviation (
) of price performance and standard deviation of buy signals from WSB and selected investment banks (evaluated one week, one month, and three months after signal; “WSB (prox)” indicating WSB buy signals detected in proximity of tickers; “MA” indicating the moving average condition). Most profitable signals per WSB and investment bank groups are highlighted.
4.3.3. Robustness checks
We conduct additional tests to verify the statistical robustness of the obtained results. For this purpose, we (1) assessed 10 randomly sampled subsets of our data and calculate the mean and standard deviation for each subset to investigate whether each source’s performance similarly distributed over random data samples, and (2) we conducted the Kruskal-Wallis -test (Kruskal & Wallis, Citation1952) followed by Dunn’s test (Dunn, Citation1964) to validate whether the population medians of the different investment signal sources are statistically significantly different.
The results shown in show that WSB’s performance is not simply a result of a few outliers, e.g., a few highly profitable meme stocks, but instead are more consistently distributed over the random samples. WSB (prox) obtains the highest standard deviation of the WSB-based signals, meaning that there is more variance in the returns – however, various investment banks exhibit even higher standard deviation. It should be noted here that the per signal source differs and we have measured a negative correlation of
between standard deviation and number of signals.
Table 4. Robustness comparison of price performance per signal source with mean () and standard deviation (
) calculated on a 10-fold random-sample split of the dataset. Most profitable signals per WSB and investment bank groups are highlighted.
As explained above, we further use the Kruskal-Willis -test to ascertain whether there are differences in the median of the population of each signal source. The test yields a sufficiently low p-value (
) to support the hypothesis that the different signal sources have different central tendencies. In order to obtain a more fine-granular understanding of the differences, we conduct a post-hoc analysis with Dunn’s test using Bonferroni correction (with
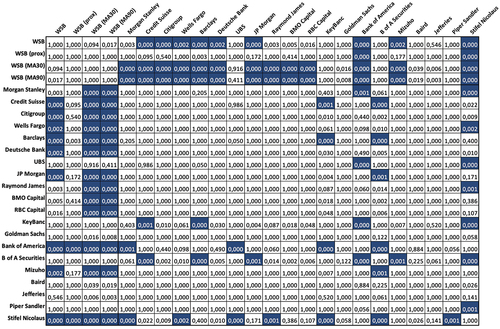
and 24 groups, resulting in a corrected significance level of 0.002). The resulting p-values of the pairwise comparisons are indicated in and show that the signals extracted from WSB show differences to almost all investment banks, with a few exceptions. It seems that the investment signals of KeyBanc, B of A Securities, and Piper Sandler have the most similar tendencies to the WSB signals – coincidentally, these are the three investment banks with the best performance within the reviewed set. Another interesting pattern reveals that a large group of 14 investment banks (specifically Credit Suisse, Citigroup, Wells Fargo, Barclays, Deutsche Bank, UBS, JP Morgan, Raymond James, BMO Capital, Goldman Sachs, Mizuho, Baird, Jefferies, and Piper Sandler) appears to have fairly similar data.
Figure 5. Resulting p-values of Dunn’s test indicating statistically significant difference of population medians in highlighted cells (i.e., (corrected significance level)). The results suggest that WSB’s signal population (except for WSB (prox)) is different from most investment banks (highlighted), while many investment bank signals have an equal population median.
4.3.4. Discussion
These results suggest that following WSB’s buy recommendations appears to have a higher risk, as not all of them lead to a positive price development after three months, while investment banks to a larger extent recommended stocks that actually increased in price. On average, however, investment advice from WSB yielded higher profits, leading to a better financial outcome on average, even if some of the buy signals turned out to be wrong. While these results only account for WSB’s buy signals of S&P 500 stocks, which excludes many of the frequently discussed meme stocks, this does not seem to be a disadvantage for WSB. On the contrary, filtering WSB’s recommendations for more established companies could even be beneficial, as they are rarely as volatile as the stocks of smaller companies, reducing the chances of rapid price increases followed by sudden crashes, which often lead to financial losses for slower or less experienced investors.
The reader should be aware that a large portion of the data covers a phase during which the stock markets have experienced an upwards trend (with some exceptions, e.g., interest rate changes in 2018 or the Covid-related crash in 2020). In 2022, the market has changed significantly due to multiple factors including the war in Ukraine, rising inflation, interest rate hikes, leading to a so-called “bear market” with large losses in some stock prices and markets. Our initial analysis indicates that while the WSB cannot avoid losses in 2022, these seem to be slightly more moderate than the S&P 500’s: While the S&P 500 has changed by −13.06% on average after three months in the first quarter of 2022, the WSB signal baseline indicates a change of −12.00%. In future work, we aim to extract more value from WSB’s investment signals by developing a machine-learning-based methodology to identify signals to trust and those to ignore.
4.4. WSB after the hype
As explained in the first sections of this paper, the WallStreetBets community witnessed substantial growth due to the GameStop hype in January and February 2021: The subscriber count quintupled and even international mainstream news reported on the phenomenon. Clearly, an event of this magnitude has the potential to influence and alter the make-up of a community in multiple respects. In the context of this paper, the most significant question is whether the hype and user growth affected the community’s ability to make valuable investment recommendations. In a recent update to their paper, Bradley et al. (Bradley et al., Citation2021) argue that after the GameStop hype, the quality of investment advice from WSB appears to have deteriorated. The authors hypothesise that after (seemingly) successfully affecting the stock price of GameStop, the community may have tried to repeat the success by initiating new coordinated trading strategies. They conclude that recommendations on WSB should be filtered for quality before placing any trust in them, which is also in line with our study. During our analysis of the dataset, we observed an increase in stocks that can be considered meme stocks (which are often smaller, less established companies) – possibly fuelled by the significant increase in WSB users and their longing for another short squeeze like GameStop’s.
In order to pursue this question, we repeated the analysis from the previous section on data from 2018 to 2020 (pre-hype) and 2021 (post-hype) separately. When viewing WSB recommendations of S&P 500 companies, our analysis shows some differences between the pre- and post-hype performance, but not a complete reversal: Regarding the accuracy of buy signals, WSB does seem to have degraded in quality quite noticeably, as pre-hype buy signals achieved 79% accuracy for all buy signals and 100% for those with a moving average condition (MA30/90), while post-hype signals achieved 55% and 67%, respectively. In the same comparison, the investment banks have maintained similar levels of accuracy or even improved in the post-hype time frame. There is a pre- and post-hype difference in the price performance as well: in the pre-hype period, WSB achieves an 8.2% average price change after three months for all buy signals and approximately 11% for buy signals with the MA30/90 condition, which decreases to 7.3% and approximately 9%, respectively, when only the post-hype period is considered. However, the investment banks also achieved lower average profits in the post-hype time frame, which enables WSB to perform similarly to the best investment bank (BMO Capital, 9.15%), continuing to rank close to the top of the comparison (followed by KeyBanc at 8.2%, Credit Suisse at 7.15%, and UBS at 7.14%).
We conclude from our analysis that while there are some differences between the pre- and post-hype states of WSB, they are less visible when focusing on stocks of the established companies listed on the S&P 500. The lower price performance in 2021 apparently affected all investors and might have been due to larger market effects, as WSB continues to achieve a leading price performance in the post-hype time frame.
5. Conclusion
Our results show that the community of WSB not only competes with, but in some cases even outperforms the returns of analyst reports published by top 20 investment banks for S&P 500 stocks. WSB is able to recognise high-potential stocks better than professional analysts, and achieve similarly high average returns as the best of the reviewed investment banks over the reviewed time frame. When WSB’s signals are filtered using a moving average condition, the average returns are significantly higher than those of banks. However, the community’s performance evaluation also indicates higher associated risk.
Our analysis indicates that WSB as an openly accessible social community can be a valuable source of information for retail and professional investors due to its open collaborative process of discussing stock market trends and recommending investments. It is important to filter WSB’s wealth of signals using suitable techniques, e.g., focusing on more established companies like those of the S&P 500 index, calculating a daily consensus, and filtering signals using reproducible indicators. Actively discussed meme stocks should be handled with care due to their higher risk and the difficulty of identifying the right time to invest in them. Since the GameStop hype, meme stocks have appeared more frequently on WSB for some time, which makes filtering more difficult as well as important. If social communities like WSB continue to grow and to prove the quality of their content, this may profoundly change the way investors seek financial advice, especially retail investors, who are on the rise due to the increasing popularity of mobile trading applications.
Our research shows that investment signals extracted from the community of WallStreetBets have been able to not only result in profitable investments, but even compete with the returns of the largest investment banks. The methodology that we apply to identify investment signals is simple and can be adapted by regular users that visit the community in a frequency sufficient to grasp the community’s consensus on specific stocks. This confirms our main hypothesis that WSB democratises investing by making investment recommendations accessible for users that do not have the time or knowledge to do extensive research on the stock market.
5.1. Practical implications
We have identified multiple implications of our work, which we list below:
5.1.1. Implications for retail investors
The results of this work suggest that the WallStreetBets community can indeed be a valuable source for investment advice. With the emergence of a democratic and freely accessible source for investment advice such as WSB, the growing group of retail investors gains access to an additional information source that differs from popular sources like financial news outlets or the signals of investment banks. It is important that the investment advice shared on WSB is aggregated (e.g., daily) and evaluated by the community through votes and comments in order to ensure a better quality of signals. However, there are some risks and limitations to consider, which we list in Section 5.2. In general, we expect these communities to grow further in terms of user numbers and their relevance for the market.
5.1.2. Implications for professional investors
Professional investors, while presumably being well informed about the stock markets already, can leverage social communities like WSB to achieve a better understanding of retail traders, who constitute an increasingly important group that is sometimes able to exert notable influence on the stock markets. Financial institutions can benefit from valuable insights into market trends and sentiment among retail investors. In addition, amateur investors who often derive their investment advice from their daily lives may offer diverse ideas that professional investors do not usually encounter.
5.1.3. Implications for regulators and the market
With the increasing popularity of communities like WSB, regulators and other participants of the market (e.g., brokerages) may need to develop techniques to handle the growing impact of retail investors. For example, it may be relevant for regulators to define new legislation that requires certain rules and guidelines within these communities to avoid unethical practices. While it is unlikely that another meme stock rally similar to GameStop’s happens again, understanding the mechanisms of these communities and trends that emerge among retail investors can be helpful to anticipate phases of growing demand for specific securities.
5.2. Risks and limitations
All investors should conduct their own review and analysis before investing any money, rather than relying solely on WSB posts. While our results show that an investment strategy following the techniques described in this paper can yield profits that outperform the markets, there are various risks and limitations that readers and practitioners ought to be aware of. First of all, WSB authors are anonymous and only held accountable for the advice they share to a very limited extent – their posts can be voted on and discussed, and content that is deemed to be of low quality or as violating the community’s rules can be deleted by the moderators. Authors might share a high-quality analysis that reads well, but later turns about to be terrible advice – in this case, the community tends to either forget or makes fun of the original analysis in later posts.
As mentioned in Section 4.3.3., the “accuracy” of WSB’s investment signals (i.e., achieving a price increase after time ) only ranged between 50% and 70% (similarly for the investment bank recommendations). This means that a significant portion of the identified recommendations lost money (up to 47% for the shortest time frame) – a strategy in particular that cannot follow all identified signals (e.g., due to limited funds), but instead only selects a subset, may end up with the bad signals and lose (parts of) their money. Also, the timing is important – when a new post is taken seriously too early, i.e., before the community has had time to critically review (and potentially delete) it, its advice may be particularly bad; and when a potential investor waits too long after a signal was published, it may be too late to invest if it is a short-term topic that is discussed (e.g., a company’s earnings to be published a few hours after posting). The profitable returns that we identified were obtained when all qualifying investment signals were followed within a day of their posting. In addition, our study requires investment signals to be identified from aggregated WSB posts – therefore, an investor following the recommendations of a single post may experience worse results.
The more investors follow WSB’s signals, the more the (potential) predictive value of an investment signal will be distorted – even bad signals can lead to (at least short-term) profits if a sufficient number of users decide to invest and thereby affect the stock price. Vice versa, if an investor is too late to a stock that has been driven by herding behaviour, they are likely to experience losses as the other investors start selling their positions. It should also be noted that we conducted a historic analysis on a limited time frame – however, we cover phases of positive and negative market movements and show that WSB performed consistently over time, which alleviates this limitation. The fact that Reddit as well as Yahoo! Finance, the two main data sources for this work, have restricted access to their data significantly since this study was implemented, makes it more difficult (or at least more costly) to build a production system that uses the strategy presented in this paper in real time.
Disclosure statement
No potential conflict of interest was reported by the author(s).
Additional information
Funding
Notes
1. YOLOs are high-risk and high-value investments usually on a single stock.
2. DD stands for Due Diligence, which generally consists of a detailed analysis of a stock or industry along with an explanation of why its value is likely to increase or decrease in the future.
3. Accessible via www.reddit.com/zy8y3e.
4. Accessible via www.reddit.com/zyd7k0.
References
- Agrawal, P., Buz, T., & de Melo, G. (2022). WallStreetBets beyond GameStop, YOLOs, and the moon: The unique traits of Reddit’s finance communities. In AMCIS 2022 Proceedings (Vol. 8). https://aisel.aisnet.org/amcis2022/sig_sc/sig_sc/8/
- Aharon, D. Y., Kizys, R., Umar, Z., & Zaremba, A. (2023). Did david win a battle or the war against goliath? dynamic return and volatility connectedness between the gamestop stock and the high short interest indices. Research in International Business and Finance, 64, 101803. https://doi.org/10.1016/j.ribaf.2022.101803
- Ammari, T., Schoenebeck, S., & Romero, D. (2019). Self-declared throwaway accounts on reddit: How platform affordances and shared norms enable parenting disclosure and support. Proceedings of the ACM on Human-Computer Interaction, 3(CSCW), 1–30. https://doi.org/10.1145/3359237
- Anand, A., & Pathak, J. (2022). The role of reddit in the gamestop short squeeze. Economics Letters, 211, 110249. https://doi.org/10.1016/j.econlet.2021.110249
- Baumgartner, J., Zannettou, S., Keegan, B., Squire, M., & Blackburn, J. (2020). The Pushshift Reddit Dataset. In Proceedings of the International AAAI Conference on Web and Social Media (Vol. 14). https://doi.org/10.1609/icwsm.v14i1.7347
- Bellofatto, A., D’Hondt, C., & De Winne, R. (2018). Subjective financial literacy and retail investors’ behavior. Journal of Banking & Finance, 92, 168–181. https://doi.org/10.1016/j.jbankfin.2018.05.004
- Boylston, C., Palacios, B., Tassev, P., & Bruckman, A. (2021). WallStreetBets: Positions or ban. arXiv:2101.12110v1. https://doi.org/10.48550/arXiv.2101.12110
- Bradley, D., Hanousek, J., Jr., Jame, R., & Xiao, Z. (2021). Place your bets? The market consequences of investment advice on Reddit’s wallstreetbets. Social Science Research Network, 3806065. https://doi.org/10.2139/ssrn.3806065
- Brush, S., & Spezzati, S. (2017). How do you put a price on investment research?. Bloomberg Businessweek. https://www.bloomberg.com/news/articles/2017-07-07/how-do-you-put-a-price-on-investment-research-quicktake-q-a
- Buz, T., & de Melo, G. (2023). WallStreetBets: An analysis of investment advice democratization. In Proceedings of the 56th Hawaii International Conference on System Sciences (Vol. 56, pp. 2150). University of Hawaiʻi at Mānoa Library. https://hdl.handle.net/10125/102898
- Chacon, R. G., Morillon, T. G., & Wang, R. (2023). Will the reddit rebellion take you to the moon? evidence from wallstreetbets. Financial Markets and Portfolio Management, 37(1), 1–25. https://doi.org/10.1007/s11408-022-00415-w
- Chohan, U. W. (2021). Counter-hegemonic finance: The gamestop short squeeze. SSRN Electronic Journal, 3775127. https://doi.org/10.2139/ssrn.3775127
- Curry, D. (2024). Stock trading & investing app revenue and usage statistics. Business of Apps. https://www.businessofapps.com/data/stock-trading-app-market/
- Daas, P. J., & Puts, M. J. (2014). Social media sentiment and consumer confidence. Technical report. ECB Statistics Paper.
- De Santo, A., Moro, A., Kocher, B., & Holzer, A. (2023). Helping each other quit online: Understanding user engagement and real-life outcomes of the r/stopsmoking digital smoking cessation community. ACM Transactions on Social Computing, 6(1–2), 1–30. https://doi.org/10.1145/3564745
- DiMuzio, T. (2021). GameStop capitalism. Wall street vs. The reddit rally (part I). The Bichler and Nitzan Archives. http://bnarchives.yorku.ca/673/
- Dunn, O. J. (1964). Multiple comparisons using rank sums. Technometrics, 6(3), 241–252. https://doi.org/10.1080/00401706.1964.10490181
- Duz Tan, S., & Tas, O. (2021). Social media sentiment in international stock returns and trading activity. Journal of Behavioral Finance, 22(2), 221–234. https://doi.org/10.1080/15427560.2020.1772261
- Eaton, G. W., Green, T. C., Roseman, B., & Wu, Y. (2021). Zero-commission individual investors, high frequency traders, and stock market quality. SSRN Electronic Journal, 3776874. https://doi.org/10.2139/ssrn.3776874
- Feinstein, Z. (2022). Short communication: Clearing prices under margin calls and the short squeeze. SIAM Journal on Financial Mathematics, 13(4), SC113–SC122. https://doi.org/10.1137/22M147877X
- Gorodnichenko, Y., Pham, T., & Talavera, O. (2018). Social media, sentiment and public opinions: Evidence from #Brexit and #USElection. Technical report. National Bureau of Economic Research.
- Gurrola-Perez, P., Lin, K., & Speth, B. (2022). Retail trading: An analysis of current trends and drivers. Available at SSRN 4562259.
- Haq, E.-U., Braud, T., Lee, L.-H., Vallapuram, A. K., Yu, Y., Tyson, G., & Hui, P. (2022). Short, colorful, and irreverent! a comparative analysis of new users on wallstreetbets during the gamestop short-squeeze. In Companion Proceedings of the Web Conference 2022 (pp. 52–61).
- Hasso, T., Müller, D., Pelster, M., & Warkulat, S. (2021). Who participated in the GameStop frenzy? Evidence from brokerage accounts. TAF working paper No. 58/February 2021, SSRN 3792095.
- Howard, P. N., Duffy, A., Freelon, D., Hussain, M. M., Mari, W., & Maziad, M. (2011). Opening closed regimes: What was the role of social media during the Arab Spring? Social Science Research Network, 2595096. https://doi.org/10.2139/ssrn.2595096
- Hsieh, S.-F., Chan, C.-Y., & Wang, M.-C. (2020). Retail investor attention and herding behavior. Journal of Empirical Finance, 59, 109–132. https://doi.org/10.1016/j.jempfin.2020.09.005
- Jones, H., & Hietanen, J. (2023). The r/wallstreetbets ‘war machine’: Explicating dynamics of consumer resistance and capture. Marketing Theory, 23(2), 225–247. https://doi.org/10.1177/14705931221114172
- Jones, C. M., Reed, A. V., & Waller, W. (2021). When brokerages restrict retail investors, does the game stop? Columbia Business School Research Paper Forthcoming. https://doi.org/10.2139/ssrn.3804446
- Kou, Y., Gray, C. M., Toombs, A. L., & Adams, R. S. (2018). Understanding social roles in an online community of volatile practice: A study of user experience practitioners on reddit. ACM Transactions on Social Computing, 1(4), 1–22. https://doi.org/10.1145/3283827
- Kruskal, W. H., & Wallis, W. A. (1952). Use of ranks in one-criterion variance analysis. Journal of the American Statistical Association, 47(260), 583–621. https://doi.org/10.1080/01621459.1952.10483441
- Lyócsa, Š., Baumöhl, E., & Vỳrost, T. (2022). YOLO trading: Riding with the herd during the GameStop episode. Finance Research Letters, 46, 102359. https://doi.org/10.1016/j.frl.2021.102359
- Macey, J. R. (2021). Securities regulation as class warfare. Columbia Business Law Review Forthcoming, SSRN 3789706. https://doi.org/10.2139/ssrn.3789706
- Manikonda, L., Beigi, G., Liu, H., & Kambhampati, S. (2018). Twitter for sparking a movement, reddit for sharing the moment: #metoo through the lens of social media. arxiv:1803.08022.
- Mendoza-Denton, N. (2021). “Sticking it to the man”: R/wallstreetbets, generational masculinity and revenge in narratives of our dystopian capitalist age 1. Anthropology Now, 13(1), 91–99. https://doi.org/10.1080/19428200.2021.1903593
- Nguyen, T. H., Shirai, K., & Velcin, J. (2015). Sentiment analysis on social media for stock movement prediction. Expert Systems with Applications, 42(24), 9603–9611. https://doi.org/10.1016/j.eswa.2015.07.052
- Reddit, Inc. (2021). Dive into anything.
- Reed, A. V. (2013). Short selling. Annual Review of Financial Economics, 5(1), 245–258. https://doi.org/10.1146/annurev-financial-110311-101813
- Semenova, V., & Winkler, J. (2021). Reddit’s Self-Organised Bull Runs. arXiv:2104.01847v1.
- Sepahpour-Fard, M., & Quayle, M. (2022). How do mothers and fathers talk about parenting to different audiences? stereotypes and audience effects: An analysis of r/daddit, r/mommit, and r/parenting using topic modelling. In Proceedings of the ACM Web Conference 2022, WWW ‘22 (pp. 2696–2706). Association for Computing Machinery, New York, NY, USA.
- Shapiro, S. S., & Wilk, M. B. (1965). An analysis of variance test for normality (complete samples). Biometrika, 52(3–4), 591–611. https://doi.org/10.1093/biomet/52.3-4.591
- Stuhle, L., & Wold, S. (1989). Analysis of variance (anova). Chemometrics and Intelligent Laboratory Systems, 6(4), 259–272. https://doi.org/10.1016/0169-7439(89)80095-4
- Subredditstats.com. (2021). r/wallstreetbets stats.
- Sul, H. K., Dennis, A. R., & Yuan, L. (2017). Trading on twitter: Using social media sentiment to predict stock returns. Decision Sciences, 48(3), 454–488. https://doi.org/10.1111/deci.12229
- Tahir, A. N., & Danarsari, D. N. (2023). App-based investment platform and investment decision making: A study of retail investor behavior in Indonesia. Eduvest-Journal of Universal Studies, 3(7), 1258–1272. https://doi.org/10.59188/eduvest.v3i7.859
- Theodorou, T.-I., Zamichos, A., Skoumperdis, M., Kougioumtzidou, A., Tsolaki, K., Papadopoulos, D., Patsios, T., Papanikolaou, G., Konstantinidis, A., Drosou, A., & Tzovaras, D. (2021). An ai-enabled stock prediction platform combining news and social sensing with financial statements. Future Internet, 13(6), 138. https://doi.org/10.3390/fi13060138
- Umar, Z., Gubareva, M., Yousaf, I., & Ali, S. (2021). A tale of company fundamentals vs sentiment driven pricing: The case of GameStop. Journal of Behavioral and Experimental Finance, 30, 100501. https://doi.org/10.1016/j.jbef.2021.100501
- Van der Beck, P., & Jaunin, C. (2021). The equity market implications of the retail investment boom. Swiss Finance Institute Research Paper, (21–12). SSRN 3776421. https://doi.org/10.2139/ssrn.3776421
- Wang, C., & Luo, B. (2021). Predicting $GME stock price movement using sentiment from reddit r/wallstreetbets. In Proceedings of the Third Workshop on Financial Technology and Natural Language Processing (pp. 22–30).
- Yu, Y., Duan, W., & Cao, Q. (2013). The impact of social and conventional media on firm equity value: A sentiment analysis approach. Decision Support Systems, 55(4), 919–926. https://doi.org/10.1016/j.dss.2012.12.028