
 ?Mathematical formulae have been encoded as MathML and are displayed in this HTML version using MathJax in order to improve their display. Uncheck the box to turn MathJax off. This feature requires Javascript. Click on a formula to zoom.
ABSTRACT
Reflecting on the results of the shadow economy survey, as conceptualized by Putnis and Sauka and implemented in Ukraine in 2019 for the first time, the goal of the current article is two-fold. First, it offers an overview of the results for the years 2017 and 2018 and estimates the shadow economy in the country at 38.3% of GDP for 2017 and 38.5% for 2018. Second, it suggests possible advantages in the use of direct methods to estimate the level of the shadow economy in a country and explore the motives pushing entrepreneurs to remain in the shadow. The discussion is then framed to conceptualize the distinction between shadow economy and informality. We conclude by suggesting that a better understanding of the entangled relations lying behind the reasons to stay in the shadow can help us better address the issue and propose measures that could help bring business out of the shadow.
Introduction
Across regions of the world, incomes are hidden, companies fail to report activities to the authorities and workers face situations of precarious employment. This is not a minority practice. A recent ILO report estimates that 2bn workers are active in the informal economy (Kuhn, Milasi, and Yoon Citation2018), with figures growing even bigger if we consider the effects of the COVID pandemic.Footnote1 In addition to putting workers in a precarious position, depriving them of employment security, long-term perspectives and even medical and social security, the shadow economy significantly impacts state capacity – reducing the amount of taxes and thus state’s capacity of intervention and discouraging foreign investments. Accordingly, national governments and international organizations (ILO, the World Bank, and more recently the European Commission) have, with growing persistence, proposed measures to curb the informal sector (Eurostat Citation2019, World Bank Citation2019) and tackle issues such as informal labour, tax fraud, informal practices, and payments (see Labour Market Observatory Citation2018, Williams and Bezeredi Citation2018), Williams and Lapeyre Citation2017).
Table 1. Adjectives and nouns used to denote cash-in-hand work
Across Europe alone, the shadow economy is estimated at around 20% of GDP (Medina and Schneider Citation2018) with higher figures (25–45%) in Eastern Europe and post-Soviet regions (Medina and Schneider Citation2018), labelling the post-socialist region as a low-performing one. While some attempted to explain dysfunctional relations between the state and business sectors as stemming from state capture or patrimonialism (Cooley and Sharman Citation2015; Furstenberg Citation2018), few efforts have been devoted to distinguishing seriously harmful practices from others that could be considered needed to unblock some vicious circles or simply allow people to survive in spite of state ineffectiveness (Polese Citation2016). Indeed, the regional literature abounds with works clustering together informality, corruption, shadow, and informal economy or treating them as synonyms. Not only is this confusing for social science debates and makes it difficult to compare local phenomena with tendencies from other regions (Polese Citation2021). Even more importantly, it hinders the conceptualization of ways to tackle the negative sides of informality in practice. At the end of the day, if informality is everywhere, addressing it means to elaborate some sort of theory of everything, which could have the effect of suffocating inventivity (Phelps Citation2021), innovation potential and practices that could eventually boost governance rather than damaging it (Jaffe and Koster Citation2019). In contrast, by breaking up informality into smaller components, it becomes possible to identify and thus address smaller areas of governance and conceptualize interventions that address precisely and exactly a given aspect and are thus more likely to be successful.
This article makes two contributions to the study of informality. Empirically, it shares the result of the shadow economy survey for 2017 and 2018 in Ukraine. These results are used for the calculation of the shadow economy index for Ukraine estimated as a percentage of GDP. Already established as an annual exercise for Latvia, and the Baltics since 2010, the survey has been applied to Moldova and Romania (since 2016), Poland (2015–2016) and Kosovo (in 2018). In 2019 it was also implemented in Georgia, Russia and Kyrgyzstan (2019) within the framework of the project “SHADOW: An exploration of the nature of informal economies and shadow practices in the former USSR region”. The methodology was then replicated in Ukraine and used for direct measurement of underground activities broken up into distinct values for envelope wages, unreported company income and underreported number of employees (Putniņš and Sauka Citation2015). While quantitative approaches are useful to estimate the size of shadow economies, direct approaches can also be used to integrate these data and look for deeper correlations between the persistence of shadow transactions and some societal tendencies that are not necessarily economic. In many respects, more important than debating whether a given country’s shadow economy is at 35%, 38% or 40% of its GDP, from a policy and possibly science perspective it is more important to know why people engage in such practices, the main sectors where this is more likely or frequent, and what could encourage them to come out of the shadow.
In our approach, we suggest that shadow economies are not always sustained by a desire to maximize income (and minimize the amount paid in taxes). We remain open to the possibility that unrecorded transactions stem from social or cultural motives, which is why we believe it is crucial to draw a line between the concepts of informality and shadow economy. The definition of informality encompasses any activities that eventually bypasses the state or the overarching entity regulating the life of that group or society (Polese Citation2021). This definition is purposefully intended to include monetary and non-monetary transactions, as well as short- and long-term ones so to look at informality beyond a mere economic or economistic lenses (Ledeneva Citation2018, 2018b). The shadow economy is much narrower as a category and features three economic components: under-reported income, employees and wages (Putniņš and Sauka Citation2015). Accordingly, the approach proposed in this article is to measure, as a share of the GDP, transactions and evaluate tendencies that weaken state capacity in terms of receivable income. After a section on the distinction between informality and the shadow economy, we explain the methodological choices of the survey and the methods employed. The following section presents the results of the survey. As we will show, it enables us to identify the sectors that are more affected by shadow transactions and the main tendencies of business actors in a given country. However, we go beyond a mere economistic understanding of the shadow economy. This will be shown in the last section where we will suggest that, by seeking the motives that keep entrepreneurs within the shadow, and interpreting the results not only through economistic but also socio-political lenses, we may gain an understanding of the hidden dynamics behind the tendency to underdeclare income, salaries, or number of employees. In turn, we suggest that this understanding may increase our capacity to interpret and propose corrective measures.
Why the study of shadow economies needs to take into account definitions of informality
Early and mainstream approaches to the understanding of the non-formal elements of the economy tended to cluster together all economic activities that fell outside the radar of state institutions. Given the scarce availability of evidence and broad studies, few – if any – tools had been devised to distinguish the different kind of informal transactions. As a result, limited reflection (and distinction) between illegal, extra-legal, shadow, and licit economies have been generated. Instead, the ideas that modernization and economic effectiveness would eventually reduce informality received a good amount of consensus (Lewis Citation1954).
Things evolved differently. In spite of criticisms about the excessively broad scope of informality approaches and the difficulty to measure it (Bromley Citation1978; Lipton Citation1984), informality studies developed in different directions. Indeed, a recent paper has identified no less than six different categories of informality: Economic, legal, technical, organizational, political, cultural and over a hundred sub-categories (Boanada-Fuchs and Boanada-Fuchs Citation2018). By the early 1970s, debates on informality had already proposed a number of distinct, and sometimes contrasting, approaches across world regions and disciplines ranging from anthropological perspectives on informal economies (Hart Citation1973) to literature on self-help by urban planners (Turner Citation1968), conceptualization of a whole informal sector by economists (Harris and Todaro Citation19701970), in addition to the growing attention towards informal and precarious employment by the International Labour Organization (ILO 2018). Not surprisingly, when classifications of informal have been attempted, a large variety of terms to define the same, or similar phenomena have been discovered, as the by Williams below suggests.
As debates developed, different world regions saw the emergence in popularity of different concepts, discipline, and approaches ranging from planning (Innes, Connick, and Booher Citation2007; Roy and AlSayyad Citation2004) to public policy (Paula Áureo and Scheinkman Citation2010; Roy Citation2009; Falla and Valencia Citation2019), urban governance (Sarmiento and Tilly Citation2018; Haid and Hilbrandt Citation2019) resistance (Santini, Ruth, and Kevlihan Citation2020; Murru and Polese Citation2020) the politics of the everyday (Bayat Citation2000). This disciplinary diversity has come to define not only a different use of the same words in different regions but a real geography of informality that has been summarized in below.
Table 2. Geography of informality
Possibly inspired by Ledeneva’s work on blat (1998), post-socialist spaces have witnessed a sharp rise in the study of informality and its conceptualization well beyond its initial economic understanding. Scholars engaged with informality by exploring political corruption (Darden Citation2008; Ledeneva Citation2013; Stefes Citation2006), informal power (Gel’man Citation2004; Hayoz Citation2015; Ledeneva Citation2010), the boundary between informal payments and corruption (Denisova-Schmidt Citation2020; Osipian Citation2012) and the use of connections to gain access to the labour market (John, Williams, and Rodgers Citation2008). The breadth and variety of studies available have permitted to look at informality as a complex web of social and economic obligations (Hann and Hart Citation2009; Henig and Makovicky Citation2017; Morris Citation2017) that can be observed as stronger in areas where the state is allegedly weak (Rasanayagam Citation2011; Rekhviashvili Citation2017; Morris and Polese Citation2011) or in countries where informal institutions dominate over formal ones (Peng et al. Citation2009). The below summarizes the main possible tendencies in post-socialist informality studies and distinguishes forms of informality that are more socially embedded from those that can be framework in a more economic approach.
Table 3. Flavours of informality. (source Polese Citation2019)
Table 4. The legal – illegal dichotomy
Thanks to the variety of different specializations, post-socialist spaces seem an ideal place to start a discussion on the relationship between shadow economy and informality. Indeed, we can find a sufficient variety of different definitions and approaches to draw a clear line between the two. According to a number of empirical works (Medina and Schneider Citation2018; Putniņš and Sauka Citation2020), shadow economy is mostly viewed as the result of under-reporting (income, salaries, number of employees). Informality is, in contrast, approached from a broader perspectives so that it may include shadow economies but, under the same framework, a variety of other studies have focused on non-monetary and non-economic practices that entangle the lives of individuals both as economic actors and citizens of a given state. Thanks to the work of scholars interested in a deeper account on the role of informality in the region, attempts have been made to understand shadow transactions using alternative methods. These have ranged from employment surveys – used to shed light on the nature of informal or unregistered employment (Williams and Alexandra Horodnic Citation2016) – to mixed methods to better understand the nature and dynamics of shadow economies (Williams and Franic Citation2016). Eventually, a methodology based on direct measurement shadow activities based on a nationally representative sample has been conceptualized and developed, first in Latvia (Putniņš and Sauka Citation2015) and then expanded to other post-socialist countries (Putniņš and Sauka Citation2020). The findings of the survey have suggested the separation between shadow economy and informality that is central to this paper. The starting idea is that, while rational choice theory could explain from a short-term perspective the desire to remain in the shadow and hide revenues, long-term perspectives are likely to be more complex. By force of this, we can refer to informality as the aggregate of activities that happen beyond the control of the state because they are concealed (Routh Citation2011) or performed on areas where state control is limited (Polese, Kovács, and Jancsics Citation2018). It could be said that the shadow economy is the visible and measurable tendency to bypass the state, whereas informality is the framework allowing us to explain and understand why people are willing to remain in the shadow, avoid the state, not respect state authority and in general bypass the state (Polese Citation2021).
Direct and indirect measurements of shadow economies: methodological and empirical reflections
Generally, shadow economy is a term used to refer to economic activities and income earning situations that eventually circumvent government regulation, taxation, or observation (Sauka Citation2014; Medina and Schneider Citation2018). Such activities are deliberately concealed from public authorities to avoid payment of income, value added or other taxes and social security contributions, or to avoid compliance with certain legal labour market standards such as minimum wages, maximum working hours, or safety standards and administrative procedures. The shadow economy thus focuses on productive economic activities that would normally be included in national accounts, but which remain underground due to tax or regulatory burdens (Polese and Schneider Citation2021:5). Economistic understanding of shadow economies seek a correlation between a given governmental framework or measure and the reaction of economic and business actors. Schneider and Medina (Citation2017) identifies a set of indicators and variables that can be associated with the size and persistence of shadow economies.
Tax burdens: the bigger the difference between the total labour cost in the official economy and after-tax earnings (from work), the greater the incentive to reduce the tax wedge and work in the shadow economy (Johnson, Kaufmann, and Zoido-Lobatón Citation1998; Dell’Anno, Gómez-Antonio, and Alañon-Pardo Citation2007).
Quality of institutions: perception of the tax system as unfair or corrupted increases the desire to remain in the shadow. When institutions can be strengthened and fiscal policy moves closer to the median voter’s preferences shadow economy rates may drop (Dreher, Kotsogiannis, and McCorriston Citation2009; Teobaldelli and Schneider Citation2013; Williams and Schneider Citation2016).
Regulation: Regulations, including labour market regulations and barriers to trade, lead to a substantial increase in labour costs in the official economy and provide another incentive to work in the shadow economy (Johnson, Kaufmann, and Zoido-Lobatón Citation1998; Kucera and Roncolato Citation2008; Friedrich Schneider Citation2011).
Public sector: An increase in the shadow economy affects state revenues and thus the services provided by the state. This may then lead to increase in tax rates with subsequent further expansion of the shadow economy (Johnson, Kaufmann, and Zoido-Lobatón Citation1998; Feld and Schneider Citation2010). Size of the official economy: The higher the unemployment quota and/or the lower GDP growth, the greater the incentive to work in the underground economy (Schneider and Williams Citation2013; Feld and Schneider Citation2010). Self-employment: The higher the rate of self-employment, the more activities can be performed in the shadow economy (Schneider and Williams Citation2013; Feld and Schneider Citation2010)
Unemployment rate: The higher the rate of unemployment, the higher the probability of work in the shadow or criminal activities, since unemployed people look for alternative opportunities (Schneider and Williams Citation2013; Williams and Schneider Citation2016).
Size of the agricultural sector: The larger the agricultural sector, which is usually less regulated and farther from central government structures (Hassan and Schneider Citation2016).
Use of cash: The larger the underground economy, the more cash will be used. Also, the more the tendency to use cash the more the opportunities to hide transactions (Hassan and Schneider Citation2016; Williams and Schneider Citation2016)
Share of the labour force: The higher the shadow economy, the lower the official labour force participation rate (Schneider and Williams Citation2013; Feld and Schneider Citation2010)
The indirect methods that have been used to identify to the above correlations are unintrusive in that they rely on secondary sources and offer figures that can be used as starting point to quantify the shadow economy in a given country. But these very figures do not provide a solid explanation about why people decide to remain in the shadow, a thing that could be due to economic but also cultural or societal reasons. Besides, they measure unrecorded and unregistered flows without enabling them to distinguish between illegal transactions and those that are inherently legitimate but remain unreported.
Direct approaches have been criticized from other standpoints, from risks of under-reporting to the incapacity to take into account figures from unregistered companies (Pacula et al. Citation2010; Beyer Citation2001; Merriman Citation2010). However, being sampling based only on registered companies, they are unlikely to take illegal production and activities into account, which means they allow to focus on the shadow component of the economy. Besides, they offer a space to explore the causes of engagement with shadow economies.
Footing on the above reflections, referring to “shadow economy” as the legal production of goods and services by registered firms deliberately concealed from public authorities, we measured the level of the shadow economy relying on a direct approach. The survey was conducted by the Kyiv International Institute of Sociology, on a sample of 800 business owners and top managers of companies from all regions of Ukraine, except for AR Crimea and the temporarily occupied NGCA of Donetsk and Luhansk oblasts. The survey sample was random, stratified, and covered all economic sectors and companies’ size, from macro to micro. KIIS was then instructed on how to calculate the Shadow Economy Index based on the method developed by Putniņš and Sauka (Citation2015). The Index combines estimates of misreported business income, unregistered or hidden employees, and “envelope” wages to obtain estimates of the size of the shadow economy as a proportion of GDP and can be used longitudinally or across sectors and countries for evaluating the effectiveness of policy designed to minimize the shadow economy.
Given the sensitive nature of the topic, surveys face the risk of underestimating the total size of the shadow economy due to non-response and untruthful answers. Our method minimizes this risk by employing data collection techniques shown in previous studies, hence increasing the effectiveness of the elicitation of truthful responses. These techniques include: confidentiality with respect to the identities of respondents; framing the survey as a study of satisfaction with government policy (similar to Hanousek and Palda, Citation2004); phrasing misreporting questions indirectly, asking about “similar firms in the industry” rather than the respondent’s actual firm (Sauka Citation2014); excluding inconsistent responses, and controlling for factors that correlate with potential untruthful responses.
Phone interviews are conducted with owners, directors, and managers of companies, and they last 5 min on average. The questionnaire contains four main sections: (i) external influences and satisfaction; (ii) shadow activity; (iii) company and owner characteristics; and (iv) entrepreneurs’ attitudes. To increase the response rate and its truthfulness the questionnaire begins with non-sensitive questions about the satisfaction with the government and tax policy, before moving to more sensitive ones about the shadow activity and deliberate misreporting. This “gradual” approach is recommended by methodological studies of survey design in the context of tax evasion and the shadow economy (e.g., Gerxhani, Citation2007; and Kazemier and van Eck, Citation1992).
Even when asked indirectly, some entrepreneurs choose not to answer sensitive questions about the shadow activity. One way to avoid providing truthful answers is giving a score of “0” to all the questions, suggesting that no shadow activity has taken place during the years under scrutiny. These cases are treated as non-responses, hence minimizing downward bias in estimates of shadow activity. This approach has been discussed and employed by both Gerxhani (Citation2007), and Hanousek and Palda (Citation2004) in their respective work.
The first group of questions “external influences” requires respondents to express their satisfaction with the State Revenue Service, tax policy, business legislation, and government support for entrepreneurs in their country. The questions use a 5-point Likert scale, from “1” (“very unsatisfied”) to “5” (“very satisfied”). This first section of the questionnaire also includes two questions related to entrepreneurs’ social norms: entrepreneurs’ tolerance towards tax evasion and towards bribery. The measure of tolerance serves a second important role as a control variable for possible understating of the extent of shadow activities. The second section of the questionnaire, “informal business”, is constructed based on the concepts of productive, unproductive, and destructive entrepreneurship by Baumol (Citation1990), assessment of “deviance” or “departure from norms” within organizations (e.g., Warren, Citation2003) and empirical studies of tax evasion in various settings (e.g., Fairlie, Citation2002; Aidis and Van Praag, Citation2007). We assess the amount of shadow activity by asking entrepreneurs to estimate the degree of underreporting of business income (net profits), underreporting of the number of employees, underreporting of salaries paid to employees and the percentage of revenues that firms pay in bribes.
In the third section, we also elicit entrepreneurs’ perceptions of the probability of being caught for various forms of shadow activity, and the severity of penalties if caught deliberately misreporting. There is also a question conceived to measure the number of unregistered businesses: “In some industries, in addition to registered companies such as yours, unregistered enterprises also operate but do not report any of their activity to authorities. In your opinion, what percentage of your industry’s total production of goods/services is carried out by unregistered enterprises … ?” Even though we ask this question to owners/managers of registered businesses, we believe that being competitors and experts in their area they are likely to know approximately how many unregistered businesses operate in the sector. We do not include the production of unregistered businesses in the shadow economy index as their activity does not fit our definition of the phenomenon. By including the above question, we were able to provide a more in-depth picture of the unobserved economy.
The fourth section of the questionnaire elicits entrepreneurs’ opinions and attitudes towards tax evasion, including questions relating to entrepreneurs’ tax morale. For this section, we drew from Torgler and Schneider (Citation2009) who defined tax morale as a moral obligation to pay taxes and “a belief in contributing to society by paying taxes” (Torgler and Schneider Citation2009: 230). Similar to other questions, we phrase the tax morale one indirectly, asking company managers to what extent they would agree or disagree with the statement: “Companies in your industry would think it is always justified to cheat on tax if they have the chance” using scale from 1 (“strongly disagree”) to 5 (“strongly agree”). We also include a question on community belonging and one on perceived contribution to the growth of the economy and society in general, both factors associated with tax morale.
Once data has been gathered, we proceed to calculate the Shadow Economy Index as a percentage of GDP calculated through the income approach. GDP is hence the sum of gross remuneration of employees (gross personal income) and gross operating income of firms (gross corporate income). Computation of the Index proceeds in three steps: (i) we estimate the degree of underreporting of employee remuneration and underreporting of firms’ operating income using the survey responses; (ii) we estimate each firm’s shadow production as a weighted average of its underreported employee remuneration and underreported operating income, with the weights reflecting the proportions of employee remuneration and firms’ operating income in the composition of GDP; (iii) we calculate a production-weighted average of shadow production across firms.
In the first step, underreporting of firm i’s operating income, is estimated directly from the corresponding survey question (7). Underreporting of employee remuneration, however, consists of two components: (i) underreporting of salaries, or “envelope wages” (question 9); and (ii) unreported employees (question 8). Combining the two components, firm i’s total unreported proportion of employee remuneration is:
In the second step, for each firm we construct a weighted average of underreported personnel and underreported corporate income, producing an estimate of the unreported (shadow) proportion of the firm’s production (income):
Where αc is the ration of employees’ remuneration to the sum of employees’ remuneration and gross operating income of firms. We calculate αc for each country, c, in each year is using data from Eurostat. Taking a weighted average of the underreporting measures rather than a simple average is important to allow the Shadow Economy Index to be interpreted as a proportion of GDP. In the third step, we take the weighted average of underreported production, ShadowProportioni, across firms in country c to arrive at the Shadow Economy Index for that country:
The weights, wi, are the relative contribution of each firm to the country’s GDP, which we approximated by the relative amount of wages paid by the firm. Similar to the second step, the weighting in this final average is important to allow the Shadow Economy Index to reflect a proportion of GDP.
Shadow economies in Ukraine: measurements and results
The Ukrainian business survey was implemented between March and May 2019. All size types of companies were sampled: big, medium, small, and micro. Results indicate that the size of the Ukrainian shadow economy was 38.3% as a proportion of the GDP in 2017 and 38.5% in 2018. This is much higher than in the Baltic countries where, for comparison, the shadow economy was assessed at 22% and 24.2% in Latvia, 18.2% and 18.7% in Lithuania, and 18.2% and 16.7% in Estonia in 2017 and 2018, respectively. Besides a slight increase in the Ukrainian shadow economy, there have been fluctuations in the size of the different components measured: while unreported business income decreased from 60.2% in 2017 to 58.2% in 2018, unreported wages grew from 18% to 23.1%, as well as unregistered employees to 18% in 2017 and 18.7% in 2018.
The businesses surveyed grew more convinced of the existence of income underreporting in their sector. In fact, while in 2017 those that believed that there was no underreported income were 41.5% of the interviewed, in 2018 they were 33.3%. As a result, except for the slot from 1% to 10%, businessmen grew convinced that in their sector higher shares of income were underreported compared to 2017, this is illustrated in : shares of underreported income
Table 5. Shares of under-reported income
In contrast, the trend of underreporting of employees was reversed from 2017 to 2018, with more than a 10% increase of respondents believing that in their sector there were no underreported employees. This is shown in for every slot from 1% to 10% of total employees up to the slot from 76% to 100% of employees. No substantial change with regards to envelope wages as most of the slots did not change considerably as shown in .
Table 6. Shares of under-reported employees
Table 7. Shares of under-reported salaries
These results indicate that businesses are underreporting incomes and salaries in the attempt not to pay state taxes. On the other hand, business owners seem to value their collaborator offering increasingly often official employment and envelope wages. An increasing bribing tendency can be regarded as evidence of a worsening of the relationship between state and business. In fact, while in 2017 11.8% of revenues were spent in bribery, in 2018 the share grew to 12.6%. The average value of the bribe to secure a contract has been assessed at 7.5%. More than half of businesses surveyed were convinced that no bribe was necessary “to get things done”, but overall, more among them grew convinced that a share of revenue in their sector was used to obtain something from the public administration. Even higher was the share of businesses arguing that no contract value is paid to the government to secure the contract. The full breakout of revenue shares on bribery is shown in below.
Table 8. Revenue shares breakout
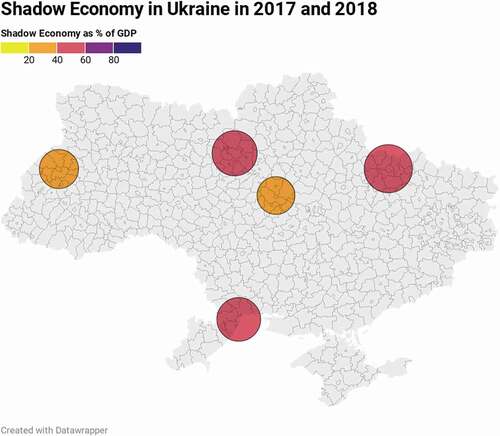
Table 9. Shadow economy in Ukraine by region
The geographical distribution of shadow economy did not change substantially between 2017 and 2018 with Northern, Western, and Southern regions being less prone to informality than the capital Kyiv and Eastern Ukraine. Data have been visualized through and the full breakout is in below.
Figure 1. Shadow economy in Ukraine in 2017 and 2018.
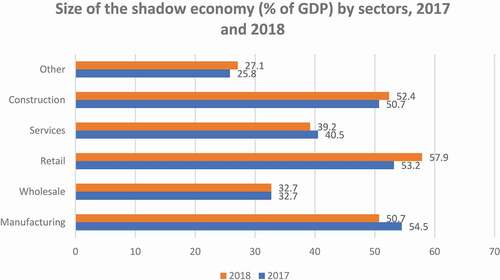
The sectors revealing to have the largest shares in the shadow are those in retail, manufacturing, and construction. In fact, the percentage of their economy in the shadow compared to the GDP remained above 50% in 2017 and 2018 alike. Services were assessed at around 40%, while wholesale remained stable at 32.7%. The full breakout of data is shown in below.
Figure 2. Size of the shadow economy (% of GDP) by sectors, 2017 and 2018.
The data on the size of the firm compared to the participation in the shadow economy as percentage of the GDP shows a tendency to formalize with the growing of the size of the company. The data can be visualized in below, bars are divided by year and size of the company in terms of employees.
Figure 3. Formalization by company size.
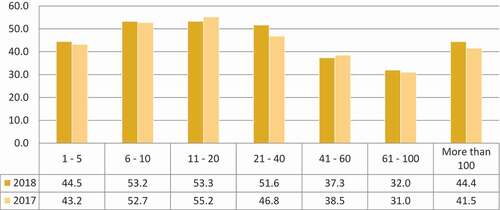
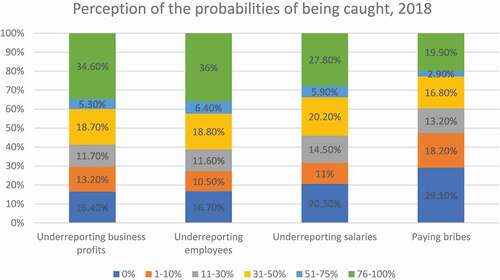
Even if small, the trend shows that smaller companies are more frequently in the shadows, and the more firms grow, the harder it is to hide from the state. Surveyed businesses were then asked about their perception on the probability of being caught for every component of the shadow economy, from underreporting of profits to paying bribes. While generally almost a third of respondents believed there is a high probability of being caught, the lowest score was obtained by paying bribes, a practice that remained stable throughout 2017 and 2018. Finally, as observed above in , from 2017 to 2018 there has been a decisive decrease in underreporting employees, and here, accordingly, the perception of the highest probability of being caught is for this aspect of the shadow economy. The full set of data is shown in below. Each column represents the frequency of the probability of being caught according to the different businesses.
Figure 4. Perception of the probabilities of being caught, 2018.
According to the interviewees, being caught underreporting may cause fines to affect seriously the competitiveness of their firms. Particularly, 35% of companies believed that fines can severely harm competitiveness, 25.6% that they would risk insolvency, and 12.1% that they would be forced to cease operations. Only 21.6% of companies believed that fines would be small and 6.1% that the amount to pay would be nothing to worry about. This general preoccupation is likely the result of the recent increase of fines in the Ukrainian legislation for certain instances of unregistered personnel, such as unregistered contracts, full-time workers registered as part-times, and some of them paid through envelope wages. While in 2018 and 2019 the fines were more than 20 times the value of the minimum wage, by 2020 the fine was re-settled to 10 times.
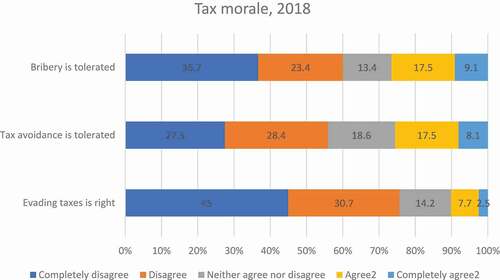
Starting from the assumption that higher tax morale reflects a higher respect of rules, interviewees were asked whether they believed that tax avoidance and bribery are tolerated behaviours, and if tax evasion is seen as justified by the colleagues in their sector. While scarce tolerance of these behaviours is generally strong, interviewees seem less forgiving of tax evasion, having 75.7% believing is not a tolerable practice. On the other hand, tax avoidance is acknowledged as the most tolerated practice. The full breakout of the data is shown in below.
Figure 5. Tax morale in 2018.
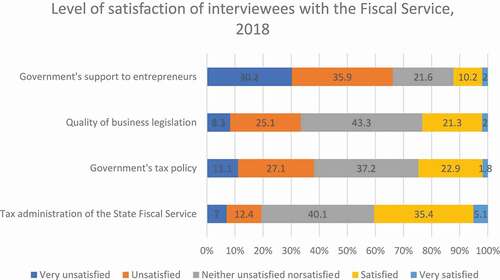
Nevertheless, the predisposition to pay taxes is also determined by the level of satisfaction towards the services to enterprises. Interviewees were asked to express their level of satisfaction on a series of different questions, from the support to entrepreneurs to the tax policy and the quality of the business legislation. The lowest level of satisfaction was recorded for government’s support to entrepreneurs, while the prevailing sentiment was indifference for all the proposed issues. On the other hand, the highest level of satisfaction was recorded for the administration of taxes by the State Fiscal Service, as shown in .
Figure 6. Satisfaction with the Fiscal Service, 2018.
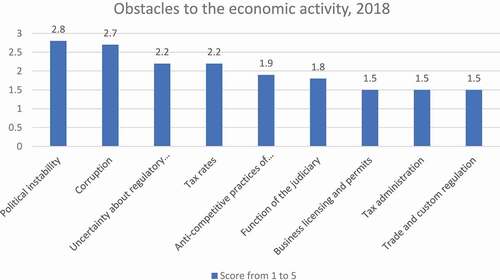
Finally, interviewees were asked to what extent they believed that a set of nine different conditions could be considered an obstacle to their activity. Giving a score from 1 to 5 where 0 was to be understood as “not an obstacle” and 5 “a major obstacle”, surveyed businesses identified political instability and corruption as the major problem for their activities. The below shows the factors that were ascribed as the most problematic to conduct their economic activity in 2018.
Figure 7. Major obstacles to a successful economic activity, 2018.
Discussion and conclusion: the future of informality studies
The above figures show that the shadow economy in Ukraine is high. They are not so distant from 45.5% of the GDP in average until 2017 that Schneider calculated using a MIMIC approach (Medina and Schneider Citation2018) but they are definitely higher than the 23.8% declared by the National Bank of Ukraine for 2018.Footnote2 They also seem to suggest that the causes of informality are various. At any rate, the shadow economy constitutes an integral part of the national economy and informal practices are part of everyday transactions in the country. Now, rational choice theory could suggest that entrepreneurs, in their quest to maximize their income, may attempt to minimize the amount of payments to the state. Besides, when a state’s fiscal services are weak, entrepreneurs will have more incentives to under-declare profits, pay envelop wages and under-declare the number of employees as a way to maximize their profit thus justifying the need for repressive and punitive approaches. However, the situation is probably more complex than this, as our survey shows, and further studies shall take into account at least two things.
First, the levels of tax morale are relatively high. As shows, the number of respondents endorsing under-declaring and non-paying taxes is low (25.6% tax avoidance and 10.2% tax evasion). Non-paying taxes seems to go even against the business in the long term since the fear of being caught is high. shows that between 19.9% and 34.6% of interviewees see the risk of being caught as real, especially when hiding revenues or income but a bit less when hiding employees, which in a consolidated practice are often hired as “independent workers” having to register their own business and being thus sub-contracted. This avoids the burden of medical insurance payments, a practice encouraged by the fact that public hospitals remain affordable and that medical care remains (at least officially) universal in Ukraine. It also allows avoiding paying contribution to state pension schemes, a payment with only low perceived benefits given the volatility of the national currency. Yet, the fear of being caught is significantly low when it comes to bribes, possibly suggesting that payments are done to state officers to limit damage if the employer is caught under-reporting incomes or salaries. This would justify why 16% of respondents declare to spend more than 25% of income in bribes. As a colleague smartly put it at a workshop some years ago, we all know that it is bad, but we all do it (Fogarty Citation2005).
Second, as shown in , lack of satisfaction with state services is high with 19.4% of respondents unsatisfied with the tax administration of the state fiscal service, 33.4% with the quality of business legislation, 38.2% with the government’s tax policy, and 65.9% of how the state helps entrepreneurs. If I am unsatisfied with a service, I am less likely to be willing to pay for it (or to pay the full requested amount). Entrepreneurs unhappy with state support might as well ask why they need to contribute to institutions that fail to pay them back. Eventually, a second driver leading to under-declare work might be, in addition to a desire to maximize informe, a desire to minimize the amount paid for services that they see as useless, deficient, or senseless. This would be in line with the possibility that under-declaring be an act of resistance, protest, or insubordination (Murru and Polese Citation2020) that finds its origins in the concept of the moral economy (Scott Citation1977), everyday rebellion (Scott Citation1977) or infrapolitics (Scott Citation2019).
This is a key point and corroborates the results of a recent survey that some members of the team conducted on Ukraine, when we explored the use of connections to gain access to services (Polese and Stepurko Citation2016). The same survey showed that, while respondents were unlikely to trust the state, to consider that institutions had improved in the past years or that the government was acting to their advantage, they clearly asserted the need to help fellow citizens.
Traditional shadow economy measurements allow to quantify some socio-economic phenomena are correlated with low state efficiency. However, it is not always clear the causal relationship and whether non-compliance stems from perceived state inefficiency and the idea that abiding by the rules leads nowhere good or can be avoided, or the opposite, that state inefficiency happens because of citizens’ behaviours and attitude. Whatever the position, to be able to address a deficiency in governance, it is important to understand why people engage in such behaviour. It is by understanding their motives that incentives can be identified and used to enhance compliance by the citizens. This is where informality steps in to help better understanding the way things work in a context, region, or in a particular situation, so as to contribute to explaining the relationship of monetary and non-monetary (or even not directly economic) practices. A situation of high level of insatisfaction towards economic governance, high level of solidarity towards fellow citizens seems the perfect context to rely on alternative social support structures a sort of necessity or at least a more suitable alternative to the system currently in force. It is no longer “how things should work in theory” but “how we’re going to survive in practice” (Polese Citation2006) or how to make things work in the short term in a system that has some strong spots of inneffectiveness.
Under these conditions, a sort of shift in tax morale can be expected. Officially, we are all in favour, and we know how things should work in an ideal situation. However, reality is different and citizens might eventually endorse alternative ways of living loyalty towards the state and even renegotiation of the role of the state against some non-state actors that de facto replace its institutions in some spheres of public life as suggested in .
The future of informality studies lies, in our view, in its use as a framework or a means to explain and interpret the persistence of underground economies. In other words, looking at the behaviour of economic actors in a given state, or some of its subunits, we can measure the potential harm of such tendencies and estimate the kind of interventions that might be needed. However, while some of these can be universally applied, there is a number of other correlations that may be seriously affected by the perceived role of the state by the citizen and eventually the way state–citizen relationships are constructed.
Starting from the results of a managers survey, we have tried to go beyond economic and rational choice explanations of the presence and persistence of shadow economies in Ukraine to propose possible new directions for informality studies. If we conceive informality as a framework helping analysing the relationship between a state and its citizens, how citizens organize themselves in sub-structures that can eventually replace or supplement state ones (Polese, Kovács, and Jancsics Citation2018; Rekhviashvili Citation2015) then we can transcend from the notion of informality as “good” or “bad” per se. We refer here to works asserting the role of informality as a reservoir of creativeness (Roy Citation2005), innovation (Phelps Citation2021) and discovering new solutions to existing problems. This is possibly a side of informality worth exploring and even to be used to improve governance mechanisms. Indeed, understanding and exploiting local cultural and social nuances can help not only changing behaviours but using existing structures and power relations embedded in a given cultural context to improve the level of governance. In this respect, it is by understanding shadow economies as the most visible and measurable expression of an overall tendency to do things informally we can take a step back and look at the cultural, social, and economic settings in which shadow transactions are embedded, which is the first step to focus. Informality cannot be eradicated, it is intrinsic to all societies and cultures (Polese Citation2021). But it can be regulated, understood, and circumscribed to given areas of governance where it is useful, at best, or at least not harmful at worst.
Disclosure statement
No potential conflict of interest was reported by the author(s).
Correction Statement
This article has been republished with minor changes. These changes do not impact the academic content of the article.
Additional information
Funding
Notes
1. Deutsche Welle (2020) ILO warns of massive unemployment, https://www.dw.com/en/ilo-warns-of-massive-unemployment/av-53286327; World Bank (2020) Supporting vulnerable temporary workers and businesses coping with coronavirus challenges https://blogs.worldbank.org/developmenttalk/supporting-vulnerable-temporary-workers-and-businesses-coping-coronavirus
2. “Nearly Quarter of Ukraine’s GDP, or UAH 846 Billion, Is in Shadow – Study of Shadow Economy Finds,” National Bank of Ukraine, 17 February 2020 https://bank.gov.ua/en/news/all/doslidjennya-tinovoyi-ekonomiki-v-ukrayini–mayje-chvert-vvp–abo-846-mlrd-griven–perebuvaye-v-tini#:~:text=Historically%2C%20the%20estimated%20level%20of,2018%2C%20is%20in%20the%20shadow
References
- Aidis, R., and M. Van Praag. 2007. Illegal entrepreneurship experience: Does it make a difference.
- Baumol, W. 1990. Entrepreneurship: Productive, unproductive and destructive. Journal of Political Economy 98: 893–921.
- Bayat, A. 2000. “From `dangerous Classes’ to `quiet Rebels’.” International Sociology 15 (3): 3. doi:https://doi.org/10.1177/026858000015003005.
- Beyer, D. 2001. “Poverty and Tobacco.” Tobacco Control 10 (3): 3. doi:https://doi.org/10.1136/tc.10.3.210.
- Boanada-Fuchs, A., and V. Boanada-Fuchs. 2018. “Towards a Taxonomic Understanding of Informality.” International Development Planning Review 40 (4): 397–420. doi:https://doi.org/10.3828/idpr.2018.23.
- Bromley, R. 1978. “Introduction - the Urban Informal Sector: Why Is It Worth Discussing?” World Development 6 (9–10): 1033–1039. doi:https://doi.org/10.1016/0305-750X(78)90061-X.
- Cooley, A., and J. C. Sharman. 2015. “Blurring the Line between Licit and Illicit: Transnational Corruption Networks in Central Asia and Beyond.” Central Asian Survey 34 (1): 1. doi:https://doi.org/10.1080/02634937.2015.1010799.
- Darden, K. 2008. “The Integrity of Corrupt States: Graft as an Informal State Institution.” Politics & Society 36 (1): 35–59. doi:https://doi.org/10.1177/0032329207312183.
- Dell’Anno, R., M. Gómez-Antonio, and A. Alañon-Pardo. 2007. “The Shadow Economy in Three Mediterranean Countries: France, Spain and Greece. A MIMIC Approach.” Empirical Economics 33 (1): 1. doi:https://doi.org/10.1007/s00181-007-0138-1.
- Denisova-Schmidt, E., ed. 2020. Corruption in Higher Education: Global Challenges and Responses. Amsterdam: Brill.
- Dreher, A., C. Kotsogiannis, and S. McCorriston. 2009. “How Do Institutions Affect Corruption and the Shadow Economy?” International Tax and Public Finance 16 (6): 6. doi:https://doi.org/10.1007/s10797-008-9089-5.
- Eurostat. 2019. Building the System of National Accounts - informal sector. https://ec.europa.eu/eurostat/statistics explained/index.php/Building_the_System_of_National_Accounts_-_informal_sector
- Fairlie, R. 2002. Drug dealing and legitimate self- employment. Journal of Labour Economics.
- Falla, A. M. V., and S. C. Valencia. 2019. “Beyond State Regulation of Informality: Understanding Access to Public Space by Street Vendors in Bogotá.” International Development Planning Review 41 (1): 1. doi:https://doi.org/10.3828/idpr.2019.3.
- Feld, L. P., and F. Schneider. 2010. “Survey on the Shadow Economy and Undeclared Earnings in OECD Countries.” German Economic Review 11 (2): 2. doi:https://doi.org/10.1111/j.1468-0475.2009.00466.x.
- Fogarty, P. 2005. “’We All Do It and We All Think It’s Bad’: Discourses and Practices of Corruption in Moldova.” In Paper Presented at the Workshop: Emerging Citizenship and Contested Identities between Dniester, Prut and Danube Rivers, 10 and 11. March: Max Planck Institute for Social Anthropology.
- Furstenberg, S. 2018. “State Responses to Reputational Concerns: The Case of the Extractive Industries Transparency Initiative in Kazakhstan.” Central Asian Survey 37 (2): 2. doi:https://doi.org/10.1080/02634937.2018.1428789.
- Gel’man, V. 2004. “The Unrule of Law in the Making: The Politics of Informal Institution Building in Russia.” Europe - Asia Studies 56: 7. doi:https://doi.org/10.1080/1465342042000294347.
- Gerxhani, K. 2007. ‘‘Did you pay your taxes?’’ How (not) to conduct tax evasion surveys in transition countries. Social Indicators Research 80, 555–581.
- Gudeman, S. 2015. The Anthropology of Economy: Community, Market, and Culture. Cambridge: Cambridge University Press. doi:https://doi.org/10.5860/choice.39-4693.
- Haid, C. G., and H. Hilbrandt. 2019. “Urban Informality and the State: Geographical Translations and Conceptual Alliances.” International Journal of Urban and Regional Research 43 (3): 3. doi:https://doi.org/10.1111/1468-2427.12700.
- Hann, C., and K. Hart, eds. 2009. Market and Society: The Great Transformation Today. Cambridge: Cambridge University Press.
- Hanousek, J. and F., Palda. 2004. Quality of Government Services and the Civic Duty to Pay Taxes in the Czech and Slovak Republics, and other Transition Countries. Kyklos 57: 237–252. doi:https://doi.org/10.1111/j.0023-5962.2004.00252.
- Harris, J. R., and M. P. Todaro. 1970. “Migration, Unemployment and Development: A Two-Sector Analysis.” American Economic Review 60 (1): 126–142. 1970.
- Hart, K. 1973. “Informal Income Opportunities and Urban Employment in Ghana.” The Journal of Modern African Studies 11 (1): 1. doi:https://doi.org/10.1017/S0022278X00008089.
- Hassan, M., and F. Schneider. 2016. “Size and Development of the Shadow Economies of 157 Worldwide Countries: Updated and New Measures from 1999 to 2013.” Journal of Global Economics 04 (3). doi:https://doi.org/10.4172/2375-4389.1000218.
- Hayoz, N. 2015. “Cultures of Informality and Networks of Power in Post-Soviet Non-Democracies.” Evolutionary Governance Theory: Theory and Applications. doi:https://doi.org/10.1007/978-3-319-12274-8_5.
- Henig, D., and N. Makovicky. 2017. “Economies of Favour after Socialism.” Economies of Favour after Socialism. doi:https://doi.org/10.1093/acprof:oso/9780199687411.001.0001.
- Innes, J. E., S. Connick, and D. Booher. 2007. “Informality as a Planning Strategy.” Journal of the American Planning Association 73 (2): 2. doi:https://doi.org/10.1080/01944360708976153.
- Jaffe, R., and M. Koster. 2019. “The Myth of Formality in the Global North: Informality as Innovation in Dutch Governance.” International Journal of Urban and Regional Research 43 (3): 563–568. doi:https://doi.org/10.1111/1468-2427.12706.
- John, R., C. C. Williams, and P. Rodgers. 2008. “Everyday Tactics and Spaces of Power: The Role of Informal Economies in Post-Soviet Ukraine.” Social and Cultural Geography 9 (2). doi:https://doi.org/10.1080/14649360701856110.
- Johnson, S., D. Kaufmann, and P. Zoido-Lobatón. 1998. “Corruption, Public Finance, and the Unofficial Economy.” ECLAC Conference.
- Kazemier, B, and R. van Eck. 1992. Survey investigations of the hidden economy. Journal of Economic Psychology 13: 569–587.
- Kucera, D., and L. Roncolato. 2008. “Informal Employment: Two Contested Policy Issues.” International Labour Review 147 (4): 4. doi:https://doi.org/10.1111/j.1564-913X.2008.00039.x.
- Kuhn, S., S. Milasi, and S. Yoon. 2018. “World Employment and Social Outlook:Trends 2018.” ILO.
- Labour Market Observatory. 2018. Report on the activities of the 2015-2018 term of office. Brussels, European Economic and Social Committee.
- Leaf, M. 1992. “Informality and Urban Land Markets.” Berkeley Planning Journal 7 (1). doi:https://doi.org/10.5070/bp37113107. online only
- Ledeneva, A. 2010. “Can Russia Modernise?: Sistema, Power Networks and Informal Governance.” Can Russia Modernise?: Sistema, Power Networks and Informal Governance. doi:https://doi.org/10.1017/CBO9780511978494.
- Ledeneva, A. 2013. Can Russia Modernise? Cambridge: Cambridge University Press. doi:https://doi.org/10.1017/cbo9780511978494.
- Ledeneva, A. 2018. “Th Global Encycloapedia of Informality“. University College Longon Press (Vol. 1 & 2). London: University College London Press. doi:https://doi.org/10.14324/111.9781911307907.
- Lewis, W. A. 1954. “Economic Development with Unlimited Supplies of Labour.” The Manchester School 22 (2): 139–191. doi:https://doi.org/10.1111/j.1467-9957.1954.tb00021.x.
- Lipton, M. 1984. “Family, Fungibility and Formality: Rural Advantages of Informal Non-Farm Enterprise versus the Urban-Formal State.” Human Resources, Employment and Development Volume 5: Developing Countries. doi:https://doi.org/10.1007/978-1-349-17461-4_10.
- Medina, L., and F. Schneider. 2018. “Shadow Economies around the World: What Did We Learn over the Last 20 Years?” IMF Working Papers 18 (17): 1. doi:https://doi.org/10.5089/9781484338636.001. (WP/.
- Merriman, D. 2010. “The Micro-Geography of Tax Avoidance: Evidence from Littered Cigarette Packs in Chicago.” American Economic Journal: Economic Policy 2 (2). doi:https://doi.org/10.1257/pol.2.2.61.
- Morris, J. 2017. “An Agenda for Research on Work and Class in the Postsocialist World.” Sociology Compass 11 (5): 5. doi:https://doi.org/10.1111/soc4.12476.
- Morris, J., and A. Polese. 2011. “Socially Embedded Workers at the Nexus of Diverse Work in Russia:An Ethnography of Blue Collar Informalization.” International Journal of Sociology and Social Policy 31 (11/12): 11–12. doi:https://doi.org/10.1108/01443331111177832.
- Murru, S., and A. Polese, ed. 2020. Resistances: Between Theories and the Field. New York: Rowman & Littlefield Publishers.
- Osipian, A. L. 2012. “Education Corruption, Reform, and Growth: Case of Post-Soviet Russia.” Journal of Eurasian Studies 3 (1): 1. doi:https://doi.org/10.1016/j.euras.2011.10.003.
- Pacula, R. L., B. Kilmer, M. Grossman, and F. J. Chaloupka. 2010. “Risks and Prices: The Role of User Sanctions in Marijuana Markets.” The B.E. Journal of Economic Analysis & Policy 10 (1): 1. doi:https://doi.org/10.2202/1935-1682.1992.
- Paula Áureo, D., and J. A. Scheinkman. 2010. “Value-Added Taxes, Chain Effects, and Informality.” American Economic Journal: Macroeconomics 2: 4. doi:https://doi.org/10.1257/mac.2.4.195.
- Peng, M. W., S. L. Li Sun, B. Pinkham, and H. Chen. 2009. “The Institution-Based View as a Third Leg for a Strategy Tripod.” Academy of Management Perspectives 23 (3): 3. doi:https://doi.org/10.5465/AMP.2009.43479264.
- Phelps, N. A. 2021. “The Inventiveness of Informality: An Introduction.” International Development Planning Review 43 (1): 1–12. doi:https://doi.org/10.3828/idpr.2021.1.
- Polese, A. 2006. “De jure oder de facto? Die Gesundheits- und Bildungssektoren in der Ukraine.” Ukraine-Analysen 2 (16): 2–4. doi:https://doi.org/10.31205/UA.016.01.
- Polese, A. 2009. “‘If I Receive It, It Is a Gift; if I Demand It, Then It Is a Bribe’: On the Local Meaning of Economic Transactions in Post-Soviet Ukraine.” Anthropology in Action 15: 3. doi:https://doi.org/10.3167/aia.2008.150305.
- Polese, A. 2014. “Informal Payments in Ukrainian Hospitals: On the Boundary between Informal Payments, Gifts, and Bribes.” Anthropological Forum 24 (4): 381–395. doi:https://doi.org/10.1080/00664677.2014.953445.
- Polese, A. 2016. “Too Much Corruption or Simply Too Much Talk of ‘Corruption’? the ‘Two Informalities.’” Transitions. Accessed 20 January 2022. http://www.tol.org/client/article/26474-ukraine-corruption-graft-informality.html.
- Polese, A. 2019. “Informality in Ukraine and beyond: one name, different flavours…with a cheer for the Global Encyclopaedia of Informality” Accessed 2 March 2022.
- Polese, A. 2021. “What Is Informality? (Mapping) ‘The Art of Bypassing the State’ – In Eurasian Spaces – And Beyond.” Eurasian Geography and Economics 1–43. doi:https://doi.org/10.1080/15387216.2021.1992791.
- Polese, A., B. Kovács, and D. Jancsics. 2018. “Informality ‘In Spite Of’ or ‘Beyond’ the State: Some Evidence from Hungary and Romania.” European Societies 20 (2): 2. doi:https://doi.org/10.1080/14616696.2017.1354390.
- Polese, A., and F. Schneider. 2021. “Main approaches used to estimate illicit markets worldwide and what should we take into account in an estimation exercise to Ireland.” Department of Equity and Justice of Ireland (unpublished study).
- Polese, A. and T. Stepurko. 2016. “(Ukraine) in connections we trust”, Transitions Online, 13 April https://tol.org/client/article/25784--in-connections-we-trust.html
- Putniņš, T. J., and A. Sauka. 2015. “Measuring the Shadow Economy Using Company Managers.” Journal of Comparative Economics 43 (2): 2. doi:https://doi.org/10.1016/j.jce.2014.04.001.
- Putniņš, T. J., and A. Sauka. 2020. “The Shadow Economy in Russia: New Estimates and Comparisons with Nearby Countries.” Accessed 20 January 2022. https://freepolicybriefs.org/wp-content/uploads/2020/03/freepolicybriefs20200316-2.pdf.
- Rasanayagam, J. 2011. “Informal Economy, Informal State: The Case of Uzbekistan.” International Journal of Sociology and Social Policy 31 (11/12): 11–12. doi:https://doi.org/10.1108/01443331111177878.
- Rekhviashvili, L. 2015. “Marketization and the Public-Private Divide.” International Journal of Sociology and Social Policy 35 (7/8): 7/8. doi:https://doi.org/10.1108/ijssp-10-2014-0091.
- Rekhviashvili, L. 2017. “Why Read Informality in a Substantivist Manner? on the Embeddedness of the Soviet Second Economy.” The Informal Economy in Global Perspective. doi:https://doi.org/10.1007/978-3-319-40931-3_2.
- Routh, S. 2011. “Building Informal Workers Agenda: Imagining ‘Informal Employment’ in Conceptual Resolution of ‘Informality.’.” Global Labour Journal 2 (3): 3. doi:https://doi.org/10.15173/glj.v2i3.1106.
- Roy, A. 2005. “Urban Informality: Toward an Epistemology of Planning.” Journal of the American Planning Association 71 (2): 147–158. doi:https://doi.org/10.1080/01944360508976689.
- Roy, A. 2009. “Why India Cannot Plan Its Cities: Informality, Insurgence and the Idiom of Urbanization.” Planning Theory 8 (1): 1. doi:https://doi.org/10.1177/1473095208099299.
- Roy, A., and N. AlSayyad, eds. 2004. Urban Informality: Transnational Perspectives from the Middle East, Latin America, and South Asia. Lanham: Lexington Books.
- Santini, H., A. P. Ruth, and R. Kevlihan. 2020. “Limited Statehood and Informal Governance in the Middle East and Africa.” Limited Statehood and Informal Governance in the Middle East and Africa. doi:https://doi.org/10.4324/9780429504570.
- Sarmiento, H., and C. Tilly. 2018. “Governance Lessons from Urban Informality.” Politics and Governance 6 (1): 199–202. doi:https://doi.org/10.17645/pag.v6i1.1169.
- Sauka, A. 2014. “Measuring the Competitiveness of Latvian Companies.” Baltic Journal of Economics 14 (1–2): 1–2. doi:https://doi.org/10.1080/1406099X.2014.995421.
- Schneider, F. 2011. “Handbook on the Shadow Economy.” Handbook on the Shadow Economy. doi:https://doi.org/10.4337/9780857930880.
- Schneider, F., and L. Medina. 2017. “Shadow Economies around the World: New Results for 158 Countries over 1991-2015.” 6430. CESifo Working Paper Series. https://papers.ssrn.com/sol3/papers.cfm?abstract_id=2965972.
- Schneider, F., and C.C. Willams. 2013. The Shadow Economy, IEA, London.
- Scott, J. C. 1977. The Moral Economy of the Peasant: Rebellion and Subsistence in Southeast Asia. Yale: Yale University Press.
- Scott, J. C. 2019. “Two Cheers for Anarchism.” Two Cheers for Anarchism. doi:https://doi.org/10.1515/9781400844623.
- Stefes, C. H. 2006. “Understanding Post-Soviet Transitions.” Understanding Post-Soviet Transitions. doi:https://doi.org/10.1057/9780230287464.
- Teobaldelli, D., and F. Schneider. 2013. “The Influence of Direct Democracy on the Shadow Economy.” Public Choice 157 (3–4): 3–4. doi:https://doi.org/10.1007/s11127-013-0098-2.
- Torgler, B. and F. Schneider. 2009. The impact of tax morale and institutional quality on the shadow economy. Journal of Economic Psychology 30: 228–245.
- Turner, J. C. 1968. “Housing Priorities, Settlement Patterns, and Urban Development in Modernizing Countries.” Journal of the American Planning Association 34: 6. doi:https://doi.org/10.1080/01944366808977562.
- Warren, E. 2003. Constructive and destructive deviance in organizations. Academy of Management Review 28: 622–631.
- Williams, C. C. 2004. “Cash-in-Hand Work: The Underground Sector and the Hidden Economy of Favours.” Cash-in-Hand Work: The Underground Sector and the Hidden Economy of Favours. doi:https://doi.org/10.1057/9780230506190.
- Williams, C. C., and I. Alexandra Horodnic. 2016. “Cross-Country Variations in the Participation of Small Businesses in the Informal Economy: An Institutional Asymmetry Explanation.” Journal of Small Business and Enterprise Development 23 (1): 1. doi:https://doi.org/10.1108/JSBED-02-2015-0021.
- Williams, C. C., and S. Bezeredi. 2018. “Explaining and Tackling the Informal Economy: A Dual Informal Labour Market Approach.” Employee Relations 40 (5): 5. doi:https://doi.org/10.1108/ER-04-2017-0085.
- Williams, C. C., and J. Franic. 2016. “Explaining Participation in the Informal Economy in Post-Socialist Societies: A Study of the Asymmetry between Formal and Informal Institutions in Croatia.” Journal of Contemporary Central and Eastern Europe 24 (1): 1. doi:https://doi.org/10.1080/0965156X.2015.1118817.
- Williams, C. and F. Lapeyre. 2017. Dependent self-employment: Trends, challenges and policy responses in the EU. EMPLOYMENT Working Paper No. 228. Geneva: International Labour Office.
- Williams, C. C., and F. Schneider. 2016. “Measuring the Global Shadow Economy: The Prevalence of Informal Work and Labour.” Measuring the Global Shadow Economy: The Prevalence of Informal Work and Labour. doi:https://doi.org/10.4337/9781784717995.
- World Bank (2019) Informal Employment Percentages. https://data.worldbank.org/indicator/sl.isv.ifrm.zs