
Abstract
How do countries mobilize large additions to tax revenue – defined as an average increase in the tax-to-GDP ratio of 0.5 percent per year over three years or more? To answer this question, we build a novel dataset covering 55 episodes of large tax revenue increases in low-income countries and emerging markets. We find that: (i) reforms of indirect taxes and exemptions are the most common tax policy measures; (ii) multi-pronged tax administration reforms often go hand in hand with tax policy measures; and (iii) sustainability of the episodes hinges on tax administration reforms in the key compliance areas (risk-based audits, registration, filing, payment, and reporting).
1. Introduction
Tax revenue mobilization is a central concern of economic policymaking in many countries. Experience has shown that while some countries exhibit marked increases in their tax-to-GDP ratios, others show little or no increase over extended periods. Greater domestic resource mobilization is critical for many countries. In particular, in developing countries, enhancing the mobilization of tax revenue is integral for governments to create fiscal space to fund public investment and deliver public services.
In recent years, there has been wider and renewed interest by governments and multilateral institutions in enhancing tax capacity, stemming from the recognition that tax capacity is at the core of state building and development (Besley and Persson Citation2009, Citation2010; International Monetary Fund (IMF) Citation2011; Gaspar, Jaramillo, and Wingender Citation2016a, Citation2016b). The importance of building tax capacity was underscored by the G-20 leaders in 2010, who called on the IMF and development institutions to monitor revenue mobilization efforts.1 The UN member countries have also collectively recognized the need to raise tax revenue to fund the Sustainable Development Goals (SDGs) by 2030, and made strengthening domestic resource mobilization a specific target (SDGs target 17.1). Similarly, in 2015, partner countries to the Addis Tax Initiative (ATI) committed to “step up domestic revenue mobilization.”
Given the daunting challenges some countries face in tackling this prominent policy issue, the paramount question to policymakers is “how” to mobilize sufficient tax revenue. The questions that frequently arise are: “What have other countries done to increase revenue collection?”; “How fast can a country boost tax revenue?” Answers to these questions would provide a useful tool to assist policymakers in their revenue mobilization efforts. However, the literature does not provide sufficient cross-country evidence on successful tax revenue mobilization, especially for low-income countries (LICs) and emerging markets (EMs).
This study helps to close the gap in the literature with a novel dataset that provides a comprehensive analysis of efforts to increase tax revenues in LICs and EMs over the period 2000–2015. The dataset covers 55 episodes of tax revenue mobilization during which revenue administration and tax policy reforms played a crucial role in increasing the tax-to-GDP ratios; of these, 29 are observed in LICs, 18 in EMs, and 8 in resource-rich (RR) economies. For the identified episodes, the tax-to-GDP ratios increased by at least an average of 0.5 percent of GDP per year over a minimum of three years. Each episode details the specific tax policy measures (with a focus on the introduction of new taxes, rate and base changes) and revenue administrative measures. The dataset provides a short descriptive summary of policy measures.2 We further: (i) present the initial revenue level; (ii) record the overall revenue gain; (iii) indicate whether the revenue gain was sustained after the end of the episode; and (iv) report on IMF-supported programs accompanying the reform effort.
1.1. The key findings of this paper are the following
Many countries that observed large revenue increases pursued revenue administration and tax policy reforms in parallel, and only a few countries pursued either tax policy or revenue administration measures alone.
Broadening the tax base for both direct and indirect taxes by means of revenue administration and tax policy, especially through improvements in compliance and by reducing exemptions and/or eliminating tax holidays were frequently used measures.
Many countries focused on indirect taxation in their revenue mobilization efforts. Besides changes to general goods and services taxes, the introduction of value added tax (VAT), its simplification and increasing its efficiency was often followed by significant revenue gains. Excise taxation was also used frequently. Property taxes have played a limited role during the identified episodes in both LICs and EMs.
About one third of the increases in the tax-to-GDP ratios were sustained (they did not fall for at least three years after the increase), and another third fell moderately (less than one third of the initial gain was lost). Sustainability of the episodes usually coincides with tax administration reforms in the compliance areas (risk-based audits, registration, filing, payment, and reporting). Most frequently, tax revenue mobilization efforts in the latter half of the 2000s were hindered by the global financial crisis of 2007/2008.
1.2. Causality cannot be inferred
The paper is a stocktaking exercise of what countries have done during episodes of large revenue increases. While tax policy and revenue administration measures likely contributed to or were the main driver behind much of the observed revenue increase, causality cannot reliably be established given the lack of additional micro-evidence or natural control groups for most reforms. In addition, it should be noted that not all tax systems that raise more revenue are necessarily better. Examples include reforms that raise equity concerns or increasing revenue by failing to give full and timely VAT refunds.
Our research revealed that a high-level political commitment and buy-in from all stakeholders played a crucial role for success. These findings are further discussed in the follow-up papers on cases studies (Akitoby, Honda, et al. Citation2019; Akitoby, Baum, et al. Citation2019; Akitoby, Honda, and Primus Citation2019). For example, Georgia’s comprehensive tax reform was feasible only after the country had reached a high degree of dysfunction, triggering a revolution. Similarly, in Ukraine, the 2004 Orange Revolution was a catalyst for tax reform. And in 2003, Liberia initiated reform after the civil war had ended. While a clear political mandate to increase revenue collection is important, it is not sufficient. A political commitment at the highest level with deep social dialogue enhances the likelihood of reforms being implemented and sustained.
The paper is organized as follows: Section 2 provides a description of the revenue data and briefly discusses recent tax revenue developments in LICs and EMs. Section 3 outlines the analytical framework for identifying revenue mobilization episodes and discusses the findings from these episodes. This section also examines improvements in tax effort by relating tax revenue ratios to the state of economic development as a robustness test. Section 4 discusses the revenue administration and tax policy reforms that contribute to increases in the tax-to-GDP ratios. The final section concludes.
2. Data description and stylized facts
Data and descriptive information are used to identify episodes of revenue mobilization. The annual data used cover 136 countries (71 EMs and 65 LICs) from 2000 to 2015.3 Descriptive information on revenue administration and tax policy measures are assembled from published IMF country reports (e.g. IMF staff reports), internal IMF technical assistance reports, several external sources on country-cases (World Bank, OECD, and others), and expertise of IMF staff.
Data on overall tax revenue comprise the following categories: PIT; CIT; goods and service taxes, separated into VAT, excise taxes, and general (other) goods and services taxes; trade tax; property tax; and others. Annual data for tax revenue (including its subcategories) are taken from the publicly available World Revenue Longitudinal Database (WoRLD).4 For RR countries, given the absence of non-commodity tax revenue, non-commodity revenue is computed by subtracting total commodity revenue as well as grants from GG revenue.
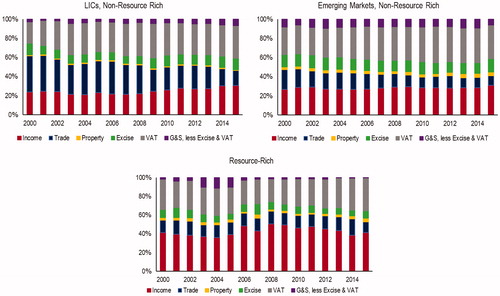
Tax revenue has been rising in LICs and EMs over the last fifteen years, and the tax revenue structure has changed (). In LICs, between 2000 and 2015, the average tax revenue increased by 3.5 percent of GDP, and measured 16.4 percent in 2015 on (an unweighted) average. In EMs, the increase in tax revenue was less pronounced, rising by 0.9 percent of GDP between 2000 and 2015, and reaching an average 17.3 percent. The average tax revenue structure has changed significantly, mostly reflecting declining trade tax revenues due to trade liberalization and a shift towards income tax and VAT (, Appendix 2). Many LICs and EMs introduced VAT, which has proved to be a robust source of revenue (Keen Citation2013), and enhanced collection efficiency has also contributed to the increase in VAT revenue. In addition, excise tax revenue has increased and property tax revenue, albeit still small, is on the rise.
Figure 1. Tax revenue development. Note: For RR countries, non-commodity revenue is computed by subtracting commodity revenue and grants from general government (GG) revenue. Sources: WoRLD, WEO, and IMF staff estimates.
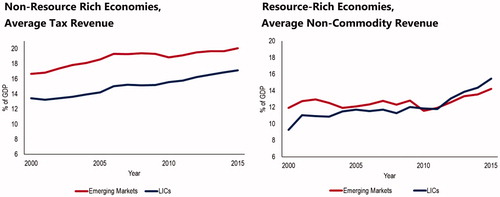
Figure 2. Tax revenue composition. Note: Resource-Rich data are in terms of percent of non-commodity revenue. Sources: World Revenue Longitudinal Database and IMF staff estimates.
3. Empirical strategy
3.1. Episodes of tax revenue mobilization
In the first step, we identify episodes of rapid increases in tax revenue mobilization that might be driven by fiscal policy decisions and reforms. Some observed tax increases might be driven by the business cycle or shifts in the composition across economic goods. We therefore adjust the tax revenue ratio to represent only its structural component, removing the cyclical element by applying an output elasticity to tax revenue of one, as common in the literature.5 The initial identification thus takes the cyclically adjusted tax revenue-to-trend GDP ratio as a baseline.
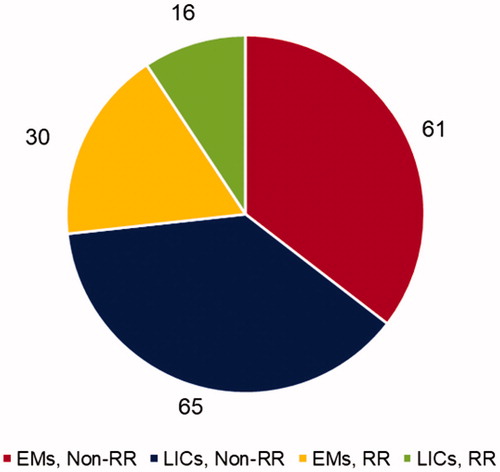
Episodes are defined as 3-year compounded windows of an average increase of 0.5 percent per year or more. The first episode is triggered by the first 3-year window in which the tax-to-GDP ratio increases by an average of at least 0.5 percent per year (1.5 percent within three years). The threshold of 0.5 percent of GDP per year is often set as a target in IMF supported programs (e.g. Bangladesh 2004 and Madagascar 2016) or by governments. It was also suggested that to build stronger institutions and support growth, countries should aim to achieve revenue gains of 0.5 percent of GDP per year.6 Following the initial window, successive three-year windows (including the second and third years of the previous window) for which this criterion continues to be satisfied are compounded into the same episode. The end-point of an episode is the last overlapping window fitting this criterion. From the sample of 136 countries over 2000–2015, we identify 172 episodes that fit this criterion (). Of those, 61/30 are observed in non-RR/RR EMs, and 65/16 in non-RR/RR LICs. Episodes are thus relatively evenly spread over the two income groups. The RR results are robust to using non-oil GDP as the denominator rather than nominal GDP. In Section 5, when we analyze the underlying policy choices, we narrow the 172 episodes down to those with more tangible tax revenue mobilization results using two additional episode qualifiers.
Figure 3. Distribution of 172 identified episodes. Sources: WoRLD and IMF staff estimates.
3.2. Robustness: “top revenue performers” based on income levels
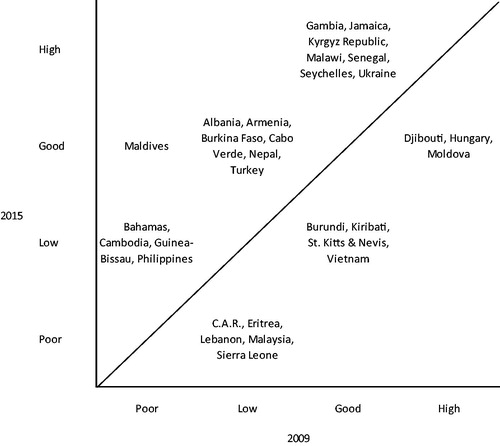
Some of the above tax-to-GDP increases might have been driven by temporary economic or structural factors, rather than underlying revenue administration or tax policy changes. Following von Haldenwang and Ivanyna (Citation2012), we employ a second strategy for all countries that relates countries’ tax-to-GDP ratios to their development levels, as measured by their GDP per capita. We find that between 2009 and 2015, some countries have experienced significant changes in their tax performance and moved to higher tax performance categories ().
Figure 4. Comparison of tax revenue to GDP per capita performance matrix. Notes: Comparisons made to line of best fit based on 2015 values by country group. The residual from the 2015 line of best fit is compared to the percentile. Below the 15th percentile is classified as “Poor,” between the 15th and 50th percentile is “Low,” from 50th to 85th is “Good” and above 85th is “High.” Source: IMF staff estimates.
3.3. Main characteristics of tax revenue mobilization episodes
3.3.1. Duration of episodes
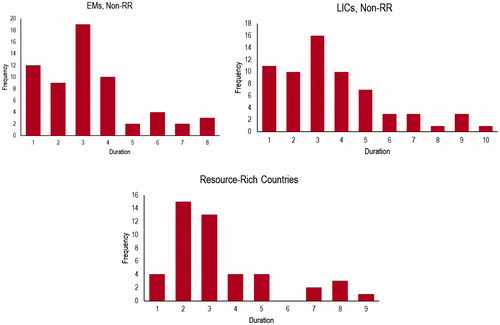
plots the length of the identified episodes. The average episode duration is 3.5 years in RR countries and 3.4 years in non-RR countries, with a median duration of 3 years across all countries. Episodes could be shorter than three years if the entire 1.5 percent increase (or more) occurred within one or two years only. Indeed, 16 percent of episodes lasted only one year. Notably, 23 percent of the identified episodes lasted for longer than 5 years, implying that some countries registered a sustained increase over a longer period.
Figure 5. Episode duration. Note: Episodes are defined as 3-year compounded windows of an average increase of 0.5 percent per year or more. The first episode is triggered by the first 3-year window in which the tax-to-GDP ratio increases by an average of at least 0.5 percent per year (1.5 percent within three years). Sources: WoRLD, WEO, and IMF staff estimates.
3.3.2. Initial tax ratios
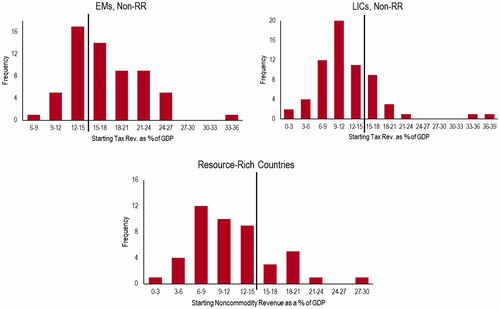
Episodes of tax revenue mobilization occurred with both low and high initial tax-to-GDP ratios. presents the initial tax ratio also in relation to the “tipping point” of tax revenue, around 13 percent of GDP, after which countries tend to experience higher and sustained economic growth, as defined in Gaspar, Jaramillo, and Wingender (Citation2016a) and Gaspar, Jaramillo, and Wingender (Citation2016b). For LICs and RR countries, most large increases began while the tax-to-GDP/non-commodity revenue-to-GDP ratio was below 15 percent. EMs frequently registered larger increases starting beyond a ratio of 15 percent, which reflects the higher average tax ratios in these countries. It thus seems that revenue mobilization can be achieved from a wide range of initial revenue ratios, although it is more frequently observed from a lower starting point.
Figure 6. Initial revenue ratios at the onset of successful revenue mobilization. Note: Vertical lines represent the “tipping point” of tax revenue to GDP in Gaspar, Jaramillo, and Wingender (Citation2016a) and Gaspar, Jaramillo, and Wingender (Citation2016b), which finds that countries which achieve a tax-to-GDP rate of at least 12.75 experience sustained economic growth. Even past this tipping point, the data displays room from improvement. Sources: WoRLD, WEO, and IMF staff estimates.
3.3.3. Sustainability of end-of-episode tax ratios
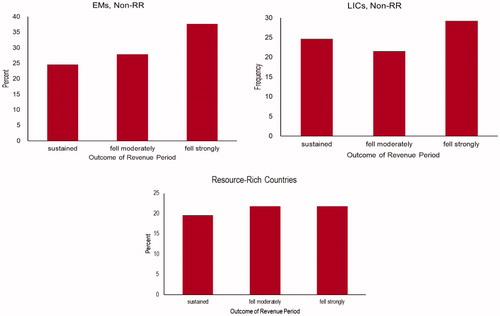
Sustainability of the achieved revenue gain is a crucial element of any tax reform. shows that revenue increases were sustained/increased in slightly less than one third of the cases, while it fell by up to one third of the initial tax revenue increase in close to one third of the cases. In more than one third of the cases the gains were not sustained, which is especially the case in RR countries. In the majority of cases, the decline in tax revenue at the end of the episode was explained by macroeconomic shocks (internal or external, above all the global financial crisis) and/or revenue-reducing policy measures.7
Figure 7. Short-term sustainability of revenue increase. Notes: Sustained indicates that revenue increased/stayed the same for at least three years after the revenue period ended (two years for episodes ending in 2015). Fell moderately indicates revenue fell by less than one third of the overall increase. Fell strongly indicates a fall of more than one third of the overall increase.
4. Tax policy and administration reforms behind revenue mobilization
For the countries and episodes identified above, we conduct a country-by-country in-depth policy analysis to identify the discretionary tax revenue measures that have been implemented during the episodes. To focus on countries with tangible tax revenue mobilization results, we limit the 172 episodes from the first identification method to: (i) countries that have increased their tax-to-GDP ratios by a minimum of 0.5 percent each year for at least 3 consecutive years (48 cases); and (ii) countries with beyond average tax increases (72 cases),8 with 19 cases overlapping between the two methods In addition, we add the 6 countries identified under the robustness analysis (Section 3.2.) that are not identified under the previous two methods, giving a total of 107 countries subject to in-depth analysis.
Overall, we find evidence of underlying revenue administration and tax policy measures that coincide with the observed tax revenue increase in 55 out of 107 studied cases. presents details of the episodes as well as the main identified measures. This main table is accompanied by several appendices providing more information (see Appendices 3–5). In summary:
Table 1. Summary of identified episodes.
Large revenue mobilization is most frequently accompanied by a combination of: (i) rationalization of exemptions; (ii) implementation of or adjustments to a broad-based VAT and other goods and services taxes; (iii) rate changes to or introduction of excises on a few selected goods; (iv) strong revenue administration management and governance arrangements; and (v) improvements in core tax administration functions.
Revenue administration measures underpinned revenue mobilization efforts in almost all the episodes and country cases, regardless of the income group and the range of tax policy measures ().
Overall, most of the reforms are broadly consistent with IMF staff advice on tax policy and revenue administration.9 This is in line with the observation that 58 percent of the analyzed episodes were accompanied by IMF programs (last column in ). As outlined in Crivelli and Gupta (Citation2014), IMF programs tend to have a positive effect on tax revenue, especially where revenue conditionality applies, and most strongly for LICs where the revenue ratios are below the group average.
Although the findings are suggestive, they do not infer any causal linkages. We cannot infer causality, as several other factors, such as the sectoral composition of output, foreign aid and investment, external debt, and various political-institutional indicators would need to be controlled for to establish causality, which is beyond the scope of this paper. However, analysis of documents for the studied episodes tended to suggest strong linkages between policy measures and observed revenue increases.
Any cross-country lessons should be tailored to country-specific circumstances. It is well established that successful tax reform should take into account the country’s institutional and societal preferences (Bert Citation2011; OECD Citation2010). Moreover, applying tax reform lessons to a specific country calls for a selective adaptation as equity and political economy factors can become serious implementation obstacles. Three follow-up papers discuss cases studies in more detail (Akitoby, Honda, et al. Citation2019; Akitoby, Baum, et al. Citation2019; Akitoby, Honda, and Primus Citation2019), which will help public authorities to tailor their revenue mobilization design to country successes with similar political or economic backgrounds.
4.1. Key findings – tax policy measures
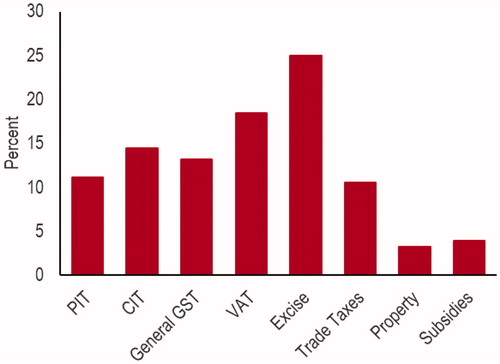
Large tax revenue increases often coincide with higher collection of revenue from indirect taxation. shows the frequency of the tax policy measures, presented as the ratio of the observations in a specific category to total identified tax policy measures. Changes to indirect taxation make up more than 56 percent of all discretionary tax policy changes. This result mirrors the overall increase in indirect tax ratios in both LICs and EMs. Changes to income taxes account for 26 percent.
Figure 8. Frequency of tax policy instruments (in percent). Note: Ratio of observations in a specific category to total identified discretionary measures. Source: IMF staff estimates.
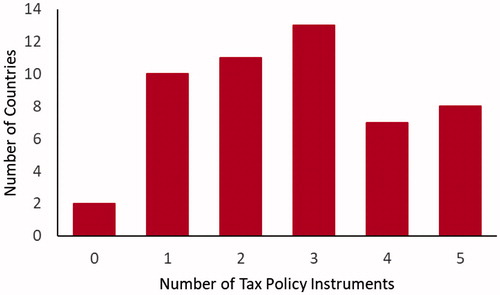
Countries rely on a wide range of tax policy instruments in their revenue mobilization reforms. As can be seen in , most of the country-episodes used multiple tax instruments (“0” tax policy instruments indicate revenue administration was the primary reform-driver). For example, Belize, 2013–2014 (GST and excise taxes), Kyrgyz Republic, 2011–2012 (CIT, VAT, excises, and other GST), and Seychelles, 2008–2011 (PIT, CIT, VAT, excises, other GST, trade taxes and subsidies) all used two or more tools in parallel.
Figure 9. Number of tax policy instruments used per episode. Source: IMF staff estimates.
Rate changes and reduction of exemptions lead the tax policy mix. We split the tax policy measures into tax introductions (“new taxes”), rate changes (positive or negative), threshold changes (increases or reductions), and changes to exemptions, the latter two falling under base broadening. Appendix 4 provides a detailed breakdown per country, summarized in and . Rate changes are most common (85 out of 187 observations, excluding subsidies), primarily for excise taxation. Reductions in exemptions, mostly to VAT, CIT, and other goods and services taxes, are the second most frequent tax policy tool to mobilize revenue. Threshold changes are not common during the identified episodes.
Figure 10. Frequency of introductions, rate and base changes. Source: IMF staff estimates.
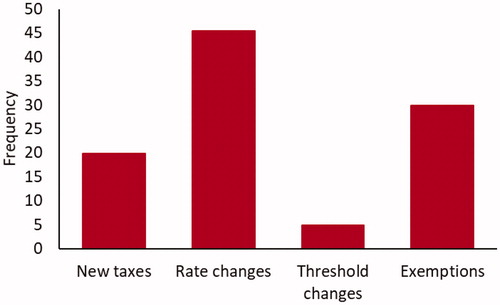
Table 2. Introductions, rate and base changes.
Rate increases are observed primarily for indirect taxes, while rate changes to PIT and CIT were primarily negative (). 7 out of 10 rate changes were negative for both PIT and CIT during the identified episodes (see also Appendix 4), partly aimed at stimulating economic activity, and following international trends, especially for CIT rates. Often, these reductions were balanced by tax increases in indirect tax categories (for example in The Gambia, Liberia, and Seychelles). Similarly, half of the identified 8 threshold adjustments were increases. The impact from threshold reductions is not necessarily positive, and changes are often aimed at re-distributional and efficiency concerns rather than revenue mobilization.
Broadening the tax base, which sometimes involved reducing the number of tax rates, was frequently part of revenue mobilization strategies. For example, Georgia simplified the tax system by reducing the number of taxes to be paid from 21 to 7; Morocco reduced the number of VAT special regimes; Jamaica introduced VAT to residential electricity consumption; and Seychelles converted the narrowly applied 7 percent GST into a broad-based 12 percent GST.
Curbing tax exemptions was a prominent measure. In more than half of the country episodes, various exemptions were eliminated, most frequently related to VAT, general GST, and CIT. Specific measures include reducing statutory and discretionary exemptions (for example in Guyana and Solomon Islands); ending tax holidays (Burkina Faso); ending CIT exemptions (Mauritania); and eliminating VAT exemptions (Uganda).
VAT and other general goods and services taxation (sales taxes) were a common measure for revenue mobilization. In some cases, it was observed that substantial increases in tax revenue followed the introduction of VAT (Bahamas, Bosnia and Herzegovina, Dominica, The Gambia, and Guyana), and rate hikes (for example Barbados and Tuvalu). In 48 percent of episodes, changes to VAT (introduction, rate changes, thresholds or exemptions) were an element of the revenue mobilization strategy, and 29 percent of episodes made use of changes to other general goods and services taxation.
Increases in excise taxation were frequently applied. Excises are easy to implement and often used for immediate revenue needs or to balance revenue shortfalls from other reforms. In our sample, higher excise taxes were often levied on fuels, tobacco, alcoholic and nonalcoholic drinks, and cars. In other cases, increases in excise taxes were imposed on the telecom sector (for instance, Guyana and The Gambia). Changes to excises often accompanied other tax changes and did not generate large tax revenue changes by themselves.
Taxing sector-specific domestic economic rents (e.g. tourism, telecom, oil) was used in some countries. This strategy targets sectors in which profits have an element of location-specificity that can imply high potential for revenue mobilization. Examples include the Maldives (tourism sector), and Malawi and Rwanda (telecom).
Property taxation and the reduction of subsidies were least frequently observed. Property taxation was not a common tool to mobilize revenue, being observed in only 3 percent of cases, likely because it has not been broadly implemented in many developing countries. Similarly, legal loopholes (for instance, the absence of cadaster to define property rights) and weak tax administration capacity could limit its application as a policy tool, especially at the local level to which it is often allocated. At 4 percent of observations, the reduction of subsidies was infrequent, but indicates revenue raising potential from targeting inefficient subsidies.
4.2. Key findings – revenue administration measures
The analysis identifies several revenue administration measures that were implemented during the tax reform periods. Given the difficulty of measuring the impact of revenue administration measures, which often impact multiple revenue sources, this paper does not attempt to quantify their impact on tax collection, nor to empirically establish a causal link between such measures and the outcome.10 Based on international experiences, however, it is broadly accepted that tax administration measures that facilitate and enforce tax compliance help reduce the tax gap and thereby increase the tax yield (Brondolo et al. Citation2008).11
Revenue administration measures were used widely across many episodes. As shown in , , and Appendix 5, revenue administration measures were common in almost all (90 percent) of episodes, regardless of a country’s income group and the range of tax policy measures. In some cases (for example Sierra Leone and Republic of Congo), the authorities focused only on administrative measures during the tax reform period.
Figure 11. Revenue administration measures. Source: IMF staff estimates.
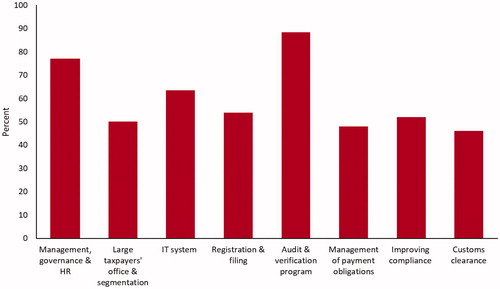
Steps to improve audits and other verification measures were undertaken in most countries that achieved an increase in tax revenue. 89 percent of the episodes that involved an improvement in revenue administration targeted changes in audits and verification programs (), with a focus on administering audits, combatting tax evasion and reducing corruption. Evidence shows that strengthening the auditing and enforcement capacity remains crucial for effective tax collection in developing countries (Carrillo, Pomeranz, and Singhal Citation2017).
Many countries focused on strengthening management, governance, and human resources (HR). Hiring more qualified staff, strategic planning and monitoring performance, focusing on training and development to strengthen technical skills of staff at tax and customs offices, and strengthening tax legislation to empower revenue collection agencies were commonly used measures (77 percent of episodes). In some cases, tax-to-GDP ratios increased following the setting up and empowering of a semi-autonomous revenue authority (e.g. Jamaica). This result is supported by Ebeke, Mansour, and Graziosi (Citation2016), who find that semi-autonomous revenue agencies have on average had a large and positive effect on non-resource taxes. However, establishing semi-autonomous agencies alone will not guarantee a revenue impact, especially if capacity and staffing are insufficient (Kidd and Crandall Citation2006).
In more than half of the episodes improvements in information technology (IT) systems provided support for core revenue administration processes. In these cases (for example in Burkina Faso, Tonga, Guinea-Bissau, and Uruguay), tax collection increased following the implementation of an IT strategic plan, the enhancement of the IT system, the computerization of tax and customs administration to support tax payments, and filing and use of third-party information.
Several countries employed measures to strengthen the registration process and improve filing. Improvements in tax revenue were supported by an increase in the number of registered taxpayers (Central African Republic), and in some cases re-registering taxpayers (Georgia, Guinea-Bissau). Several countries focused on ensuring timely filing and payment of taxes, and enforcing sanctions for failure to file.
Several countries improved voluntary compliance and strengthened the customs clearance process during the tax reform period. For instance, in Tonga, the increase in revenue coincided with strengthening tax compliance and reorganizing the one-stop shop for customs tariff payments. Guinea-Bissau strengthened customs administration by improving cross-border controls.
Some countries improved the management of payment obligations and strengthened segmentation (often focusing on large taxpayers). Developing a policy to limit, manage, and recover tax arrears were dominant strategies (Burundi, Comoros, Dominica). Some countries implemented a large taxpayer unit (LTU) (Cabo Verde, Uruguay) and strengthened management of large taxpayers to ensure timely filing and payment of taxes. Large taxpayers can account for as much as 80 percent of all tax revenue, therefore strengthening procedures targeted at them is seen as a critical reform step.12
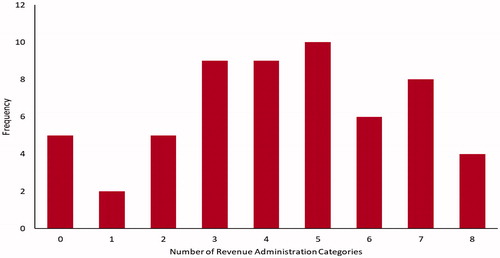
Countries often relied on an array of revenue administration instruments in their mobilization efforts. Most revenue administration measures are interlinked and closely associated, therefore a more comprehensive approach with multiple revenue administration instruments could enhance results if they are successfully implemented. In more than 30 percent of country-episodes, 4–5 elements of revenue administration were addressed in parallel (). For example, in Paraguay the authorities streamlined the auditing and collection process, improved the efficiency of the customs clearance process, and adopted measures to reduce corruption. The anti-corruption driven revenue mobilization strategy in Georgia (2003–2008) also benefitted from a range of administrative measures, including the mass-replacement and training of staff, strengthening of legal procedures for tax disputes, upgrading of IT, simplifying of tax returns and improvement of audits (Akitoby Citation2018; Akitoby et al. Citation2018b).13
Figure 12. Number of revenue administration instruments used. Source: IMF staff estimates.
In some cases, the initial success following tax policy measures was eroded in the absence of sustained reform efforts for revenue administration. For example, Antigua and Barbuda’s tax-to-GDP ratio increased temporarily following the introduction of a sales tax. However, most of the other tax categories declined during this time, amid limited improvements in tax and customs administration. Similarly, in The Gambia, the introduction of VAT was a positive contribution to revenue performance, but the limited capacity to enforce compliance caused VAT and other tax revenue growth to slow down, especially between 2015 and 2016. In general, almost all countries that sustained the increase undertook reforms to revenue administration, often in combination with other measures (see and Appendix 5).
5. Conclusions
This study provides an assessment of large tax revenue increases in LICs and EMs. The paper identifies and takes stock of reform episodes marked by such increases, describing the main tax policy and revenue administration measures undertaken. Although the findings are suggestive, they do not imply any causal linkages. Country- specific factors (e.g. macroeconomic, political economy, and institutional) would need to be controlled for to establish causality, which is beyond the scope of this paper. Nevertheless, the analysis shows that, despite the challenges that some countries have in enhancing their tax performance, significant increases in tax revenue are achievable and, in some cases, within reach over relatively short periods of time. A few common observations emerge from the country cases:
Sustained and large revenue gains are usually accompanied by a comprehensive strategy that interlinks tax policy reforms and revenue administration reforms. In other words, what and whom to tax go hand in hand with how to collect these taxes. Combining several tax instruments (e.g. increasing the VAT rate and reducing the PIT rate) was observed to be the norm. In only a few cases were revenue administrative and tax policy measures not jointly used during the revenue mobilization episode.
Rate increases in indirect taxation and broadening the tax base for both direct and indirect taxation were the most frequently observed tax policy instruments. Rate increases were most common in excises and GST, followed by the elimination of exemptions and tax holidays. In some episodes the system of taxation was simplified, for example by reducing the number of taxes to be paid or by introducing a broad-based VAT. Property taxes played a limited role during the identified episodes in both LICs and EMs, likely due to legal loopholes (for instance, the absence of cadaster to define property rights) and weak tax administration capacity, especially at the local level.
Capacity enhancing measures in revenue administration were most frequently observed in risked-based audits, management, governance and human resource strategies, as well as enhancements to the IT system.
Acknowledgments
We are grateful for helpful comments and suggestions from Enriko Aav, Katherine Baer, Ruud De Mooij, Vitor Gaspar, Jiro Honda, Michael Keen, Alexander Klemm, Mario Mansour, Andrew Okello, Abdelhak Senhadji, Juan Toro, and participants of IMF’s Fiscal Affairs Department seminar, as well as for generous support from FAD staff, particularly the Tax Policy and Revenue Administration divisions for review of the country cases. We are similarly grateful for the detailed suggestions and comments from in-depth review by various IMF staff. Further details on the analysis can be found in the IMF Working Paper (see Akitoby et al., Citation2018a, Citation2018b) and three forthcoming case-study papers on fragile states, low-income countries, and emerging markets (Akitoby, Honda, et al. Citation2019; Akitoby, Baum, et al. Citation2019; Akitoby, Honda, and Primus Citation2019).
Disclosure statement
No potential conflict of interest was reported by the authors.
Notes
Notes
1 IMF (Citation2011, p.6).
2 The dataset can be accessed on the IMF external website (https://www.imf.org/∼/media/Files/Publications/WP/2018/datasets/wp18234.ashx).
3 Of the 71 EMs, 49 are non-RR; whereas 52 out of the 65 LICs are non-RR. Of the 136 countries in the sample, 31 are fragile states (FS). FS are defined according to IMF (Citation2017). See Appendix 1 for country groupings.
4 These data are sourced from the IMF’s Government Finance Statistics and World Economic Outlook (WEO) and the OECD.
5 See Fedelino, Ivanova, and Horton (Citation2009) for a derivation of the cyclically adjusted revenue ratio. It should be noted that with an assumed revenue elasticity to GDP of one, the ratio of cyclically adjusted tax revenue-to-trend GDP is equivalent to the ratio of tax revenue to GDP.
6 In the recent G20 Compact Initiative with Africa, Lagarde (Citation2017) noted that given the increased attention to build stronger institutions and improve growth outcomes, “there is no reason why countries should not aspire to achieving revenue gains of half a percent of GDP each year.”
7 This inference is made based on country reports and policy documents of the post-revenue mobilization periods of the in-depth analyzed country cases (presented in Section 5).
8 We determine “beyond average tax increase” cases in the following way: we plot the overall tax revenue increase against the duration of the episode; a line of best fit is used to separate cases of beyond average increase per episode length from below average increase per episode length.
9 While acknowledging that the timing, relative importance, and precise design of appropriate tax policy reform measures varies substantially, IMF (Citation2011) provides an extensive review of the lessons learned on revenue mobilization in developing countries.
10 It is difficult to isolate the influence of the inputs from the many other factors that can affect the outcomes (Crandall Citation2010).
11 Quantitative analysis presented in Brondolo et al. (Citation2008) showed that a reduction in the tax gap led to an increase in tax revenue in Indonesia.
12 Empirical studies, however, find somewhat mixed results on the impact of LTUs. Baum et al. (Citation2017) find evidence of a positive impact of the establishment of LTUs on revenue performance, whereas, in Sub-Saharan Africa, Ebeke, Mansour, and Graziosi (Citation2016) find that the existence of LTUs did not have a significant impact on tax revenue.
13 See also the IMF SDN (Citation2016) and IMF Board Paper (Citation2018) for detailed discussions on the link between fiscal institutions and corruption, and evidence showing that revenue reforms can have positive effects in reducing corruption.
14 Country classification is reported only for those countries for which tax revenue data are available.
References
- Akitoby, Bernardin. 2018. “Raising Revenue.” Finance and Development 55 (1): 18–21. doi:10.5089/9781484361535.001.
- Akitoby, Bernardin, Anja Baum, Clay Hackney, Olamide Harrison, Keyra Primus, and Veronique Salins. 2018a. “Large Tax Revenue Mobilization Episodes in Emerging Markets and Low-Income Countries: Lessons from a New Dataset.” IMF Working Paper 18/234, International Monetary Fund, Washington, DC. doi:10.5089/9781484361535.001.
- Akitoby, Bernardin, Anja Baum, Clay Hackney, Olamide Harrison, Keyra Primus, and Veronique Salins. 2018b. Dataset on Large Tax Revenue Mobilization in Low-Income Countries and Emerging Markets. Washington, DC: International Monetary Fund.
- Akitoby, Bernardin, Jiro Honda, Hiroaki Miyamoto, Keyra Primus, and Mouhamadou Sy. 2019. “Case Studies in Tax Revenue Mobilization in Low-Income Countries.” IMF Working Paper, 19/104, International Monetary Fund, Washington, DC. doi:10.5089/9781498314565.001.
- Akitoby, Bernardin, Anja Baum, Svetlana Cerovic, and Jiro Honda. 2019. “Tax Revenue Mobilization in Emerging Market Countries: Lessons from Country Cases.” IMF Working Paper, Forthcoming, International Monetary Fund, Washington, DC. doi:10.5089/9781484361535.001.
- Akitoby, Bernardin, Jiro Honda, and Keyra Primus. 2019. “Tax Revenues in Fragile States―Why Are They Low, and How Can we Raise Them?” IMF Working Paper, Forthcoming, International Monetary Fund, Washington, DC. doi:10.5089/9781498314565.001.
- Baum, Anja, Sanjeev Gupta, Elijah Kimani, and Sampawende Jules Tapsoba. 2017. “Corruption, Taxes and Compliance.” IMF Working Papers 15 (2): 190–216. doi:10.5089/9781484326039.001.
- Bert, Brys. 2011. “Making Fundamental Tax Reform Happen.” OECD Taxation Working Papers, No. 3. Paris: OECD Publishing.
- Besley, Timothy, and Torsten Persson. 2009. “The Origins of State Capacity: Property Rights, Taxation, and Politics.” American Economic Review 99 (4): 1218–1244. doi:10.1257/aer.99.4.1218.
- Besley, Timothy, and Torsten Persson. 2010. Pillars of Prosperity: Peace, Easy Taxes and the Rule of Law. London: London School of Economics.
- Brondolo, John, Carlos Silvani, Eric Le Borgne, and Frank Bosch. 2008. “Tax Administration Reform and Fiscal Adjustment: The Case of Indonesia (2001-07).” IMF Working Paper, WP/08/129, International Monetary Fund, Washington, DC.
- Carrillo, Paul, Dina Pomeranz, and Monica Singhal. 2017. “Dodging the Taxman: Firm Misreporting and Limits to Tax Enforcement.” American Economic Journal: Applied Economics 9 (2): 144–164. doi: https://doi.org/https://pubs.aeaweb.org/doi/pdf/10.1257/app.20140495
- Crandall, William. 2010. “Revenue Administration: Performance Measurement in Tax Administration.” IMF Technical Note. International Monetary Fund, Washington, DC. doi:10.5089/9781462316236.005.
- Crivelli, Ernesto, and Sanjeev Gupta. 2014. “Does Conditionality in IMF-Supported Programs Promote Revenue Reform?” IMF Working Paper, WP/14/206, International Monetary Fund, Washington, DC. doi:10.5089/9781484380048.001.
- Ebeke, Christian, Mario Mansour, and Grégoire Rota Graziosi. 2016. “The Power to Tax in Sub-Saharan Africa: LTUs, VATs, and SARAs.” Working Paper 154, Foundation for Studies and Research on International Development (FERDI), Clermont-Ferrand, France.
- Fedelino, Annalisa, Anna Ivanova, and Mark Horton. 2009. “Computing Cyclically Adjusted Balances and Automatic Stabilizers.” IMF Technical Note. International Monetary Fund, Washington, DC.
- Gaspar, Vitor, Laura Jaramillo, and Philippe Wingender. 2016a. “Political Institutions, State Building, and Tax Capacity: Crossing the Tipping Point.” IMF Working Paper, WP/16/233, International Monetary Fund, Washington, DC. doi:10.5089/9781475558142.001.
- Gaspar, Vitor, Laura Jaramillo, and Philippe Wingender. 2016b. “Tax Capacity and Growth: Is There a Tipping Point?” IMF Working Paper, WP/16/234, International Monetary Fund, Washington, DC. doi:10.5089/9781475558173.001.
- International Monetary Fund (IMF). 2011. Revenue Mobilization in Developing Countries. Washington: International Monetary Fund.
- International Monetary Fund (IMF). 2016. “Corruption: Costs and Mitigating Strategies.” IMF Staff Discussion Note SDN/16/05, International Monetary Fund, Washington, DC.
- International Monetary Fund (IMF). 2017. “Building Fiscal Capacity in Fragile State.” IMF Policy Paper, International Monetary Fund, Washington, DC.
- International Monetary Fund (IMF). 2018. “Review of 1997 Guidance Note on Governance – a Proposed Framework for Enhanced Fund Engagement.” IMF Policy Paper, International Monetary Fund, Washington, DC.
- Keen, Michael. 2013. “The Anatomy of the VAT.” IMF Working Paper, WP/13/111, International Monetary Fund, Washington, DC. doi:10.5089/9781484330586.001.
- Kidd, Maureen, and William Crandall. 2006. “Revenue Authorities: Issues and Problems in Evaluating Their Success.” IMF Working Paper, WP/06/240, International Monetary Fund, Washington, DC.
- Lagarde, Christine. 2017. “The Compact with Africa—The Contribution of the IMF,” IMF Blog. https://blogs.imf.org/2017/06/12/the-compact-with-africa-the-contribution-of-the-imf/.
- OECD. 2010. Making Reform Happen: Lessons from OECD Countries. Paris: OECD Publishing.
- von Haldenwang, Christian, and Maksym Ivanyna. 2012. “A Comparative View on the Tax Performance of Developing Countries: Regional Patterns, Non-Tax Revenue and Governance.” Economics: The Open-Access, Open-Assessment E-Journal 6: 1–44. doi:10.5018/economics-ejournal.ja.2012-32.
Appendix 1. Country classification14
Table A1.1. Development classification.
Table AI.2. Regional classification.
Appendix 2. Summary statistics
Table A2.1. Summary Statistics, as a percent of GDP, 2000–2015.
Table AII.2. Tax revenue average by region (EMs and LICs), 2000–2015, as a percent of GDP.
Appendix 3. Method of identification of episodes