
Abstract
This paper uses anti-money laundering as a case study to illustrate the benefits of cross-disciplinary engagement when major policymaking functions develop separately from public policy design principles. It finds that the anti-money laundering policy intervention has less than 0.1 percent impact on criminal finances, compliance costs exceed recovered criminal funds more than a hundred times over, and banks, taxpayers and ordinary citizens are penalized more than criminal enterprises. The data are poorly validated and methodological inconsistencies rife, so findings cannot be definitive, but there is a huge gap between policy intent and results. The scale of the problem not addressed by “solutions” repeatedly “fixing” the same perceived issues suggest that blaming banks for not “properly” implementing anti-money laundering laws is a convenient fiction. Fundamental problems may lie instead with the design of the core policy prescription itself. With an important policymaking function operating largely as an independent silo of specialist knowledge, this paper suggests that active engagement with critical, diverse perspectives, and deeper connections between the anti-money laundering movement and other disciplines (notably, policy effectiveness, outcomes and evaluation principles of public policy) should contribute to better results.
1. Introduction
A worldwide policy paradigm enforcing complex anti-money laundering laws gives the comfort of activity and feeling of security but does not make us safe from crime. Letting criminal enterprises retain up to 99.95 percent of criminal proceeds, the modern anti-money laundering experiment unwittingly enables, protects and supports terrorists, drug, human, arms and wildlife traffickers, sex and labor exploiters, and corrupt officials, fraudsters and tax evaders on a global scale. Anti-money laundering is a globally significant policymaking function affecting millions of businesses and billions of people daily, so it seems odd that policy design issues are mostly addressed independently. More explicit connections with the rigor of policy science should contribute to better results.
2. What is the problem?
The modern anti-money laundering movement is fundamentally ineffective, with evidence of policy failure obscured by idiosyncratic “effectiveness” evaluations poorly connected with policy design principles. This section briefly notes some of the key problems detailed later in this paper.
2.1. No success metric, minimal data
Despite trillions of dollars poured into the global 30-year “war” against money laundering, the anti-money laundering movement remains unable to show policy success.
To evaluate outcomes, the key policy issue is the standard by which effectiveness should be assessed. The primary goal…was to use money flows to detect and prevent serious crime, and thereby…reduce and prevent the economic and social harm caused by serious profit-motivated crime. It is against such outcomes that effectiveness might best be judged. Curiously, no such (crime reduction and prevention) measures were identified. (Pol Citation2018b, 295)
Absent specific, measurable crime reduction and prevention objectives since the beginning of the modern anti-money laundering experiment in 1990, so-called “outcome” metrics of a new “effectiveness” methodology (operational since 2014) also fail meaningfully to assess effectiveness, outlined in Section 5. In essence, “misapplication of outcome labels to outputs and activities miss an opportunity properly to evaluate outcomes, as the impact and effect of [anti-money laundering] policies” (Pol Citation2018a, 216). Consequently, the anti-money laundering movement remains incapable of demonstrating effectiveness as generally understood in public policy as the impact and effect of policy intervention.
Furthermore, the absence of adequate success metrics likely contributes to relatively little awareness (and less acceptance) of policy failure, compounding and extending three decades marked by results measured as a fraction of a percentage point away from complete failure.
2.2. Ineffective to the core
This paper uses elements of cost-benefit analysis so routine in public policy as to be mundane, yet surprisingly rare in anti-money laundering discourse (reflecting a persistent reluctance to consider costs or show outcomes in terms of the impact of policy intervention). This method joins a line of scholarship critically testing core elements of the anti-money laundering system; notably, its limited capacity to prevent serious profit-motivated crime and terrorism (Anand Citation2011; Brzoska Citation2016; Chaikin Citation2009; Ferwerda Citation2009; Findley, Nielson, and Sharman Citation2014; Harvey Citation2008; Levi Citation2002, Citation2012; Levi and Maguire Citation2004; Levi and Reuter Citation2006, Citation2009; Naylor Citation2005; Pol Citation2018b; Reuter and Truman Citation2004; Rider Citation2002a, Citation2002b, Citation2004; Sharman Citation2011; van Duyne Citation2003, Citation2011; Verhage Citation2017).
2.3. Poor connections with other disciplines
Compounding the above issues, even striking parallels between the public policy and anti-money laundering fields appear not to have prompted much cross-fertilization between them.
For example, Peters’ (Citation2015, 270) “simplistic tools” of performance management metrics (undermining the capacity to address higher-order issues, and contributing to policy failure) is reflected in anti-money laundering ratings, but, absent much cross-disciplinary discourse, there is little opportunity to benefit from such warnings. The first independent assessments of new ratings intended to gauge the effectiveness of money laundering controls found simplistic metrics incapable of assessing outcomes (Pol Citation2018a), and an evaluation system with little resemblance to evaluations as “generally understood by public policy and social science researchers, namely how well an intervention does in achieving its goals” (Levi, Reuter, and Halliday Citation2018, 310). Despite such structural design flaws there remain surprisingly few connections between anti-money laundering practice and the scholarship and practice of public policy. (Examples include de Koker and Turkington Citation2015; Halliday, Levi, and Reuter Citation2014; Levi et al. Citation2018; McConnell Citation2015, 238; Pol Citation2018a, Citation2018b, Citation2019a, Citation2020; Sharman Citation2011; Zoppei Citation2017).
Few explicit connections with policy design principles may help explain scant recognition that the core “compliance” intervention model may itself significantly contribute to poor results.
2.4. Poor outcomes, as designed
The international anti-money laundering policymaking agency, the Paris-based Financial Action Task Force (FATF Citation2013b, 5, 17, 22), described its last major policy shift (a new “effectiveness” methodology, noted above), as “fundamentally different”, yet the core policy design feature remains unchanged since it was hastily developed in 1990. Frequent updates adjust how the system operates, but the primary “compliance with rules based on standards” operating model remains unquestioned, and seemingly unquestionable, despite evidence of policy failure and no clear line of sight to key objectives.
3. Why does it matter?
Despite a policy framework with complex laws spanning the globe, the anti-money laundering experiment is markedly ineffective. In the absence of meaningful “official” success metrics, by one measure (albeit a proxy for effectiveness, as outlined in Section 5.3) authorities recover 0.05 percent of illicit funds. This suggests that the impact of the policy prescription is scarcely a rounding error in criminal accounts if “Criminals, Inc” keep up to 99.95 percent of the proceeds of serious crime. While the anti-money laundering industry focuses on the business (and busy-ness) of implementing compliance controls, rather than core design features fundamentally affecting the success of such activities, there is, nonetheless, opportunity for change.
3.1. Strategic review and growing calls for effectiveness
In October 2019, FATF (Citation2019c) commenced a strategic review to improve efficiency and effectiveness and guide the industry’s direction after the current (fourth) round of assessing countries’ compliance with its policy framework. (With three rounds of evaluations completed since 1990, the fourth round began in 2014 and is due to conclude in 2024.) A few months later, an influential group of global banks amplified researchers’ earlier calls to engage with policy effectiveness principles (Halliday et al. Citation2014; Levi et al. Citation2018; Pol Citation2018a, Citation2018b, Citation2019a, Citation2019b, Citation2019c, Citation2020). The Wolfsberg Group (Citation2019) reiterated calls to focus on outcomes rather than just compliance.
Even if FATF’s current review ultimately proves more technically focused than strategic (like earlier such reviews) any change matters, because FATF’s policymaking function is profoundly influential. In a remarkable feat of international adoption of standardized policies (“despite a lack of strong evidence about their instrumental effectiveness” (Jones, Blaustein, and Newburn Citation2020, citing Sharman Citation2008) FATF’s anti-money laundering standards, in effect, dictate policies, laws and regulatory practices in 205 countries and jurisdictions. Any changes will affect millions of businesses and billions of people.
Mounting calls for effectiveness suggest opportunity to reorient policy frameworks for better outcomes, but significant challenges must be overcome.
4. Challenges unlocking value from failure
Policy failure is neither uncommon nor unexpected, and can be impetus for innovation, provided that it is acknowledged, thereby enabling policies and governance arrangements recalibrated for success. The literature is full of examples, lessons, and frameworks facilitating better outcomes (e.g. Bovens Citation2010; Howlett Citation2011, Citation2012, Citation2019; Howlett, Ramesh, and Wu Citation2015; King and Crewe Citation2013; Marsh and McConnell Citation2010a, Citation2010b; McConnell Citation2010a, Citation2010b, Citation2011, Citation2015; Newman and Head Citation2015).
In the anti-money laundering realm, however, persistent failure is marked by missing and contested evidence of “what works and why.” Anecdotal successes may not prove policy success, but individual success stories mask the reality of overall policy failure. Relevant data are also scant (Levi et al. Citation2018; Pol Citation2019a) and obscured by prevailing belief systems and narratives. For instance, the perceived failure of banks and regulators “properly” or “fully” to implement existing rules is often blamed, despite countervailing evidence (noted in Section 6). Likewise, FATF blames governments for “taking a tick-box approach to regulatory compliance, and focusing on processes rather than outcomes” (Lewis Citation2019), seemingly oblivious to public policy issues such as whether the design or implementation of its policy model contributes to (or causes) such behaviors. Unasked, for instance, is whether FATF’s model is itself a “tick-box” regulatory framework, if its “outcome” measures properly constitute outcomes as generally recognized (Halliday et al. Citation2014; Levi et al. Citation2018; Pol Citation2018a, Citation2018b), or whether FATF’s idiosyncratic assessment methodology forces governments to measure processes rather than outcomes, of which it now complains.
There are also conflicting interpretations of success, and each may be “right,” at least in part. As outlined in Section 5, failure in one area does not preclude achievement in another, and initial evidence of success may ultimately prove the opposite, and vice versa.
Similarly, common responses to policy failure apply the same policy prescription, more efficiently and with renewed vigor, yet demonstrating that such efforts repeatedly produce poor outcomes has proven insufficient to break the cycle. Why evidence of policy failure has not prompted a serious review of core policy design features is under-researched, and likely manifold. Groupthink is one possibility. Policymakers, regulators and practitioners may reject perceived criticism unreflectively. Not because they are not well-meaning, with genuine intent to solve the problem, but because they are. If their efforts produce successes, and other experts “just like them” agree, any talk of failure “must” be wrong. Rather than prompt reconsideration, derogation and marginalization of out-group critical thinking, and constant repetition of in-group assumptions, may serve instead to amplify and reinforce a common narrative.
Universal application of anti-money laundering rules might also help explain why there seems little or no perceived need to question or rigorously test core assumptions underpinning the policy prescription.
Many stakeholders also have strong incentives to repeat (or not openly question), rather than rigorously test, the official narrative. Hundreds of thousands of businesses and professionals comprise a business ecosystem dependent on the current paradigm. Banks must also avoid or mitigate regulatory sanction, which means implementing anti-money laundering programs complying with laws dictated by standards framed in the global policy prescription. In a compliance-oriented intervention model, if such laws achieve their policy objective, or not, is mostly immaterial. Banks and other firms must comply, or risk ruinous reputational damage and financial penalties. Nor are sovereign nations immune to pressure. Although supposedly voluntary (de Oliveira Citation2018, 159–160; Pol Citation2019b; Sharman Citation2008; Citation2011, 7), countries deemed non-compliant are “threatened with limited access to financial services” (de Oliveira Citation2018, 159) and FATF admits that governments must gain its tick of approval to ensure uninterrupted access to international financial markets (FATF Citation2019b, 65; Lewis Citation2019). In colloquial terms, it is difficult to imagine a stronger motivation to “play the game” (or at least “not rock the boat”) than the risk of economy-wide harm.
These are just some of the challenges to unlocking policy success. Before quantifying the scale of the current policy deficit, in Section 6, the next section briefly contextualizes the policy environment.
5. The policy environment
For readers unacquainted with money laundering or endeavors to mitigate its perceived harms, and for anti-money laundering practitioners unfamiliar with public policy, this section outlines each policy environment and concludes with an explanation of the policy objective.
5.1. Money laundering 101
A common element in all serious profit-motivated crime, money laundering makes criminal income appear to be derived legitimately. A drug trafficker might buy real estate with criminally-acquired funds, for example, amassing a portfolio of assets so that illicit wealth seems lawfully gained. Successfully laundering the proceeds of crime therefore protects and enables criminal enterprise.
In 1989 the G7 summit (a forum of leaders of major industrialized nations) sought to extend efforts to combat organized crime, particularly drug trafficking (G7 Citation1989). They created FATF to help national authorities harness the intelligence value of financial transactions. Despite the absence of any alternative policy formulations (and without seeking any), FATF repeatedly declared its “40 recommendations” as “best practice”, and 205 countries and jurisdictions now criminalize money laundering and participate in a coordinated network disseminating its standards globally.
A series of assumptions underpin the current policy paradigm, including the belief that money laundering causes harm and should be stopped, and that making certain businesses perform complex tasks based on international standards is an appropriate mechanism to combat money laundering. In practical terms, laws based on FATF standards require millions of financial institutions and other businesses to meet intricate compliance obligations, verify their customers’ identities and source of funds, monitor financial transactions, and report specified types of transactions and “suspicious” activities to authorities.
A “mutual evaluation” process also rates state actor conformity. Since 2014, as well as assessing compliance with FATF’s 40 recommendations promulgated in 1990 and revised many times since, a new methodology rates countries’ compliance with 11 “outcomes” said to represent the goals of an “effective” anti-money laundering regime (FATF Citation2013a, Citation2013c). Universally adopted, there seems little perceived need to question the framework, despite arguments that its design and implementation fail to evaluate effectiveness as it purports (Halliday et al. Citation2014; Levi et al. Citation2018; Pol Citation2018a, Citation2019a). The new framework’s terminology also suggests links between anti-money laundering practice and policy and evaluation principles, yet the evaluation processes casually use “effectiveness” and “outcomes” language mostly absent their public policy foundation.
5.2. Policy effectiveness 101
Building on and supplemented by Bovens and others (Bovens Citation2010; Bovens and ‘t Hart Citation1996; Bovens, ‘t Hart, and Peters Citation2001), Marsh and McConnell (Citation2010a, Citation2010b; McConnell Citation2010a, Citation2010b, Citation2011, Citation2015) developed a coherent overarching synthesis defining policy success and failure. Helping policymakers “think more systematically about a key; indeed, in some ways, “the” key, issue in public policy,” Marsh and McConnell (Citation2010a, 581) define policy success with objective (fact) and subjective (interpretative) elements, and enable assessment beyond simple success/failure labels across three policy dimensions: process (implementation), politics (political consequences), and program (outcomes). presents a simple visualization of the anti-money laundering policy endeavor.
Figure 1. Policy success heatmap: anti-money laundering.
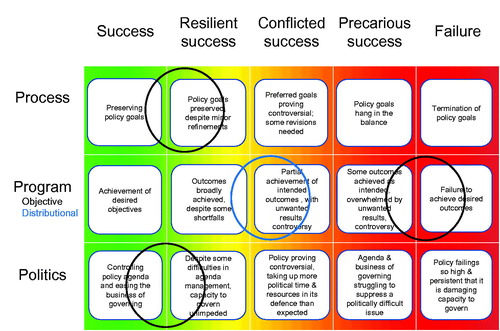
A fourth category proposed by Newman and Head (Citation2015) is illustrated instead by separating the program dimension into sub-categories: “objective attainment” (outcomes) and “distributional outcomes” (negative consequences such as financial loss or rights infringement). The authors’ examples also indicate nuance in the first sub-category relevant for anti-money laundering. Evaluations typically assess results against stated “official” objectives, but these may be flawed, imprecise, or unachievable (Citation2015, 245), or there may be multiple objectives and hidden agendas (McConnell Citation2018). In practical terms, the “program/objective” category should list each relevant goal, so that each can be assessed.
Encouraged by Marsh and McConnell’s (Citation2010b, 587) call for dialogue, a minor adjustment to the framework helps its use. Gradations between success and failure can be represented visually in a “heatmap”, with unqualified success in green, unmitigated failure red, and gradations between – visibly illustrating that policies may be successful in some realms while failing in others. Heatmap visualizations help evaluate and improve policy initiatives by identifying and more readily addressing “key trade-offs and tensions…at the heart of the dynamics of public policy” (McConnell Citation2010a, 357).
Briefly describing , in each dimension:
Politics. The speed with which the anti-money laundering writ became globally ubiquitous is a remarkable achievement in the political realm. Notwithstanding criticism of non-consensual norm-making, laws adopted irrespective of need, and disregard for cost-effectiveness (Ebikake Citation2016; Levi Citation2012; Sharman Citation2008, Citation2011), together suggesting “resilient success”, global and domestic political consensus leaves this dimension mostly in the green success zone.
Process. More criticism has “stuck” in this dimension, with researchers noting that global policy diffusion involved coercion, competitive pressures and policy “mimicry”, and revealing manifold gaps between intention and results more than a decade before FATF’s attempted pivot toward effectiveness (Ferwerda Citation2009; Jones et al. Citation2020; Levi Citation2012, 398; Levi and Reuter Citation2006, 308; Pol Citation2019b; Sharman Citation2008; Citation2011, 4). Although tensions remain, like resistance to the extension of money laundering controls to professional facilitators of financial transactions, notably lawyers, FATF frequently adjusts recommendations to meet evolving needs, indicating “resilient success”.
Program. In Newman and Head’s “distributional” category (the first, blue, circle in ), money laundering controls cause considerable inconvenience to ordinary citizens and deny or restrict banking services to many sections of society (de Koker Citation2011, Citation2014, Citation2018, Citation2019). Some of these issues are being addressed, illustrating a temporal element. Policy failure (and success) can change over time, in any dimension. In the meantime, the remainder of this paper addresses persistent failure on the program/objective dimension (the second, black, circle in the second row).
Before quantifying the gap between intention and results, it is necessary to address the policy objective.
5.3. Policy objective: criminal asset forfeiture rate as proxy indicator for harm reduction
The outcome sought is a critical factor in determining policy success. This paper does not definitively assert “the” measure for assessing anti-money laundering policy effectiveness. That endeavor would benefit from multi-disciplinary dialogue, not least because the anti-money laundering movement may be no closer to a sound policy objective, nor an adequate effectiveness measure, than three decades ago.
However, a primary goal for establishing the contemporary anti-money laundering regime was to use money flows to detect and prevent serious crime (G7 Citation1989; United Nations [UN] Citation1985, Citation1988). Curiously, however, no meaningful crime reduction or prevention measures were developed to measure success (Pol Citation2018b, 295). Moreover, FATF’s (Citation2019a) “high-level objective” (protecting financial systems and the broader economy from the perceived threats of money laundering) lacks specificity, measurability, or any clear statement of the impact of policy interventions. It is so general as to be practically meaningless as an effectiveness measure (Pol Citation2018b). Associated metrics purporting to assess effectiveness also fail functionally to match public policy evaluation and outcomes principles and practice (Levi et al. Citation2018, 310; Pol Citation2018a). The main problem is that the “effectiveness” methodology based on specified “outcomes” is “not an outcome-oriented framework as it purports” (Pol Citation2018a, 216). Effort and activity wrongly labeled “outcomes” fail to evaluate the impact and effect of the policy intervention. In essence, the modern anti-money laundering system lacks meaningful success metrics.
Arguably the “best” success measure involves a substantial, demonstrable, sustainable reduction in the harms from serious profit-motivated and other financially indicated crime, including terrorism. The social and economic damage wrought by terrorism, and by drug, human and arms trafficking, corruption, fraud, tax evasion and other serious crimes is immense. Materially reducing their incidence and impact benefits millions of people directly affected, and every community, economy, and society. Unfortunately, “suitable data to prepare informed estimates of cost and assessment of harm are lacking [or] unreliable. However, this does not mean that social harms cannot be identified” (Den Boer et al. Citation2017, 1), only that there is insufficient data on the harms from crime, and the impact of policy choices, to currently be a suitable success measure.
Without a meaningful “official” effectiveness measure, and absent adequate data to measure crime harms, this paper adopts the United Nations’ “success rate” of money laundering controls as an available proxy for crime and harm prevention objectives expressed when the G7 nations established FATF and, consequently, the modern anti-money laundering experiment (G7 Citation1989). Such interception rates are imperfect outcome measures (Pol Citation2018b, 296), but the proportion of criminal funds intercepted offers an interim effectiveness measure. It also starkly illustrates the gap between policy intention and results.
6. How big is the problem?
This section extends a line of research showing that authorities intercept a tiny proportion of criminal funds, and introduces a wider perspective with available evidence about compliance costs and penalties.
6.1. Europe’s anti-money laundering effort “almost completely ineffective”
In response to multiple banking scandals, European policymakers asserted the need to “better address money-laundering…threats” and “contribute to promoting the integrity of the EU’s financial system” (European Commission Citation2018).
Like FATF’s “high-level objective”, such descriptions lack a specific, measurable policy objective. Nor did subsequent policy proposals reassess the fundamental policy objective or meaningfully connect with public policy principles. With the capacity to identify failure seemingly locked in a bubble of industry-specific knowledge, proclaimed “loopholes” and “shortcomings” would be “fixed”, apparently, by extending and more rigorously applying the current policy model. For instance, the European Commission’s explanation for a series of bank scandals asserted that financial institutions didn’t fully comply with anti-money laundering obligations, and claimed that national authorities failed adequately to cooperate or apply rules consistently (European Commission Citation2019a, Citation2019b, Citation2019c). The proposed “solution” therefore seeks to improve interagency co-operation, even though such explanations appear grounded on unverified, untested, and possibly false assumptions.
Even irrespective an apparent paucity of independent verification, the perceived lack of international coordination does not accord with the industry’s own evidence base. According to FATF ratings, international cooperation is the most highly rated of 11 “effectiveness” measures (Pol Citation2019a, Citation2020). The proposed “solution” also fails to countenance the possibility that, if banks complied fully with anti-money laundering obligations, the current policy intervention might still have almost zero impact on crime (Pol Citation2019c). Nor is that prospect untenable, with evidence suggesting astonishingly poor results (detailed later in this section).
Blaming banks and (typically, “other”) regulatory agencies may, therefore, be a convenient fiction. With complex regulations and billions of transactions, and the benefit of hindsight, fault can always be found (and may reinforce repeatedly looking for culpability in the same, easy to find, places), but the real issue may not be the extent of bank compliance or agency cooperation repeated in the echo-chamber of anti-money laundering orthodoxy. More fundamental problems may lie instead with the policy design itself, particularly in light of available data illustrating the scale of the problem persistently unaddressed by responses continually “fixing” the same perceived issues.
An extensive European study, for example, estimated “criminal revenues from [a] selected number of illicit markets (heroin, cocaine, cannabis, ecstasy, amphetamines, ITTP [illicit tobacco trade], counterfeiting, MTIC [VAT] fraud and cargo theft)” of “at least” €110 billion annually (Europol Citation2016, 4; Savona and Riccardi Citation2015, 35). Described as “very conservative”, the study excluded “important illicit markets, such as [human] trafficking…[and] extortion, illegal gambling and other types of fraud” (Savona and Riccardi Citation2015, 35).
In terms of the impact on profit-motivated crime revealed by such studies, Europol says that authorities only confiscate about €1.2 billion of illicit funds annually (2016, 4). This suggests that the proportion of criminal funds recovered, termed the “success rate” of anti-money laundering efforts by the UN (UNODC Citation2011, 14, 119, 131), is just 1.1 percent (Europol Citation2016, 4, 11).
On its face, this is higher than the United Nations’ global success rate (0.2 percent) (UNODC Citation2011, 14, 119, 131). Those figures are not, however, directly comparable. The UN calculation involves an estimated $3.1 billion of criminal assets seized (2011, 119, 131), whereas Europol’s 1.1 percent is the proportion ultimately confiscated. The UN calculations also use amounts laundered as the denominator ($1.6 trillion) rather than total estimated criminal proceeds ($2.1 trillion in 2009) (UNODC Citation2011, 5, 7, 119, 131). Adjusting for consistency, illicit funds seized globally as a proportion of criminal proceeds ($3.1 billion/$2.1 trillion) is 0.15 percent. If as Europol reports (Citation2016, 4, 11) about half the amount seized is ultimately confiscated, the equivalent UN “success rate” as the proportion of total proceeds of crime confiscated ($1.55 billion/$2.1 trillion) is 0.07 percent. In any event, the European confiscation rate appears higher, at 1.1 percent.
But, if “important” criminal activities excluded from Europe’s “very conservative” €110 billion estimate generate “only” another €10 billion, Europe’s success rate falls below one percent. Moreover, some of those uncounted markets are very profitable, which means that criminal revenues may be considerably higher, and the “real” success rate lower. For example, noting that “investment fraud schemes generate huge profits”, Europol (Citation2017, 42) reported an investigation revealing fraud profits for one organized crime group up to €3 billion. In another illicit market outside the study, the International Labor Office estimated annual returns from forced labor and sex exploitation at $150.2 billion globally (€114.2 billion), with $46.9 billion (€35.6 billion) from Europe and other developed countries (ILO Citation2014, 13; Savona and Riccardi Citation2015, 57).
These reports suggest that European criminal revenues may be substantially higher than €110 billion, and the 1.1 percent success rate correspondingly lower. Nonetheless, at some undetermined fraction of one percent (Pol Citation2018b, 296):
…the proportion of criminal earnings seized by authorities does not even remotely approach tax rates commonly applied to legitimate businesses. At less than one percent, the disruption of criminal funds hardly constitutes a rounding error in the accounts of profit-motivated criminal enterprises. In terms of the capacity materially and substantially to disrupt criminal finances and the manifold harms caused by serious profit-motivated crime, current money laundering controls appear almost completely ineffective.
The “success rate” of Europe’s anti-money laundering effort is puny. Likewise, globally.
6.2. Global efforts no better
Based on 2009 data, the UN, with US State Department assistance, calculated the global success rate of money laundering controls at just 0.2 percent (UNODC Citation2011, 14, 119, 131), but, as noted above, the confiscation rate might be 0.07 percent. In other words, despite ubiquitous money laundering controls, criminals retain up to 99.93 percent of criminal proceeds.
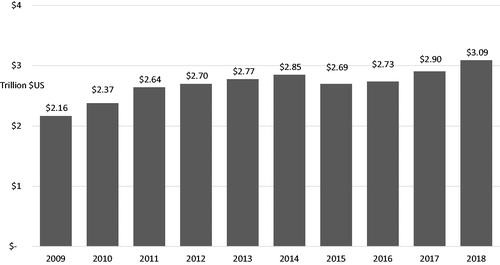
With “mythical” numbers (Reuter Citation1984; Singer Citation1971) unsupported by “any empirical…proof” (Savona and Riccardi Citation2015, 34) often used as institutional “problem amplifiers” by agencies seeking power and resources (Levi Citation2016, 392), “official” estimates of criminal revenues vary widely in scale and reliability. But, according to the UN, an estimated $2.1 trillion in criminal proceeds was generated in 2009 (3.6 percent of global GDP) (UNODC Citation2011, 5, 127). At the same rate, global GDP of US$85.8 trillion suggests US$3.09 trillion illicit funds in 2018, illustrated in .
Figure 2. UN-estimated global proceeds of crime, 3.6% GDP.
The UN estimated that authorities intercepted $3.1 billion of illicit funds in 2009, with more than 80 percent seized in North America (UNODC Citation2011, 119, 131). (The reference to North America seems to relate mostly to the United States. In 2009/2010, Canadian authorities successfully confiscated just C$59 million (FATF & APG Citation2016, 56), less than two percent of the total).
More recently, in 2017, total net deposits of $2.15 billion were paid into the US Treasury and Justice Department asset forfeiture funds (Department of Justice Citation2017; US Treasury Citation2017). If US asset forfeitures (sometimes called confiscations) represent 80 percent of the total, this suggests global forfeitures of $2.7 billion in 2017. At first glance, this appears lower than the UN’s $3.1 billion estimate for 2009. But the 2017 figure represents amounts confiscated, while the UN’s 2009 number represents sums seized, so a comparable 2009 estimation of global confiscations is $1.55 billion, using Europol’s empirical findings of a 50 percent difference between amounts initially seized and ultimately confiscated (Europol Citation2016, 4, 11). The $2.7 billion estimate therefore suggests a 74 percent increase in criminal asset confiscations between 2009 and 2017.
However, amounts seized and forfeited are highly variable, illustrated in (Department of Justice Citation2019b; US Treasury Citation2019). An alternative measure might use the average or median confiscated over an extended period, for example, $3.6 billion or $2.8 billion, respectively, over the period shown, but neither is necessarily more accurate than 2017 data alone, because earlier years include “unusually large” cases (Department of Justice Citation2019a, 2).
Figure 3. US asset forfeitures.
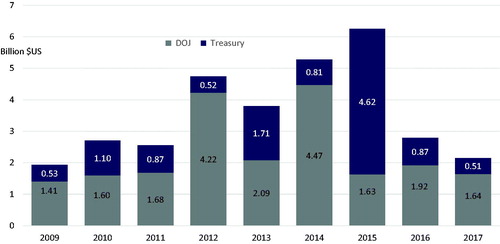
For some purposes, some cases, like settlements involving JP/Madoff ($3.9 billion), Poker Stars ($1.4 billion), Toyota ($1.2 billion), General Motors ($900 million) and Google ($500 million), might be excluded as dissimilar from “normal” crime. The impact of such spikes is significant, with “regular deposits” from criminal forfeitures “remarkably consistent”, at around $1 billion annually (Department of Justice Citation2019a, 2).
Nonetheless, if US forfeitures represent 80 percent of the total, average confiscations of $3.6 billion suggest global estimates around $4.5 billion. Or, using 2017 data for consistency (which, coincidentally, more closely accords with “regular” confiscations), suggests global forfeitures around $2.7 billion.
But whether global authorities successfully confiscated $4.5 billion or $2.7 billion of perhaps $2.9 trillion illicit funds generated in 2017, the success rate is trivial, at 0.16 or 0.09 percent, respectively.
6.3. Imperfect data, but stark clarity of policy effectiveness gap
These figures are far from definitive. Most estimates lack methodological clarity, few are validated, and there are obvious gaps. For example, simple extrapolation for global estimates ignores nuanced reality in more than 190 countries. Even in the few with available data, criminal asset forfeitures often use net amounts paid to the relevant government fund, excluding allocations to administrative costs. Confiscations from agencies not recorded in centralized databases may be missing. Authorities in many countries also frequently claim increasing forfeitures, but such claims are highly date-range specific. For example, Canadian forfeitures rose in each of the four years since 2009, then fell in two subsequent years. The total amount confiscated in 2014/2015 (C$77 million) was barely C$18 million more than 2009/2010 (FATF & APG Citation2016, 56). Much the same appears to have occurred in the United States between 2009 and 2017, illustrated in . It is also difficult to reconcile European and global data. “Eighty percent” of forfeitures originating from North America do not match €1.2 billion from Europe.
Nonetheless, although detailed research is needed to validate such claims, it seems a reasonable hypothesis that forfeitures increased since 2009, at least on a rolling average basis. This paper generally uses a broad estimate of $3 billion confiscated globally.
Overall, data are poorly substantiated, so the apparent precision of subtle distinctions is illusory. Likewise, the seemingly cavalier rounding from $2.7 billion to $3 billion in the preceding paragraph. The real issue, however, is not the apparent precision of inherently imprecise estimates, but the “huge gap between the profits criminals [generate] and the amounts eventually seized and confiscated” (Europol Citation2016, 11).
Moreover, that gap is so large that imperfect illicit funds estimates have little or no effect on the proportion of criminal funds confiscated. Whether the “real” success rate is 0.1 percent, or ten times as much, it would be challenging to claim success in the detection and prevention of serious crime if up to 99.9 percent or “only” 99 percent of illicit funds remain in criminal hands; enabling, facilitating and rewarding the continued expansion of serious crime.
Anti-money laundering’s policy impact may be inconsequential, but policies also impose costs.
6.4. Burgeoning compliance cost
In the same year as the latest available asset forfeiture data noted above, the estimated annual cost of anti-money laundering compliance in four EU countries1 was $81.4 billion, according to LexisNexis (Citation2017). Those countries represent 52.2 percent of European Union gross domestic product (GDP), according to the World Bank (Citation2017). Simple GDP-based extrapolation suggests EU compliance costs of $156 billion (€144 billion).2
LexisNexis (Citation2017, Citation2018a, Citation2018b) also examined compliance costs elsewhere. The estimated annual cost was $83.5 billion in five European countries,3 $25.3 billion in the United States, and $2.05 billion in South Africa, or $110.85 billion in the surveyed countries. According to World Bank data, those countries represent 36.5 percent of world GDP (2017). Again, simple extrapolation suggests global compliance costs in the order of $304 billion, or 0.38 percent GDP. [Some estimates are higher still. Thomson Reuters (Citation2018, 4, 26) says that companies on average spend 3.1 percent of turnover combating financial crime, or $1.28 trillion globally].
Necessarily applying a broad brush, the current anti-money laundering policy prescription helps authorities intercept about $3 billion of an estimated $3 trillion in criminal funds generated annually (0.1 percent success rate), and costs banks and other businesses more than $300 billion in compliance costs, more than a hundred times the amounts recovered from criminals.
In Europe, the anti-money laundering movement apparently makes private businesses spend as much as €144 billion in compliance costs to help authorities confiscate up to €1.2 billion of more than €110 billion generated by criminals each year. This suggests a higher recovery rate, at 1.1 percent, but for reasons outlined above may be overstated, and offset by compliance costs 120 times the amount successfully recovered from criminals. (Bizarrely, by these estimates, compliance costs exceed total criminal funds).
Overall, estimated compliance costs are poorly validated, but whether they are $304 billion (based on LexisNexis research), closer to $1.28 trillion (per Thomson Reuters), or some other amount, the cost of compliance is high, and seems markedly to exceed amounts recovered from criminals.
Nevertheless, compliance cost estimates may yet be understated if they only include private sector operational costs. Public sector costs for the many policy, regulatory and enforcement agencies involved in anti-money laundering activities, and penalties for breach of anti-money laundering laws, add to the regime’s total cost.
6.5. Hidden costs of supranational and government agencies
The costs of approximately 80 international bodies and thousands of government agencies in 205 countries and jurisdictions with a role in anti-money laundering efforts are unknown. More precisely, costs information is available to each agency, but few seem to collate such data, despite being a crucial component of any rigorous cost-benefit analysis of the anti-money laundering experiment. Moreover, the value of illicit assets successfully recovered from criminals is also known by authorities in each jurisdiction. In any event, such data, notable for its perennial absence, would improve the accuracy of the inadequately substantiated estimates outlined above. Likewise, the costs of noncompliance.
6.6. Businesses and citizens penalized more than criminals
The combined value of anti-money laundering penalties in 2018 and 2019, mostly levied on banks, was $4.3 billion and $8.1 billion, respectively, according to Balani (Citation2019; Burns Citation2019, Citation2020). Between 2002 and 2019, the combined value of 340 penalties was $34.7 billion, representing an average penalty of $102 million. Between 2002 and 2017, the average was $88 million.
By 2018 and 2019, average penalties rose considerably, to $147 million and $140 million, respectively. The researchers recorded more countries penalizing more businesses (“in 2019, penalties were handed out by 14 countries, compared to just three a decade ago in 2009”) and more penalties over a billion dollars, including two in 2019 alone. They attributed an “increased focus” on penalizing breaches of money laundering controls to “the severity with which it is viewed at a global level”, which they considered unsurprising “given [money laundering’s] negative economic and societal repercussions” (Burns Citation2020).
However, these findings appear consistent with other possibilities, for example, that “banks are a much easier target for regulators” (Pol Citation2019c) than criminals. If authorities recover around $3 billion per annum from criminals, whilst imposing compliance costs of $300 billion and penalizing businesses another $8 billion a year, it is reasonable to ask if the real target of anti-money laundering laws is legitimate enterprises rather than criminal enterprises.
It is reasonable also to ask whether ordinary citizens are harmed more than banks and criminals, at least financially, by laws ostensibly aimed at financial crime. After all, banks typically pass their costs on to shareholders and customers - in lower dividends, higher fees, lower interest rates for savers, and higher rates for borrowers. Moreover, taxpayers pay the costs of government, including scores of international agencies involved in the anti-money laundering agenda, and up to several dozen government agencies in each of 205 countries and jurisdictions. Individuals, communities, economies, and society also suffer the economic and social harms from serious crime.
These findings raise serious questions about the efficiency and effectiveness of the current policy model, but scholars rued that designers tasked with updating the anti-money laundering framework were told “not to pay attention to the costs of the system, direct or indirect.” Instead, it is simply “taken for granted that actions taken against money laundering and especially the financing of terrorism will have a positive welfare impact, both gross and net of costs” (Levi et al. Citation2018, 309). Likewise, the oft-proclaimed benefits of anti-money laundering efforts are seldom quantified or tested robustly, despite researchers “howl[ing] into the wind their warnings of unintended consequences, of law and regulations with costs far exceeding ephemeral benefits…only to be totally ignored” (Cochrane Citation2014, 2).
However, recognition that costs outweigh benefits, or that core objectives are not met, remains a pre-condition to start reshaping the policy paradigm for better outcomes. Change starts with acknowledging reality. In that regard, verifiable cost and recoveries information, readily available (albeit seldom produced), remains critically important if a rigorous “official” assessment of anti-money laundering effectiveness is ever undertaken. (Benefits attributable to anti-money laundering efforts, including social and economic benefits from less crime, should also be included).
In the meantime, irrespective of costs, the success rate of money laundering controls may be even less than noted above.
7. Whither policy effectiveness?
The trivial confiscation of 0.1 percent of criminal funds potentially overstates the policy impact of money laundering controls. That’s because criminal asset forfeitures often occur independently of anti-money laundering obligations. For example, confiscations frequently result from traditional policing methods such as drug trafficking investigations uncovering assets purchased with criminal funds. Empirical research in New Zealand found that conventional methods triggered 80 percent of confiscations involving lawyers, accountants and real estate agents facilitating illicit real estate transactions. Only 20 percent started with anti-money laundering’s key mechanism, legitimate businesses reporting suspicious transactions (Pol Citation2018b, 302).
Different percentages likely apply in different circumstances, but the success rate of money laundering controls is unrealistically high when it implicitly attributes all criminal asset confiscations to anti-money laundering efforts. For example, if 20 percent of forfeitures are attributable to money laundering controls, the global success rate may be one-fifth of 0.1 percent i.e. 0.02 percent, or one-fiftieth of one percent, illustrated in . Empirical research is necessary to identify appropriate proportions in relevant markets. In the meantime, suggests a mid-point for indicative purposes, indicating that the global success rate of money laundering controls may be in the order of 0.05 percent (one-twentieth of one percent).
Table 1 Anti-money laundering: effective policies?
Notwithstanding its dismal success rate, the modern anti-money laundering model also has many success stories. In policy terms, progress on both the process and political dimensions in supports reexamining policy design to help transform failure on the remaining program dimension toward comprehensive success. In practical terms, criminal enterprises no longer holding $3 billion of illicit assets confiscated each year, and leaders less readily able to recapitalize illegal endeavors, are profoundly affected. Likewise, criminal activities are frequently disrupted and thwarted. This can be difficult to measure but may help lift success rates noted above.
In the meantime, however, if the impact of three decades of money laundering controls barely registers as a rounding error in criminal accounts and “Criminals, Inc” keep up to 99.95 percent of the earnings from misery, and reasonable prospects for better outcomes remain persistently unexplored, the harsh reality is that the current policy prescription inadvertently protects, supports and enables much of the serious profit-motivated crime that it seeks to counter. In any event, the anti-money laundering experiment remains a viable candidate for the title of least effective policy initiative, ever, anywhere (Cassara Citation2017, 2).
Moreover, if the modern anti-money laundering paradigm is characterized by a self-reinforcing continuous loop of policy failure, with “solutions” repeatedly “doing more of the same” producing much the same results, and with powerful stakeholder incentives maintaining the status-quo, it will be difficult to recalibrate for better outcomes. But not impossible. Key issues enabling policy success are commonplace in policy science, and the questions simple. What’s the “right” policy objective? Is there a robust, validated evidence-base to measure success? If not, what data are needed? Are policy objectives being met? If not, what policy design changes would help recalibrate for better outcomes? This paper suggests that active engagement with critical, diverse perspectives, and deeper connections with the rigor of policy science, would help contribute to better results.
8. Conclusion: from anecdotal successes to policy success
Like climate change ostensibly known only by scientists four decades earlier, independent researchers nearly three decades ago began signaling structural design problems with anti-money laundering’s compliance operating model. Still marginalized by a dominant narrative, such evidence remains largely overlooked, misinterpreted or dismissed by many industry and media participants relentlessly demanding more, rather than more effective, regulations; and, thus, largely unknown by the public and many policymakers.
However, differences between climate change and the “war” on money laundering suggest optimism. First, the problems are merely difficult, not intractable. Second, the primary blockage is simple. Frankly acknowledging policy failure can start the process of overcoming it. Third, decades of universal uniformity created a global network and associated business and regulatory ecosystem which could be re-deployed toward better outcomes. Fourth, solutions don’t require the moral fortitude of altruistic “strong longtermism” (Greaves and MacAskill Citation2019). Substantially better results will benefit millions of people, every economy, and society, in the long-term future and immediately. These factors suggest that the temporary friction of moving beyond the comfort of status-quo to engage with diverse thinking toward common objectives may be a small price to pay for shared goals; to substantially and sustainably reduce the immense social and economic harms from serious profit-motivated crime and other financially-indicated crime, including terrorism.
Acknowledgements
The author is grateful for reviewers’ deeply insightful comments.
Disclosure statement
No potential conflict of interest was reported by the authors.
Notes
Notes
1 France ($18.6b), Germany ($46.4b), Italy ($14.4b), and Netherlands ($2b).
2 $US/Euro average exchange rate for 2017 (0.923) from US Internal Revenue Service (https://bit.ly/1YOJP5m). Last accessed 27 November 2018.
3 Ibid, footnote 1, plus Switzerland ($1.9b).
References
- Anand, A. 2011. “Combating Terrorist Financing: Is Canada’s Legal Regime Effective?” University of Toronto Law Journal 61 (1): 59–71. doi:10.3138/utlj.61.1.059.
- Balani, H. 2019. Over $352.5 Million of Fines Handed Out Globally in Last Four Months. https://bit.ly/2M32qwR.
- Bovens, M. A. P. 2010. “A Comment on Marsh and McConnell: Towards a Framework for Establishing Policy Success.” Public Administration 88 (2): 584–585. doi:10.1111/j.1467-9299.2009.01804.x.
- Bovens, M. A. P., and P. ‘T Hart. 1996. Understanding Policy Fiascoes. 1st ed. New Brunswick: Transaction Publishers.
- Bovens, M. A. P., P. ‘T Hart, and B. G. Peters. 2001. Success and Failure in Public Governance: A Comparative Analysis. Cheltenham: Edward Elgar.
- Brzoska, M. 2016. “Consequences of Assessments of Effectiveness for Counterterrorist Financing Policy.” Administration & Society 48 (8): 911–930. doi:10.1177/0095399714532272.
- Burns, C. 2019. Analysis from Encompass Shows 2019 Set to be Year of Record AML Fines. https://bit.ly/34uu5gv.
- Burns, C. 2020. $8.14 billion of AML Fines Handed Out in 2019, with USA and UK Leading The Charge. https://bit.ly/36QoRO1.
- Cassara, J. 2017. Modernizing AML laws to Combat Money Laundering and Terrorist Financing. US Senate Testimony. Washington DC, citing author. https://bit.ly/2SqYecC.
- Chaikin, D. 2009. “How Effective Are Suspicious Transaction Reporting Systems?” Journal of Money Laundering Control 12 (3): 238–253. doi:10.1108/13685200910973628.
- Cochrane, J. H. 2014. “Cost-Benefit Analysis as a Framework for Financial Regulation.” SSRN. http://dx.doi.org/10.2139/ssrn.2425885.
- de Koker, L. 2011. “Aligning Anti-Money Laundering, Combating of Financing of Terror and Financial Inclusion.” Journal of Financial Crime 18 (4): 361–386. doi:10.1108/13590791111173704.
- de Koker, L. 2014. “The FATF’s Customer Identification Framework: Fit for Purpose?” Journal of Money Laundering Control 17 (3): 281–295. doi:10.1108/JMLC-01-2014-0003.
- de Koker, L. 2018. “Editorial: ML/FT Risk and Financial Inclusion of the Poor.” Journal of Money Laundering Control 21 (3): 250–252. doi:10.1108/JMLC-05-2018-0038.
- de Koker, L. 2019. “Westpac’s Panicked Response To Its Money-Laundering Scandal Looks Ill-Considered.” The Conversation, 26 November. https://bit.ly/2XNcI8X.
- de Koker, L., and M. Turkington. 2015. “Anti-Money Laundering and the Effectiveness Question.” In Research Handbook on International Financial Crime, edited by B. A. K. Rider, 520–531. Cheltenham: Edward Elgar.
- de Oliveira, I. S. 2018. “The Governance of the Financial Action Task Force: An Analysis of Power and Influence throughout the Years.” Crime, Law and Social Change 69 (2): 153–172. doi:10.1007/s10611-017-9749-4.
- Den Boer, M., et al. 2017. European Union Serious and Organised Crime Threat Assessment 2017: Comment by Academic Advisors. The Hague: Europol. https://bit.ly/2n78auo.
- Department of Justice. 2017. FY2017 Asset Forfeiture Fund Reports to Congress. Washington DC: Department of Justice. https://bit.ly/2KukcXz.
- Department of Justice. 2019a. 10-yr Summary of Financial Report Data. Washington DC: Department of Justice. https://bit.ly/2KE96k5.
- Department of Justice. 2019b. Asset Forfeiture Program. Washington DC: Department of Justice. https://www.justice.gov/afp.
- Ebikake, E. 2016. “Money Laundering: An Assessment of Soft Law as a Technique for Repressive and Preventive AML Control.” Journal of Money Laundering Control 19 (4): 346–375. doi:10.1108/JMLC-07-2015-0029.
- European Commission. 2018. State of the Union 2018: Stronger Anti-Money Laundering Supervision for a Stable Banking and Financial Sector [press release]. https://bit.ly/2OgSLBV.
- European Commission. 2019a. Commission Assesses Risks and Implementation Shortcomings in Fight Against Money Laundering and Terrorist Financing: Questions and Answers. Brussels: European Commission. https://bit.ly/2S434xL.
- European Commission. 2019b. Fight Against Money Laundering and Terrorist Financing: Commission Assesses Risks and Calls for Better Implementation of the Rules [Press release]. Brussels: European Commission. https://bit.ly/2YYGXtW.
- European Commission. 2019c. Report Assessing the Framework For FIUs Cooperation With Third Countries and Obstacles and Opportunities to Enhance Cooperation Between FIUs Within the EU. Brussels: European Commission. https://bit.ly/35oV3Y2.
- Europol. 2016. Does Crime Still Pay? Criminal Asset Recovery in the EU. The Hague: Europol. https://bit.ly/2jMSuca.
- Europol. 2017. Serious and Organised Crime Threat Assessment 2017. The Hague: Europol. https://bit.ly/2n78auo.
- FATF. 2013a. Methodology for Assessing Compliance with the FATF Recommendations and the Effectiveness of AML/CFT Systems. December 2013. Paris: FATF.
- FATF 2013b. Methodology for Assessing Compliance with the FATF Recommendations and the Effectiveness of AML/CFT Systems. Updated October 2019. Paris: FATF. https://bit.ly/36Kitr8.
- FATF 2013c. Procedures for the FATF Fourth Round of AML/CFT Mutual Evaluations. Paris: FATF. https://bit.ly/2KM934u.
- FATF 2019a. An Effective System to Combat Money Laundering and Terrorist Financing. Paris: FATF. https://bit.ly/23u1ArQ.
- FATF 2019b. FATF 30 years (1989-2019). Paris: FATF. https://bit.ly/2kWampb.
- FATF. 2019c. Outcomes FATF Plenary, 16–18 October 2019 [Press release]. Paris: FATF. https://bit.ly/2J5fr7k.
- FATF and APG. 2016. Mutual evaluation report: Canada. Paris: FATF. https://bit.ly/2d0pJo1.
- Ferwerda, J. 2009. “The Economics of Crime and Money Laundering: Does anti-Money Laundering Policy Reduce Crime?” Review of Law & Economics 5 (2): 903–929. doi:10.2202/1555-5879.1421.
- Findley, M. G., D. L. Nielson, and J. C. Sharman. 2014. Global Shell Games: Experiments in Transnational Relations, Crime, and Terrorism. Cambridge: Cambridge University Press.
- G7. 1989. Communiqué: Economic Declaration. Paris. https://bit.ly/2QaHrJN.
- Greaves, H., and W. MacAskill. 2019. The Case for Strong Longtermism. Oxford. https://bit.ly/2rLgiox.
- Halliday, T. C., M. Levi, and P. Reuter. 2014. Global Surveillance of Dirty Money: Assessing Assessments of Regimes to Control Money-Laundering and Combat the Financing of Terrorism. Champaign. https://bit.ly/2ROrfwE.
- Harvey, J. 2008. “Just How Effective Is Money Laundering Legislation?” Security Journal 21 (3): 189–211. doi:10.1057/palgrave.sj.8350054.
- Howlett, M. 2011. Designing Public Policies: Principles and Instruments. Oxford: Routledge.
- Howlett, M. 2012. “The Lessons of Failure: Learning and Blame Avoidance in Public Policy-Making.” International Political Science Review 33 (5): 539–555. doi:10.1177/0192512112453603.
- Howlett, M. 2019. “Moving Policy Implementation Theory Forward: A Multiple Streams/Critical Juncture Approach.” Public Policy and Administration 34 (4): 405–430. doi:10.1177/0952076718775791.
- Howlett, M., M. Ramesh, and X. Wu. 2015. “Understanding the Persistence of Policy Failures: The Role of Politics, Governance and Uncertainty.” Public Policy and Administration 30 (3–4): 209–220. doi:10.1177/0952076715593139.
- ILO. 2014. Profits and Poverty: The Economics of Forced Labour. Geneva. https://bit.ly/R32CfM.
- Jones, T., J. Blaustein, and T. Newburn. 2020. “Researching Cross-National Policy Mobilities in Crime Control.” Criminology & Criminal Justice. doi:10.1177/1748895819864627.
- King, A., and I. Crewe. 2013. The Blunders of Our Governments London: Oneworld.
- Levi, M. 2002. “Money Laundering and Its Regulation.” The Annals of the American Academy of Political and Social Science 582 (1): 181–194. doi:10.1177/000271620258200113.
- Levi, M. 2012. “How Well Do Anti-Money Laundering Controls Work in Developing Countries?” In Draining Development? Controlling Flows of Illicit Funds from Developing Countries, edited by P. Reuter, 373–413. Washington, DC: World Bank.
- Levi, M. 2016. “The Impacts of Organised Crime in the EU: Some Preliminary Thoughts on Measurement Difficulties.” Contemporary Social Science 11 (4): 392–402. doi:10.1080/21582041.2015.1090802.
- Levi, M., and M. Maguire. 2004. “Reducing and Preventing Organised Crime: An Evidence-Based Critique.” Crime, Law and Social Change 41 (5): 397–469. doi:10.1023/B:CRIS.0000039600.88691.af.
- Levi, M., and P. Reuter. 2006. “Money Laundering.” Crime and Justice 34 (1): 289–375. doi:10.1086/501508.
- Levi, M., and P. Reuter. 2009. “Money Laundering.” In The Oxford Handbook of Crime and Public Policy, edited by M. Tonry. Oxford: Oxford University Press.
- Levi, M., P. Reuter, and T. Halliday. 2018. “Can the AML System Be Evaluated Without Better Data?” Crime, Law and Social Change 69 (2): 307–328. doi:10.1007/s10611-017-9757-4.
- Lewis, D. 2019. “Remarks by FATF Executive Secretary.” Paper presented at the RUSI meeting on the Financial Action Task Force Strategic Review, Whitehall. https://bit.ly/2OyWifU.
- LexisNexis. 2017. The True Cost of Anti-Money Laundering Compliance. European edition. https://bit.ly/38fGkQQ
- LexisNexis. 2018a. Anti-Money Laundering Compliance Costs South African Financial Services Companies $2.05 billion a year [Press release]. https://bit.ly/2zbg2zn.
- LexisNexis. 2018b. True Cost of AML Compliance Study: US Edition. https://bit.ly/2tqGght.
- Marsh, D., and A. McConnell. 2010a. “Towards a Framework for Establishing Policy Success.” Public Administration 88 (2): 564–583. doi:10.1111/j.1467-9299.2009.01803.x.
- Marsh, D., and A. McConnell. 2010b. “Towards a Framework for Establishing Policy Success: A Reply to Bovens.” Public Administration 88 (2): 586–587. doi:10.1111/j.1467-9299.2009.01805.x.
- McConnell, A. 2010a. “Policy Success, Policy Failure and Grey Areas in-between.” Journal of Public Policy 30 (3): 345–362. doi:10.1017/S0143814X10000152.
- McConnell, A. 2010b. Understanding Policy Success: Rethinking Public Policy. Basingstoke: Palgrave Macmillan.
- McConnell, A. 2011. “Success? Failure? Something In-Between? A Framework for Evaluating Crisis Management.” Policy and Society 30 (2): 63–76. doi:10.1016/j.polsoc.2011.03.002.
- McConnell, A. 2015. “What is Policy Failure? A Primer to Help Navigate the Maze.” Public Policy and Administration 30 (3-4): 221–242. doi:10.1177/0952076714565416.
- McConnell, A. 2018. “Hidden Agendas: Shining a Light on the Dark Side of Public Policy.” Journal of European Public Policy 25 (12): 1739–1758. doi:10.1080/13501763.2017.1382555.
- Naylor, R. T. 2005. Wages of Crime: Black Markets, Illegal Finance and the Underworld Economy. Ithaca, NY: Cornell University Press.
- Newman, J., and B. W. Head. 2015. “Categories of Failure in Climate Change Mitigation Policy in Australia.” Public Policy and Administration 30 (3-4): 342–358. doi:10.1177/0952076714565832.
- Peters, B. G. 2015. “State Failure, Governance Failure and Policy Failure: Exploring the Linkages.” Public Policy and Administration 30 (3–4): 261–276. doi:10.1177/0952076715581540.
- Pol, R. F. 2018a. “Anti-Money Laundering Effectiveness: Assessing Outcomes or Ticking Boxes?” Journal of Money Laundering Control 21 (2): 215–230. doi:10.1108/JMLC-07-2017-0029.
- Pol, R. F. 2018b. “Uncomfortable Truths? ML = BS and AML = BS2.” Journal of Financial Crime 25 (2): 294–308. doi:10.1108/JFC-08-2017-0071.
- Pol, R. F. 2019a. “Anti-Money Laundering Ratings: Uncovering Evidence Hidden in Plain Sight.” Journal of Money Laundering Control 22 (4): 836–857. doi:10.1108/JMLC-01-2019-0006.
- Pol, R. F. 2019b. “The Global War on Money Laundering Is a Failed Experiment.” The Conversation, 21 October. https://bit.ly/34oiJLI.
- Pol, R. F. 2019c. “Westpac Ticking Every Anti-Money Laundering Box Wouldn’t Make Much Difference to Criminals.” The Conversation, 3 December. https://bit.ly/33Jc0L0.
- Pol, R. F. 2020. “Response to Money Laundering Scandal: Evidence-Informed or Perception-Driven?” Journal of Money Laundering Control (1): 23. doi:10.1108/JMLC-01-2019-0007.
- Reuter, P. 1984. “The (Continued) Vitality of Mythical Numbers.” The Public Interest 75: 135–147.
- Reuter, P., and E. M. Truman. 2004. Chasing Dirty Money: The Fight against Money Laundering. Washington, DC: Peterson Institute.
- Rider, B. A. K. 2002a. “The Weapons of War: The Use of Anti-Money Laundering Laws Against Terrorist and Criminal Enterprises(1).” Journal of Banking Regulation 4 (1): 13–31. doi:10.1057/palgrave.jbr.2340128.
- Rider, B. A. K. 2002b. “The Weapons of War: The Use of Anti-Money Laundering Laws Against Terrorist and Criminal Enterprises(2).” Journal of Banking Regulation 4 (2): 145–161. doi:10.1057/palgrave.jbr.2340136.
- Rider, B. A. K. 2004. “The War on Terror and Crime and the Offshore Centres: The ‘New’ Perspective?” In Global Financial Crime: Terrorism, Money Laundering and Offshore Centres, edited by D. Masciandaro. Aldershot: Ashgate.
- Savona, E. U., and M. Riccardi. 2015. From Illegal Markets to Legitimate Businesses: The Portfolio of Organised Crime in Europe. Trento. https://bit.ly/1Dli7W1.
- Sharman, J. C. 2008. “Power and Discourse in Policy Diffusion: Anti-Money Laundering in Developing States.” International Studies Quarterly 52 (3): 635–656. doi:10.1111/j.1468-2478.2008.00518.x.
- Sharman, J. C. 2011. The Money Laundry: Regulating Criminal Finance in the Global Economy. Ithaca, NY: Cornell University Press.
- Singer, M. 1971. “The Vitality of Mythical Numbers.” The Public Interest 23: 3–9.
- Thomson Reuters. 2018. Revealing the True Cost of Financial Crime. https://tmsnrt.rs/2DE3Ef9.
- UN. 1985. Seventh United Nations Congress on the Prevention of Crime and the Treatment of Offenders: Resolution. New York. http://www.un.org/documents/ga/res/40/a40r032.htm.
- UN. 1988. United Nations Convention Against Illicit Traffic in Narcotic Drugs and Psychotropic Substances (Vienna Convention).
- UNODC. 2011. Estimating Illicit Financial Flows Resulting from Drug Trafficking and Other Transnational Organized Crimes. Vienna. https://bit.ly/1vb26h8.
- US Treasury. 2017. Treasury Forfeiture Fund Accountability Report. Washington DC. https://bit.ly/2K6ocgT.
- US Treasury. 2019. Treasury Executive Office for Asset Forfeiture. https://bit.ly/2KEG6sx.
- van Duyne, P. C. 2003. “Money Laundering Policy: Fears and Facts.” In Criminal Finances and Organising Crime in Europe, edited by P. van Duyne, K. von Lampe, and J. L. Newell. Nijmegen: Wolf Legal.
- van Duyne, P. C. 2011. “Transnational Organised Crime, Laundering and the Congregation of the Gullible.” Paper presented at the Professor van Duyne valedictory, Tilburg.
- Verhage, A. 2017. “Great Expectations but Little Evidence: Policing Money Laundering.” International Journal of Sociology and Social Policy 37 (7/8): 477–490. doi:10.1108/IJSSP-06-2016-0076.
- Wolfsberg Group. 2019. Statement on Effectiveness. Geneva. https://bit.ly/2Uvr6mF
- World Bank 2017. GDP (Current $US), 2017. https://bit.ly/1Cd8EkQ.
- Zoppei, V. 2017. Anti-Money Laundering Law: Socio-Legal Perspectives on the Effectiveness of German Practices. The Hague: Springer.