
 ?Mathematical formulae have been encoded as MathML and are displayed in this HTML version using MathJax in order to improve their display. Uncheck the box to turn MathJax off. This feature requires Javascript. Click on a formula to zoom.
Abstract
The control of spread of HIV to reduce its effects on a population is an important role of public health. HIV testing and counselling (HTC) and eventual enrolment of infected individuals on anti retro-viral treatment (ART) as soon as possible to reduce the risk of dying is currently the main intervention against HIV. Mathematical models can be used to study the effects of HIV prevention, testing and treatment with ART on HIV patients. In this study, we employ a deterministic model to provide a quantification of HIV prevention, testing and treatment with ART as public health measurements in the fight against HIV infection. Lyapunov function has been used to derive a condition that ensures that the model system is globally asymptotically stable when R0 is less than unity. Through sensitivity analysis, we determine the relative importance of model parameters for disease transmission. The sensitivity analysis results suggest that the effective contact rates are mechanisms fuelling HIV epidemic proliferation while ART efficacy reduces the incidence. The model is fitted to HIV surveillance data obtained from world in data website. Although the results show a high proportion of individuals with HIV in Kenya, the incidence curve is indicative of a declining HIV infection and settling at an endemic steady state. The results are suggestive of the need to promote preventive mechanism against the occurrence of new infections. Moreover, the results show that the combination of several control mechanisms would significantly reduce the spread of the disease, if we maintain the level of each control high.
PUBLIC INTEREST STATEMENT
This paper provides a deterministic model usable to study the dynamics of HIV and its treatment geared towards attaining a HIV free world by year 2030. The dynamics are clearly unique and novel. It provides knowledge on how effective a combination of control strategies is in limiting cases of HIV infections. Furthermore, sensitivity analysis shows that the epidemic is driven by one on one contact between the infected population and the population at high risk of infection. It can be argued that effective PrEP up-take and high ART efficacy has the potential of reducing the HIV infection in the population.
1. Introduction
Diagnosis of HIV infection is a prerequisite for its treatment. This begins from voluntary counselling and testing which refers to the process initiated by an individual who wishes to know his/her HIV status. According to the WHO regulations, all forms of HIV testing and counselling should be voluntary and adhere to the five Cs, namely consent, confidentiality, counselling, correct test results and connection to care, treatment and prevention services (WHO, Citation2014). Identification of recent HIV infections and their role in driving the HIV epidemics is critical in understanding the spread of HIV and the deployment of relevant control measures (Quinn et al., Citation2000; Yerly et al., Citation2001). According to NACC (Citation2014a), an estimated 53% of the 1.6 million people living with HIV in Kenya are not aware of their HIV status. In addition, approximately 260,000 couples in HIV sero-discordant couples significantly contribute to new infections.
HTC has been adopted through targeted community-based testing and door-to-door testing initiatives by the Kenya government in order to reduce the spread of HIV. In order to boost these efforts, the government of Kenya announced plans to introduce self-test kits in 2015 (UNAIDS, Citation2016). In 2008, approximately 860,000 people were being tested annually for HIV totalling to about 6.4 million people by the end of 2013 (NACC, Citation2014b). Furthermore, the report from NACC (Citation2014b) indicates that HTC coverage among the pregnant women has risen substantially. Between 2009 and 2013, the number of pregnant women tested for HIV increased from 68% to 92%. Similarly, there has been a concerted effort to increase testing rates among Kenyan men, with community-based testing programmes proving particularly successful.
In order to aid the reduction of new HIV infections in Kenya, in 2016, the government issued full regulatory approval of pre-exposure prophylaxis (PrEP) thus becoming the second country in Sub-Saharan Africa to make such an approval after South Africa (UNAIDS, Citation2016). Pre-Exposure Prophylaxis (PrEP) is the prophylactic use of anti retro-viral drugs (ARVS) by people who do not have HIV but are at high risk of acquiring it to prevent HIV infection (AIDS, Citation2016; HIV/AIDS, Citation2016). However, successes are yet to be reported since research into the uptake and impact of PrEP, specifically with young women and girls in high-incidence areas, is still on-going (UNAIDS, Citation2016).
The major intervention for the HIV infection is that when people are infected with HIV they should start anti retro-viral treatment (ART) as soon as possible to reduce the risk of dying (Williams, Citation2014; Williams, Hargrove, & Humphrey, Citation2010). The fact that ART has the potential to stop transmission of HIV, United Nations Programme on HIV and AIDS (UNAIDS) called for an end to HIV/AIDS centred on 90–90–90 target by 2020 (United Nations Programme on HIV/AIDS, Citation2014). The strategy implies that 90% of all those living with HIV should have been tested within the last one year, unless they already know that they are infected with HIV, 90% of these should be on treatment and 90% of these should have plasma viral loads below 1,000 copies/mL. In line with this strategy, Kenya began to adopt 2015 World Health Organization (WHO) recommendations to immediately offer treatment to people diagnosed with HIV in order to increase the ART access. It is estimated that about 826,000 adults and 71,500 children were receiving ART treatment in 2015 (UNAIDS, Citation2016). This paper presents a deterministic model for predicting the epidemiological trends of HIV that exploits HIV surveillance data to model the disease evolution in Kenya. Furthermore, we present results showing the impact of combination of HTC, PrEP and ART treatment as HIV intervention measures.
The rest of the paper is organised as follows. In Section 2 a brief literature related to this work is reviewed. In Section 3 a deterministic model is presented while in Section 4 detailed mathematical analysis is provided. Numerical simulations are carried out in Section 5. Finally, Section 6 gives the conclusion and suggestions for future work.
2. Related literature
Mathematical modelling is an important tool in understanding the spread and control of HIV. Early diagnosis and immediate treatment of HIV infection as well as suppression of the viral load remain the key interventions in reducing the HIV incidence. To understand the severity of the HIV epidemics as well as establishing a baseline, Su et al. (Citation2016) constructed a deterministic transmission model of HIV. The model was calibrated using surveillance and treatment data for the period 2005–2008. The authors then validated the model by comparing its predicted value of HIV prevalence in 2010 to the prevalence data of 2010. The validated model produced estimations on the new infections, people living with HIV (PLWHIV) and HIV-AIDS related deaths. They established that HIV control programs have drastically scaled up the HIV testing and treatment.
Kok et al. (Citation2015) constructed a dynamic model of the continuum of HIV care in Vancouver, Canada. This model incorporated the main activities and decisions in the delivery of anti retro-viral therapy that included HIV testing, linkage to care and long-term retention in care and treatment. In the development of the model, the authors considered four sub-populations namely men who have sex with men (MSM), injection drug users, female sex workers and the general population. The model was fitted to data obtained from public health sources that included British Columbia Centre for Excellence in HIV/AIDS. The findings predicted a lower than expected number of new diagnoses among MSM. Furthermore, their findings suggested that optimal resource allocation favours routine testing in high prevalence settings over targeted testing and that a greater impact would be achieved by allocating more resources to routine testing in high prevalence settings for MSM. Okosun, Makinde, and Takaidza (Citation2013) used a deterministic model based on ordinary differential equations to investigate the impact of combining prevention intervention strategies on the spread of HIV in the presence of unaware infectives. Thiébaut and May (Citation2013) highlight the use of mathematical models to predict the impact of early antiretroviral treatment (ART) of HIV-infected individuals and pre-exposure prophylaxis (PrEP) of uninfected individuals.
Pedro and Tchuenche (Citation2010) developed a mathematical model to study the effect of socio-economic classes in the transmission and spread of HIV. The results from this model established that men with better livelihood tend to have higher female sexual partners from the poor settings leading to high HIV incidence as opposed to the low income earners. He further argued that targeted HIV information campaign was needed to encourage multiple partners from the well-off settings to regularly or occasionally observe sexual hygiene. However, this study did not include nor investigate the potential impact of control strategies that are targeting the reduction of HIV incidence. On the other hand, Yang, Shu, Lam, and Sun (Citation2017) performed global analysis on the dynamics of HIV in female sex workers by factoring the effect of senior male clients. Graphical representation of their results showed that an increase in the number of male clients to the female sex workers results in an increase in the generation of new cases of infections. The major weakness of this model was failure to incorporate health education campaign and other treatment control strategies. The assessment of these strategies is essential in understanding the HIV dynamics and establishing how effective they can limit its spread to realise a HIV free population. Other modelling work that are pertinent to this study include Birger, Hallett, Sinha, Grenfell, and Hodder (Citation2013); Lou et al. (Citation2014); Luo et al. (Citation2015); Sun, Xiao, Peng, and Wang (Citation2013); Zhang, Gray, and Wilson (Citation2012).
None of the above mentioned models in the literature take into account the combination of HIV intervention strategies such as HTC, PrEP and ART treatment as HIV. Stopping the transmission chain of HIV remains the only viable form of control against the spread of infection. The potential effect of testing and immediate treatment with ART is thus of great interest. In the current paper, we use a mathematical model to describe the transmission dynamics of HIV, the impact of testing and treatment on the disease transmission. As mentioned previously, in our model we consider surveillance data to describe the spread of HIV. We assume a scenario in which the anti retro-viral therapy (ART) is initiated using the World Health Organization (WHO) viral load suppression strategy centred on 90-90-90 target by 2020. This is to imply that all new HIV infected individuals are immediately linked to treatment and retained in the system through regular testing.
3. Mathematical model
3.1. Model formulation
According to WHO (Citation2015) ART guidelines, the strategy of HIV treatment changed from the CD4 cell count 350 cells/μL for eligibility to enrol for ART treatment to achieve viral load suppression through targeted testing and immediate enrolment into ART treatment to achieve the 90-90-90 plan. A deterministic model is proposed to represent the effect of HIV testing, uptake of PrEP and ART as HIV intervention method. The model comprises susceptible class (S) and infection class. The infection class is further divided into four compartments. The undiagnosed class (I) comprising individuals who are unaware of their HIV status. These individuals are tested and then grouped into two classes based on the CD4 cell counts. These include individuals with CD4 cell count
cells/μL considered as HIV infected individuals with lower plasma viral load
and individuals with CD4 cell count
cells/μL considered as HIV infected patients with high plasma viral load
. These diagnosed patients move into treatment classes
and
, respectively. We consider a population of size
at time
given in (1)
The recruitment of susceptible is assumed to occur at a constant rate . During this modelling time, we only consider individuals aged 15 years and above. This group is assumed to be adult population and hence the recruitment rate defines the demographic process of individuals attaining the age 15. The rate at which susceptible individuals acquire infection is given by
Here are the transmission contact rates for susceptible individuals with
,
respectively. The natural removal rate
represent the death-rate while
represent AIDS induced death-rate in the classes
and
respectively. The progression rates from
to
and from
to
are respectively given by
and
upon diagnosis. The progression rate from
to
is given by
. The treatment rates from
to
and from
to
are given by
and
respectively. These rates can be viewed as the up-take of ART. The proportion of the infected individuals on treatment is bi-directional due to attrition or adherence to ART and decline or improvement of immunological status. The progression between these classes representing improvement or decline in immunological status is given by
respectively. Furthermore, it is assumed that the transmission of HIV is assumed to be mainly through heterosexual means. In addition, an exit due to death as a consequence of development of AIDS has been included, hence AIDS class is considered redundant and thus left out. The following interventions have been added to the model:
The first intervention
measures the effectiveness of the efforts made to protect susceptible individuals from infections. It mainly consists of the use of PrEP and or educational campaigns. Thus the infection term given in (2) is modified as follows
The second intervention
The third intervention
Figure describes the five compartments and model variables.
Figure 1. Graphical representation of HIV transmission. Susceptible individuals flow into the undiagnosed (I) via infection rate. Unaware individuals recieve diagnosis and flow into and
based on the CD4 cell counts. The tested individuals are then linked to ART treatment in classes
and
.
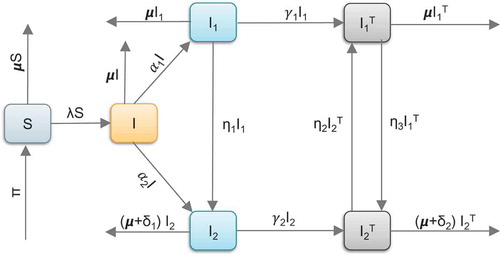
3.1.1. Model equations
Given the dynamics described in Figure , the following system of non-linear ordinary differential equations, with non-negative initial conditions, are derived.
subject to the following initial conditions
4. Mathematical analysis
4.1. Well–posedness of the model
In this sub-section, we prove that the system (4) is mathematically well defined and biologically feasible.
Lemma 4.1. Given that the initial conditions of the system (4) are as given in (5), the solutions are non-negative for all
.
Proof. Assume that
Thus , and it follows directly from the first equation of the system (4) that
Therefore we have
Thus
so that
Similarly, it can be shown that for
.
Lemma 4.2. Let the feasible region be defined by
with the initial conditions as given in (5). The region is positively invariant and attracting with respect to the system (4) for all
.
Proof. The evolution equation change in the total population is given by
So that
From (6) we can deduce that . Thus,
is positively invariant under the flow induced by the system (4). Therefore in
, the system (4) is well-posed epidemiologically and hence sufficient to study the system (4) in
.
4.2. The reproduction number
Supposing that the community has not experienced HIV infection, then it is expected to remain free of the disease. This implies that the entire community is rendered susceptible to the infection. In this respect, there are no infectious individuals. Therefore the system (4) has a disease-free equilibrium given by
The basic reproduction number, , is defined as the average number of new infections generated by a single infected individual in a completely susceptible population (Van Den Driessche & Watmough, Citation2002). We also emphasize that the reproduction number computed should reflect all the routes contributing to new infections. We use the next-generation matrix method as defined in Van Den Driessche and Watmough (Citation2002), such that the matrices of new infections evaluated at the disease-free equilibrium are given by
Here,
Thus, the basic reproduction number denoted by , is given by the spectral radius of
so that we have
where
with . It is important to note that the reproduction number computed is the sum of sub-population reproduction numbers representing the contributions of individuals in compartments
and
. From Theorem 2 in Van Den Driessche and Watmough (Citation2002), the following result is established.
Theorem 4.3. The disease-free equilibrium of the system (4) is locally asymptotically stable whenever
and unstable when
.
Remark 1. The results in Theorem 4.3 implies that HIV can be eliminated from the community when if the initial sizes of the sub-populations of the model are in the basin of attraction of the disease-free equilibrium
. To ensure that elimination of HIV is independent of the initial sizes of the sub-populations, it is necessary to show that the disease-free equilibrium,
, is globally asymptotically stable. Thus, we have the following Theorem.
Theorem 4.4. The disease-free equilibrium of the system (4) is globally asymptotically stable if
and unstable otherwise. The disease-free equilibrium
is the only equilibrium when
.
Proof. Let
be the Lyapunov function which involves individuals who contribute to infection in the population. The constants are all non negative and we ought to find them. The time derivative of the Lyapunov function (7) is given by
We equate the coefficients of the components to zero and solve for the coefficients of the Lyapunov function obtaining
Substituting the constants into (8), we obtain
Thus, when
. Furthermore,
if and only if either
or
are satisfied. In either case, the largest compact invariant subset of the set
is the singleton . By LaSalle’s Invariance Principle given in La Salle (Citation1976), this implies that
is globally stable in
provided
.
4.3. Existence of the disease-persistent equilibrium
Theorem 4.5. If , the system (4) has a unique disease-persistent equilibrium given
Proof. To compute the endemic equilibrium points of the system (4), we equate the right-hand side of the system to zero and solve in terms of force of infection described in (3). Thus, we have
Substituting the expressions for the state variables into (3) and simplifying, we obtain the following polynomial
where
We note that if
and expression (9) does not have a positive solution. However,
if
and expression (9) does have a positive solution implying that there exists a unique disease-persistent equilibrium if and only if
.
4.4. Global stability of the disease-persistent equilibrium
Theorem 4.6. The disease-persistent equilibrium is globally asymptotically stable whenever
is greater than unity
Proof. We know that . Therefore, using the relation
and substituting in (4) gives the following limiting system
Using the Dulacs multiplier , (see Mukandavire, Gumel, Garira, and Tchuenche (Citation2009)), it follows that
where
Thus, by Dulacs criterion, there are no periodic orbits in . Since
is positively invariant, and the disease-persistent equilibrium exists whenever
, then it follows from the Poincare-Bendixson Theorem (Perko, Citation2013) that all solutions of the limiting system originating in
remain in
for all
. Furthermore, the absence of periodic orbits in
implies that the unique disease-persistent equilibrium of the system (4) is globally asymptotically stable whenever
.
5. Numerical simulations
5.1. Model validation
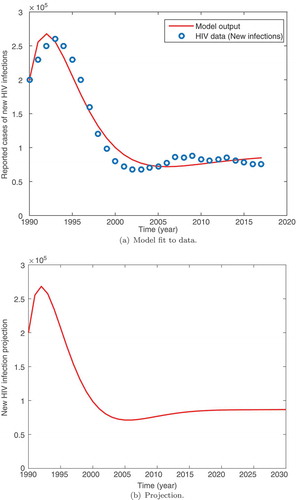
To estimate the parameter values and validate the model, we fit the system (4) to the data for the estimated new HIV infection in Kenya. The data were obtained from our world in data website (Roser & Ortiz-Ospina, Citation2017). These data were reported on an yearly estimate from 1990 to 2017. The least-squares curve fit is used to fit the model to data. Many parameters are known to lie within limits. Only a few parameters are known exactly and it is thus important to estimate the others. The estimation process attempts to find the best concordance between computed and observed data. It can be carried out by trial and error or by the use of software programs designed to find parameters that give the best fit. Here, the fitting process involves the use of the least squares-curve fitting method. A Matlab code is used where unknown parameter values are given a lower and upper bound from which the set of parameter values that produce the best fit are obtained. The intervals used and a few parameters obtained from literature are given in Table . The following initial values were used.
Table 1. Parameter values and ranges per year obtained from data fitting
(i) , population that were found in 1990 (KNBS, Citation2017; KNBS2, Citation2017).
(ii) .
(iii) is assumed number of asymptomatic HIV individuals (undiagnosed).
(iv) , reported number of new HIV infections at the end of 1990.
(v) (assumed),
(all assumed).
We observe in Figure that the model fits well with the data. It is important to observe that the cases of new HIV infection peaked in the year 1994. The results show that there was a rise in HIV infection between 1990 and 1995, followed by a significant slow down in the occurrences ofnew cases of infection. The data show an epidemic stabilizing at about 80,000 cases of HIV infection. The model also shows a steady state solution close to this value. The projected cases of new infection in Kenya till 2030 are given in Figure . We observe that the cases of new infection remain around the steady state registering about 80,000 cases of infection per year towards 2030. This is supported by the data that seem to fluctuate around the steady state. Our results are suggestive of the fact that interventions aimed at averting new infections will be most appropriate in achieving Kenya’s vision 2030 of HIV eradication.
Figure 2. (a) shows the trend of new HIV infections while (b) shows the projected new HIV infections in Kenya by 2030.
5.2. Sensitivity analysis
In this sub-section, we investigate the effect of parameter values on the basic reproduction number, . The uncertainties involved in data collection and the estimation parameter values lead us to evaluating the robustness of the model predictions with the parameter values as well as the effect of varying a parameter value on
. To examine the sensitivity of
to variation in parameters, we used the normalised forward sensitivity index also known as elasticity (Helton, Iman, & Brown, Citation1985). If we let
to be a differentiable function with respect to each of the parameters, then the normalised forward sensitivity index of
with respect to the parameter
is given by
It is important to note that the quotient is introduced to normalise the coefficient by removing the effect of units. Furthermore, this computation is based on the assumption that higher order partial derivatives are negligible and that there is no existence of correlation between input parameters (Hamby, Citation1994; Omondi, Orwa, & Nyabadza, Citation2017). Using the elasticity formula given in (11) with the parameter values in Table , we now obtain the numerical values for the elasticities and display the results in Table .
Table 2. Parameter values and ranges used in numerical simulations as well as determination of sensitivity indices of . The parameter rates are given per annum
The sensitivity index values of in Table show that an increase/decrease of 1% in any of the parameter values results in a percentage increase/decrease in
. Model system (4) is most sensitive to
and
. These are the parameters with the greatest potential to increase the HIV infection. Of the three controls added,
has the greatest effect on the basic reproduction number. This implies that ART efficacy is essential in reducing the HIV infection in the population.
5.3. Numerical results
In this section, we carry out numerical simulation by fourth order Runge-Kutta method in Matlab 2017a to see the dynamical behaviour of the system (4) in the presence of controls using parameters: , where
is the sum of the initial conditions of the state variables presented in (12),
The computer simulations are performed using the following initial conditions.
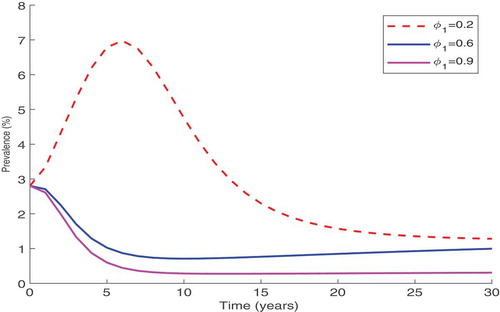
5.3.1. Control of new infection combined with ART treatment
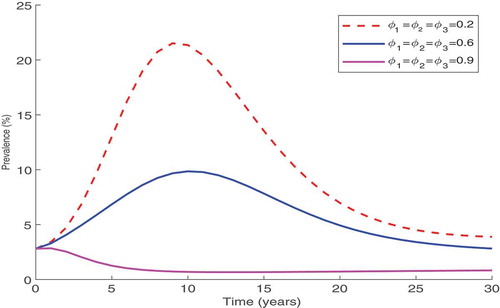
In this strategy, we set and vary the parameter related to protection of susceptible from infection, namely
, between 0.2 and 0.9. Figure shows that the increase of the individual protection level, reduces the disease prevalence. From this result, it is clear that this reduction is significant if the level of protection is kept high over a long period. Thus, continuous education campaigns of local populations, on how to protect themselves individually using the available protection measures such as PrEP, are important in the fight against the spread of HIV.
Figure 3. Simulation result showing the effect of efforts made to protect susceptible individuals from infections on the disease prevalence.
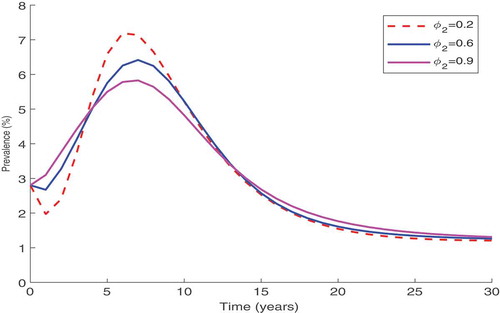
5.3.2. Counselling and testing combined with ART treatment
Since the enrolment of an individual into ART treatment programme depends on the diagnosis of HIV, we explore the benefits of enhancing the counselling and testing of individuals in the presence of ART treatment. We fix the efficacy of ART treatment ( to 1 and the control of new infections (
to zero. Simulation results in Figure show that an increase in counselling and testing of individuals,
, has a significant impact on the decrease of the disease prevalence. However, this decrease settles asymptotically at prevalence slightly above 1% implying that further increase of HIV counselling and testing without controlling new infections may not halt the disease spread.
Figure 4. Simulation result showing the testing and counselling on the disease prevalence.
5.3.3. Control of new infections, counselling and testing combined with ART treatment
The results in Figure show that combining all three control strategies yield a positive impact in the control of HIV. The results indicate that if the controls are maintained at over 90%, then it will be very easy to halt the further spread of HIV.
Figure 5. Simulation results showing the advantage of combining personal protection, testing and counselling and ART treatment on the disease prevalence.
6. Conclusion
In this paper, an HIV transmission model is derived and analyzed. The basic reproduction number is computed and stability analysis of the model equilibria carried out. By constructing a suitable Lyapunov function, the analysis shows that the disease-free equilibrium of the model is globally asymptotically stable whenever
is less than unity. The health implications of this observation are that keeping the reproduction number below unity may be necessary in the control of the spread of HIV epidemic. However, when
, the disease-free equilibrium loses its stability and there exists endemic equilibrium which is globally asymptotically stable.
The least squares curve fit routine in Matlab with optimisation has been used to fit the model to data on new HIV infections with the objective of using the model parameters that give the best fit to predict the cases of new infections by 2030. Using parameter values obtained from the curve fitting, we have calculated the sensitivity indices of the basic reproduction number, , to the parameters in the model using normalised sensitivity index method. The results of sensitivity analysis showed that the model system is most sensitive to infection contact rates, the testing and counselling rates as well as treatment rates.
To assess the impact of combination of different controls, simulations have been conducted. According to the numerical results, we conclude that both high individual protection and counselling and testing combined with ART treatment, can effectively reduce the transmission and the proliferation of HIV in the population. Thus, more resources should focus on the education of the local populations so as to involve more people in the fight against HIV.
The model is not without limitations. The model did not take into account immigration of infected individuals into the system as well as other transmission routes such as the one in the people who inject drugs. Incorporating these processes will undoubtedly facilitate in the understanding of HIV transmission and control in Kenya. The models greatest value is not as a predictive tool but rather a tool for organizing the thinking around HIV infections and the generation of useful insights into the dynamics of HIV transmission. The dynamics are much more complex than described here. We argue that the presented model provides the required insights to understanding HIV spread. The results are relevant in designing time-dependent intervention strategies instead of the constant controls using optimal control theory to effectively examine the cost of each control aimed at combating spread of HIV. Thus, the next stage of this analysis will extend the dynamical model of the epidemic in order to further test the ideas and suggestions discussed here and at the same time project future time trends in the epidemic and to carry out detailed cost benefit analyses.
Acknowledgements
The authors acknowledge, with thanks, the support of Strathmore University, Institute of Mathematical Sciences for the production of this manuscript. The authors are also grateful to the reviewer for the insightful comments.
Additional information
Funding
Notes on contributors
E. O. Omondi
E. O. Omondi is a doctoral fellow at Strathmore University in Kenya. His research interest is in the field of mathematical biology. He is also a teaching fellow at the Institute of Mathematical Sciences of Strathmore University which delivers both undergraduate and postgraduate education and training.
R. W. Mbogo
R. W. Mbogo is the Director in charge of Graduate Research and Training at the Institute of Mathematical Sciences of Strathmore University, Kenya. Her area of interest includes Mathematical Epidemiology and specifically the application of mathematics to disease dynamics.
L. S. Luboobi
L. S. Luboobi is a visiting professor in the Institute of Mathematical Sciences of Strathmore University, Kenya. He has published extensively on models of tropical infections. Our joint research contribution is towards modelling the effectiveness of a combination of HIV control strategies.
References
- AIDS (2016). AIDS. Pre-Exposure Prophylaxis (PrEP). Retrieved April, 2017, from https://www.aids.gov/hiv-aids-basics/prevention/reduce-your-risk/pre-exposure-prophylaxis/
- Birger, R. B., Hallett, T. B., Sinha, A., Grenfell, B. T., & Hodder, S. L. (2013). Modeling the impact of interventions along the HIV continuum of care in Newark, New Jersey. Clinical Infectious Diseases, 58(2), 274–284. doi:10.1093/cid/cit687
- Hamby, D. (1994). A review of techniques for parameter sensitivity analysis of environmental models. Environmental Monitoring and Assessment, 32(2), 135–154. doi:10.1007/BF00547132
- Helton, J. C., Iman, R. L., & Brown, J. B. (1985). Sensitivity analysis of the asymptotic behavior of a model for the environmental movement of radionuclides. Ecological Modelling, 28(4), 243–278. doi:10.1016/0304-3800(85)90077-8
- HIV/AIDS (2016). HIV/AIDS. Retrieved April, 2017, from Pre-Exposure Prophylaxis (PrEP). https://www.cdc.gov/hiv/risk/prep/
- KNBS (2017). Kenya national bureau of statistics. Publication. Retrieved September, 2017 from https://www.knbs.or.ke/
- KNBS2 (2017, September). Kenya 1900. Population Pyramids of the World from 1950 to 2100. Retrieved from https://www.populationpyramid.net/kenya/1990/
- Kok, S., Rutherford, A. R., Gustafson, R., Barrios, R., Montaner, J. S., Vasarhelyi, K., on behalf of the Vancouver HIV Testing Program Modelling Group. (2015). Optimizing an HIV testing program using a system dynamics model of the continuum of care. Health Care Management Science, 18(3), 334–362. doi:10.1007/s10729-014-9312-0
- La Salle, J. P. (1976). The stability of dynamical systems. Philadelphia: SIAM.
- Lou, J., Blevins, M., Ruan, Y., Vermund, S. H., Tang, S., Webb, G. F., … Shao, Y. (2014). Modeling the impact on HIV incidence of combination prevention strategies among men who have sex with men in Beijing, China. PloS One, 9(3), e90985. doi:10.1371/journal.pone.0090985
- Luo, S., Han, L., Lu, H., Dou, Z., Tao, Q., Khoshnood, K., … Xu, J. (2015). Evaluating the impact of test-and-treat on the HIV epidemic among MSM in china using a mathematical model. PloS One, 10(6), e0126893. doi:10.1371/journal.pone.0126893
- Mukandavire, Z., Gumel, A. B., Garira, W., & Tchuenche, J. M. (2009). Mathematical Analysis of a Model for HIV-malaria Co-Infection, 6(2), 333–362.
- NACC (2014a). Council. Kenya National AIDS Control Council ‘Kenya AIDS Strategic Framework 2014/2015–2018/2019ʹ. Retrieved April, 2017 from http://www.undp.org/content/dam/kenya/docs/Democratic
- NACC (2014b). National aids control council of Kenya. ‘Kenya AIDS Response Progress Report 2014: Progress towards Zero’. Retrieved April, 2017 from http://nacc.or.ke/wp-content/uploads/2016/11/Kenya-AIDS-Progress-Report_web.pdf
- Okosun, K., Makinde, O., & Takaidza, I. (2013). Impact of optimal control on the treatment of HIV/AIDS and screening of unaware infectives. Applied Mathematical Modelling, 37(6), 3802–3820. doi:10.1016/j.apm.2012.08.004
- Omondi, E. O., Orwa, T. O., & Nyabadza, F. (2017). Application of optimal control to the onchocerciasis transmission model with treatment. Mathematical Biosciences, 297(2018), 43–57. doi:10.1016/j.mbs.2017.11.009
- Pedro, S., & Tchuenche, J. (2010). HIV/AIDS dynamics: Impact of economic classes with transmission from poor clinical settings. Journal of Theoretical Biology, 267(4), 471–485. doi:10.1016/j.jtbi.2010.09.019
- Perko, L. (2013). Differential equations and dynamical systems (Vol. 7). Springer Science & Business Media.
- Quinn, T. C., Wawer, M. J., Sewankambo, N., Serwadda, D., Li, C., Wabwire-Mangen, F., … Gray, R. H. (2000). Viral load and heterosexual transmission of human immunodeficiency virus type 1. New England Journal of Medicine, 342(13), 921–929. doi:10.1056/NEJM200003303421303
- Roser, M., & Ortiz-Ospina, E. (2017). Literacy. Published online at ourworldindata. org.
- Su, Z., Dong, C., Li, P., Deng, H., Gong, Y., Zhong, S., … Li, M. (2016). A mathematical modeling study of the HIV epidemics at two rural townships in the Liangshan Prefecture of the Sichuan Province of China. Infectious Disease Modelling, 1(1), 3–10. doi:10.1016/j.idm.2016.05.001
- Sun, X., Xiao, Y., Peng, Z., & Wang, N. (2013). Modelling HIV/AIDS epidemic among men who have sex with men in China. BioMed Research International, 2013, 1–18. doi:10.1155/2013/413260
- Thiébaut, R., & May, M. T. (2013). Mathematical modelling of HIV prevention intervention. Aids, 27(3), 475–476. doi:10.1097/QAD.0b013e32835c1509
- Tripathi, A., Naresh, R., & Sharma, D. (2007). Modeling the effect of screening of unaware infectives on the spread of HIV infection. Applied Mathematics and Computation, 184(2), 1053–1068. doi:10.1016/j.amc.2006.07.007
- UNAIDS (2016). Unaids report. Prevention gap report. Retrieved April, 2017 from http://www.unaids.org/sites/default/files/media_asset/2016-prevention-gap-report_en.pdf
- United Nations Programme on HIV/AIDS. (2014). 90-90-90: An ambitious treatment target to help end the AIDS epidemic. Geneva, Switzerland: Joint United Nations Programme on HIV. AIDS.
- Van Den Driessche, P., & Watmough, J. (2002). Reproduction numbers and sub-threshold endemic equilibria for compartmental models of disease transmission. Mathematical Biosciences, 180(1–2), 29–48. doi:10.1016/S0025-5564(02)00108-6
- WB. (2017). World bank data. Birth rate, crude (per 1,000 people). Retrieved October, 2017 from https://data.worldbank.org/indicator/SP.DYN.CBRT.IN
- WHO (2014). March 2014 supplement to the 2013 consolidated guidelines on the use of antiretroviral drugs for treating and preventing HIV infection: recommendations for a public health approach.
- WHO. (2015). Guideline on when to start antiretroviral therapy and on pre-exposure prophylaxis for HIV. World Health Organization.
- Williams, B. G. (2014). Optimizing control of HIV in Kenya. arXiv preprint arXiv:1407.7801.
- Williams, B. G., Hargrove, J. W., & Humphrey, J. H. (2010). The benefits of early treatment for HIV. Aids, 24(11), 1790–1791. doi:10.1097/QAD.0b013e32833ac860
- Yang, W., Shu, Z., Lam, J., & Sun, C. (2017). Global dynamics of an HIV model incorporating senior male clients. Applied Mathematics and Computation, 311, 203–216. doi:10.1016/j.amc.2017.05.030
- Yerly, S., Vora, S., Rizzardi, P., Chave, J.-P., Vernazza, P., Flepp, M., … Perrin, L. (2001). Acute HIV infection: Impact on the spread of HIV and transmission of drug resistance. Aids, 15(17), 2287–2292. doi:10.1097/00002030-200111230-00010
- Zhang, L., Gray, R. T., & Wilson, D. P. (2012). Modelling the epidemiological impact of scaling up HIV testing and antiretroviral treatment in China. Sexual Health, 9(3), 261–271002E. doi:10.1071/SH11104