
 ?Mathematical formulae have been encoded as MathML and are displayed in this HTML version using MathJax in order to improve their display. Uncheck the box to turn MathJax off. This feature requires Javascript. Click on a formula to zoom.
Abstract
Substance/drug abuse poses a significant threat to the health and socio-economic fabric of individuals and nations. The combined abuse of alcohol and the highly addictive methamphetamine has worsened the drug epidemic in South Africa, especially in the Western Cape province. In this paper, a mathematical model is formulated to model the dynamics of alcohol and methamphetamine co-abuse. We prove that the equilibria of the submodels are locally and globally asymptotically stable when the sub-model threshold parameters are less than unity. The basic reproduction number due to co-abuse is shown to be the maximum of the two sub-model reproduction numbers. Sensitivity analysis reveals that the most sensitive parameters in the co-abuse epidemic are the alcohol and methamphetamine recruitment rates β1 and β2 respectively. The prevalence curve is indicative of a persistent drug problem in the region. Hence, the need to promote social programs that raise awareness of the dangers posed by multiple substance abuse, through educational campaigns in learning institutions, social media and health institutions. Transmission control must focus on enhancing the quitting process while promoting support services to drug users during and after treatment to minimize cases of relapse.
PUBLIC INTEREST STATEMENT
Substance/drug abuse poses a significant threat to the health and socio-economic fabric of individuals and nations. The habit of taking several substances/drugs only degrades the process of detoxification during treatment programmes. The presented model provides the required insights to understanding co-abuse in substance abuse epidemic. The results are relevant in designing intervention strategies aimed at combating multiple substance abuse in the Western Cape Province of South Africa.
1. Introduction
Substance/drug abuse poses a significant threat to the health, and socio-economic fabric of individuals and nations (WHO, Citation2018). It is estimated that out of a quarter of a billion people who used drugs in 2015, about 29.5 million suffered substance/drug-related disorders (UNODC, Citation2018). South Africa (SA) has experienced a continuous rise in multiple substance/drug abuse, especially in the recent past (Pluddemann et al., Citation2012). According to a report by the South African Community Epidemiology Network on Drug and Use (SACENDU), alcohol still remains the primary and most preferred substance of abuse among patients seen at specialist treatment centres across the country (Siphokazi et al., Citation2017). Drugs such as methamphetamine (MA), cannabis, cocaine and heroin have increasingly become popular among alcohol and other drug users in SA (Pluddemann et al., Citation2012). MA, cannabis and alcohol remain the most popular substances of abuse in the Western Cape (WC) Province of South Africa (Siphokazi et al., Citation2017), together comprising 91% of all admissions in the province. In the period July–December 2016, 29% of patients admitted to rehabilitation centres in the WC were being treated for MA and cannabis abuse, respectively. In the same period and region, 21% of all admissions were patients of alcoholism (Mposo, Citation2018). These numbers do not only present a worrying trend but a serious public health quandary.
Alcohol is a psychoactive substance with dependence-producing properties (Citation2018). The harmful use of alcohol results in 3.3 million deaths each year (Citation2018). Alcohol is known to have deleterious effects on the body’s immune system (NIH, Citation2018). The short-term effects of abuse may feature slowed down the activity of the brain causing speech to slow and the irregular drift in body temperatures (NIH, Citation2018). The long-term effects of alcoholism may include the emergence of serious organ diseases and socio-economic burden in families. Moreover, addicts may experience extreme pain during feeding as the digestive organs become inflammable (Barclay, Barbour, Stewart, Day, & Gilvarry, Citation2008).
MA, on the other hand, is a highly addictive illicit drug with over 26 million users worldwide (UNODC, Citation2018). The demand, spread and abuse of this vicious stimulant have increased dramatically in the recent past. MA (aka “tik” in WC) is a bitter white crystalline powder that is made up of ingredients that are readily available (Pluddemann et al., Citation2012). The neurotoxic effects of MA use have been well documented in (Chang, Alicata, Ernst, & Volkow, Citation2007; Kalechstein, Newton, & Green, Citation2003; Nordahl, Salo, & Leamon, Citation2003). The tremendous growth in the population of MA users in the Western Cape Province is documented to have reached epidemic levels (Siphokazi et al., Citation2017).
Despite the numerous negative consequences to the hosts, the trend of multiple substance abuse has continued to grow in recent years. Many young South Africans tend to use and abuse drugs in combination (SANCA, Citation2018). According to the 2017 SACENDU report (Siphokazi et al., Citation2017), multi-substance abuse remained high in the country, with 48% of patients in the WC region reporting using more than one substance of abuse. Clinical research indicates that the habit of taking several substances/drugs degrades the process of detoxification during treatment programmes (Center for Substance Abuse Treatment, Citation2005b). Denial by substance/drug abuse patients to using multiple substances/drugs of abuse only complicates the process of treatment/rehabilitation.
Efforts to resolve multi-substance abuse is further complicated by the fact that most if not all, the treatment centres and medical facilities in SA only provide experienced services at treating single substance/drug addiction cases (Bower, Citation1985). Moreover, Data on individuals who abuse more than one substance are either not available at all or is poorly document in SA. It has been shown that recovering from substance/drug abuse is easier when only one drug is involved (Center for Substance Abuse Treatment, Citation2005a). The abuse of more than one substance will certainly increase the cost of treatment and relapses (Center for Substance Abuse Treatment, Citation2005a).
While there could be numerous reasons for using more than one substance, some of the attractions included the following: desire to increase, to balance and to maintain the effects of the primary substance of choice, to experience greater euphoria, and even longer hours of sleep (Bower, Citation1985). Research work in (Kirkpatrick, Gunderson, R Frances, Foltin, & Hart, Citation2012), revealed that in comparison to single drug effects, alcohol-MA combination produces a greater elevation of heartbeat and elation, which is arguably a motivation for its popularity and use in the WC region (Mendelson, Jones, Upton, & Jacob, Citation1995).
The concept of co-infection has been captured in several infectious disease models, see for instance, HIV and TB coinfection (Bolarin & Omatola, Citation2006; Naresh & Tripathi, Citation2005; Pawlowski, Jansson, Skold, Rottenberg, & Kallenius, Citation2012; Roeger, Feng, & Castillo-Chavez, Citation2009), HIV and hepatitis C coinfection (Kalichman et al., Citation2015), Malaria and Lymphatic Filariasis (Slater, Gambhir, Parham, & Michael, Citation2013). The understanding of how co-infection affects the dynamics and control of substance/drug abuse has become increasingly significant. Such dynamics have in the past provided meaningful evidence in pathogenic within-host interactions (Alter, Citation2006; Brooker, Akhwale, Pullan, Estambale, & Clarke et al., Citation2007; Cattadori, Boag, & Hudson, Citation2008; Cox, Citation2001; Petney & Andrews, Citation1998). Just like diseases, multi-substance abuse phenomenon is likely to change the course of “infection” of “co-infected” individuals. However, the actual mechanisms by which new cases of substance abuse are aggravated by multi-substance abuse are poorly understood.
One of the purposes of modelling substance abuse epidemics is to provide a rational basis for policies designed to control the spread of substance/drug abuse. A sundry of research works on drug epidemic models have focussed on the abuse of single substances/drugs, see for instance (Burattini, Massad, & Coutinho, Citation1998; Mulone & Straughan, Citation2009; Nyabadza & Hove-Musekwa, Citation2010; Samanta, Citation2011; Samanta & Sharma, Citation2012; Sharma & Samanta, Citation2015; White & Comiskey, Citation2007a, Citation2007b). Studies in (Sharma & Samanta, Citation2015) reveal the possible existence of backward bifurcation in an alcohol drinking epidemic with treatment control. Moreover, a heroin epidemic model in (White & Comiskey, Citation2007b) is modified in (Samanta, Citation2011) to identify parameters that drive the epidemic and hence policy formulations that target optimal treatment and prevention measures against the epidemic. Very little work has been done on the mathematical modelling of multi-abuse of substances/drugs. This could be attributed to a lack of data on multiple substance/drug use.
This paper is drawn from a master’s thesis that was done by the first author while at Stellenbosch University in South Africa (Orwa, Citation2014). Treatment geared towards and campaign against multi-substance abuse remain the only viable form of control against the multi-substance/drug abuse epidemics and its spread in communities. We focus on mathematical modelling of co-use of alcohol and methamphetamine. To the author’s best knowledge, co-infection modelling has not been applied to substance/drug abuse and transmission.
The rest of the paper is organized as follows: The co-abuse model of alcohol and methamphetamine is formulated in Sections 2. Mathematical analysis of the co-abuse model is performed in Section 3. In Sections 4 and 5, the individual submodels are formulated and analysed. Numerical simulation including parameter estimation, sensitivity analysis and data fitting is performed and discussed in Section 6. The paper is concluded in Section 7 with relevant discussions and recommendations on the co-abuse of alcohol and methamphetamine.
2. Co-abuse model formulation
We formulate a simple mathematical model that captures the co-use of alcohol and methamphetamine in the population. The model subdivides the human population into seven mutually exclusive compartments, namely those individuals that have never taken alcohol and/or used methamphetamine, but are at risk of using either substance
(they are also termed susceptibles); alcohol users not under treatment
; alcohol users under treatment
; methamphetamine users who are not under treatment
; methamphetamine users under treatment
; users of both alcohol and methamphetamine who are not under treatment
and users of both alcohol and methamphetamine under treatment
Therefore, the total human population at any time
is given by
2.1. Basic assumptions
Individuals get recruited into the susceptible population through birth and immigration at a constant rate,
.
Susceptibles become alcohol users through interactive activities with drinking friends/colleagues and drinking family members.
Individuals may become methamphetamine users through contact with other methamphetamine users who may include friends, family members and even colleagues in work places.
Entry into substance abuse is mainly driven by peer pressure. We thus assume that substance abuse spreads like a disease that spreads through contact or proximity to pathogen carriers.
Alcohol users begin to use methamphetamine through interactive activities with methamphetamine users in places of substance abuse such as clubs and bars.
Mathemaphetamine users begin to take alcohol through contact with alcohol users.
The class of substance abusers is often divided into light/moderate users and heavy users, see for instance (Nyabadza & Hove-Musekwa, Citation2010; Nyabadza, Njagarah, & Smith, Citation2013). For simplicity, we combine these two classes because our primary interest is in those who abuse both alcohol and methamphetamine. Assuming homogeneous mixing of populations, non-alcohol drinkers acquire alcohol drinking habits at rate with
with the parameter denoting the effective contact rate (i.e. the contact with an alcohol drinker that will result in one taking alcohol). To account for the decreased chances of becoming an alcohol drinker after being in contact with alcoholics and co-users in rehabilitation, it is assumed here that those under treatment tend to have lower recruitment aptness relative to addicts. Those under the influence of alcohol are more likely to be co-users when they get into contact with those who abuse both substances and not under rehabilitation. Therefore,
while
Similarly, individuals get initiated into using methamphetamine at the rate given by
where the parameter is the effective contact rate for initiation into methamphetamine abuse. The modification parameters
and
are both assumed to be less than unity. This would account for the reduced tendency to initiate new users into methamphetamine abuse by methamphetamine users under treatment. Like in the case of alcohol, we assume that
.
Individuals in the compartment begin to use methamphetamine at a rate
and move into the compartment
with
accounting for the increased chances of using methamphetamine by alcohol users when compared to non-alcohol users. Individuals not under treatment may die due to alcohol-related causes at a rate
or die naturally at a rate
a rate that is also assumed for the rest of the population. Furthermore, those that abuse alcohol may seek treatment for alcohol dependence at a rate
or altogether, quit alcohol drinking at a rate
Alcohol users, upon successful treatment in the compartment
, permanently quit alcohol at the rate
We assume that those that quit do so permanently. Ideally, quitters should be allowed to relapse. In this model, we only assume relapse in the form of rehabilitation failure. This is a plausible assumption in the Western Cape scenario where drop-out rates of patients at facilities may be as high as 40% (Ramlagan, Peltzer, & Matseke, Citation2010).
Similarly, susceptible individuals in , get recruited into the class
at a rate
through contact with those using methamphetamine. Some individuals in
acquire alcohol drinking habits at the rate
and move into the class
with
accounting for the increased chances of drinking alcohol for methamphetamine users when compared to those not using methamphetamine. Others may enter into rehabilitation in compartment
at a rate
and may relapse back to
at a rate
Individuals in the class
may die due to methamphetamine-related causes at a rate
or permanently quit methamphetamine at a rate
Users of both alcohol and methamphetamine in the class, may revert to alcohol abuse only at a rate
or to methamphetamine abuse only at a rate
upon quitting either substances of abuse. In addition, individuals in this class may die as a result of death related to abuse of both alcohol and methamphetamine such as liver cirrhosis and pancreatitis at a rate
They progress into the treatment class
at a rate
Individuals under treatment for alcohol and methamphetamine abuse in
may relapse into alcohol-methamphetamine abuse compartment at a rate
or quit drinking of alcohol and relapse to
, at a rate
. Similarly, they may quit methamphetamine and revert to the class of alcohol users not under treatment
at a rate
. We also allow permanent quitting for individuals in the classes
and
at rates
and
respectively. We assume here that permanent quitting results from effective rehabilitation programs. Clearly, the presented model has additional assumptions. Individuals under treatment take alcohol and/or methamphetamine as the treatment process is taken to be outpatient and hence can initiate others. Although quitting both substances at the same time is unlikely, in this model, we allow permanent quitting of individuals in rehabilitation for both alcohol and methamphetamine.
The flow of individuals between classes is given in Figure .
Figure 1. A compartmental representation of the epidemic of alcohol-methamphetamine co-use.
A description of parameters used in the co-abuse model and its sub-models are defined in Table .
Table 1. Descriptions of co-abuse model parameters
2.2. Model equations
From the above assumptions, parameter definitions and variables, we have the following model system of differential equations, with non-negative initial conditions that describe the dynamics of the co-use alcohol and methamphetamine epidemic. The compartment is considered to be superfluous.
where
3. Mathematical analysis of the co-abuse model
3.1. Positivity and boundedness of solutions
For every dynamical system, it is important to establish the long-term behaviour of its solutions. The formulated model system model monitors changes in the human population. We, therefore, assume that the variables and the parameters used are all non-negative for all time, .
Theorem 3.1. If ,
,
,
,
,
,
, are non-negative, then so are
,
,
,
,
,
,
for all time
. Moreover,
Proof. Assume that is the maximum time for the epidemic. That is, assume,
. Therefore,
and from the first equation of model system (4), we obtain
So that
Hence,
Now, from Equation (4), we have;
It can similarly be shown that ,
,
and
. Thus the solutions of (4) remain positive for all
.
The evolution change in the population is given by
It can easily be seen that
From Equation (8), we observe that as ,
. So that if
then
. Clearly
is the upper bound for of
. On the other hand, if
, then
will decrease to
as
. This means that if
, then the solution
enters the feasible region
or approaches it asymptotically. □
The feasible region, for system (4) is therefore given as
The region is positively invariant.
3.2. Steady states and stability analysis of the co-abuse model
The substance abuse free equilibrium of the co-infection model (4) exists when there are no substance users in the community. That is,
,
,
,
,
,
. Therefore,
Following (van Den Driessche & Watmough, Citation2002), we have the following results on the local stability of .
Theorem 3.2. The substance abuse free equilibrium, , is locally asymptotically stable if
and unstable if
.
Next, we calculate the co-abuse endemic steady state(s), . This is a scenario in which there are some substance users in the society. Upon equating to zero and solving the derived system (in terms of the forces of infections
and
) from the model system (4), we obtain
,
,
,
,
,
,
where,
Given that
we have,
where
and
Note that if , then clearly
. This gives the co-use-free equilibrium derived in (10). The solutions to the remaining part of the polynomial (12), described by Equation (13) define the possible endemic states of the model system (4). A scenario in which the combined abuse of alcohol and methamphetamine persists in the society. We thus have
The existence of the endemic stable states for the co-use epidemic model depends on the solutions of (13). The solutions must, however, be real and positive. Determining the explicit existence of the endemic equilibrium in clearly mathematically intractable. We thus comprehensively analyse the sub-models of the co-abuse model and resort to numerical simulations for further applications of the co-abuse model.
3.3. Basic reproduction number of the co-abuse model
The basic reproduction number of the co-abuse model system (4), denoted by , is calculated using the next generation matrix method (van Den Driessche & Watmough, Citation2002). It is given by
where and
The term represent contribution to new cases of co-abuse of alcohol and methamphetamine resulting from an existing alcohol user. On the other hand, the term
represents the contribution to new “infections” resulting from one user of methamphetamine in a completely susceptible population.
4. Alcohol abuse model
This model is given when . The co-abuse model (4) reduces to the following system of equations:
where
The alcohol model (15) has an alcohol-free equilibrium given by .
4.1. Reproduction number for the alcohol epidemic model ()
We establish a threshold parameter resulting from the alcohol model. We are interested in establishing the possible number of new cases that would be produced by a single alcohol user, assuming the absence of the other drugs or substances of abuse, in a completely susceptible population. Using the approach and notations described in (van Den Driessche & Watmough, Citation2002), the matrices for the new infections terms and the transfer terms denoted by and
respectively at the alcohol-free equilibrium are given as follows:
It, therefore, follows that basic reproduction number due to alcohol abuse is given by
We now present the stability of the equilibrium points established from the alcohol abuse model (15).
4.2. Global stability of the alcohol-free equilibrium
Theorem 4.1. is globally asymptotically stable in
if
Proof. Let
be a candidate Lyapunov function. The derivative of with respect to time
is given by
Noting that all the model parameters are positive, it follows that for
with
only if
. Hence,
is a Lyapunov function on
. Since
is invariant and attracting, it follows that the largest possible invariant set in
is the singleton
. Therefore, by the La-Salle’s invariance principle (La Salle, Citation1976), every solution to the equation in the alcohol-only model in system (15) with initial conditions in
approaches
as time approaches infinity. That is, as
,
. Substituting for
into the model system (15), gives
as
. Thus
as
for
so that
is globally asymptotically stable in
if
. □
4.3. Endemic equilibrium and its stability
Upon equating model system (15) to zero and solving for ,
and
in terms of the force of infection
, we obtain the following expressions.
Furthermore, on substituting equations in (21) into (16), we obtain the polynomial
From the polynomial (22), corresponds to the alcohol free-equilibrium. A scenario in which there is no alcohol abuse in the community.
Similarly, which exists for
corresponds to the endemic equilibrium, a state in which alcohol abuse persists in the community. Therefore, the alcohol-endemic equilibrium point(s) is given by
where
and
are as described in Equation (21) and exists only if
.
4.4. Global stability of the alcohol-endemic equilibrium point, (Anthuvan)
We show that if the population is constant, the endemic steady state , is globally asymptotically stable. We thus assume that
The differential equations in system (15) become
Since , is a constant, we let
,
and
:
We have a non-dimensionalized system given by
We argue here that system (25) has a unique endemic equilibrium following the analysis of the original model. We thus have the following theorem.
Theorem 4.2. The alcohol-endemic equilibrium is globally asymptotically stable whenever
is greater than unity, and the if the population is constant within the modelling time.
Proof. We propose a suitable Lyapunov function such that
The positive constants and
are to be determined. We observe that from the proposed Lyapunov function in Equation (26), the first partial derivatives with respect to any of the state variables is given by
are all zero at the corresponding alcohol-endemic steady state. That is, at the endemic steady states, ,
and
. In addition, the second partial derivatives of
with respect to any of the three state variables are given as follows;
We observe from Equation (28) that all the second partial derivatives are positive. This indicates that the alcohol endemic equilibrium is the minimum of each of the state variables.
The time derivative of the Lyapunov function in (26) is given by
Substituting for ,
and
from system (25), we have
where ,
and
.
We now use the system of Equation (25) at to obtain:
We now substitute the terms in Equation (31) into Equation (30) so that
Let ,
, and
.
Therefore, becomes
Setting the coefficients of ,
,
,
to zero, we obtain
Upon substituting the expressions in Equation (34) back into (30) we obtain
Also, on substituting the values of and
in Equation (34) into Equation (33), and on further simplification, we obtain
From Equation (36), we observe that the expression is less than or equal to zero with the equality holding if and only if
or
.
Also, the expression with the equality holding if and only if
or
.
We can draw similar conclusions from the remaining expressions and
. In the two cases, equality holds if and only if
.
Therefore, with equality holding if and only if
. Since
only when
, which corresponds to
,
, and
and subsequently, to
,
and
, the largest invariant set in
is the singleton
. By LaSalle’s invariance principle (La Salle, Citation1976), we, therefore, conclude that the endemic equilibrium
is globally asymptotically stable in the interior of
. This shows that every solution in
or that intersects
, would approach the endemic equilibrium
. □
5. Methamphetamine-abuse model
The co-use model reduces to the following model when only methamphetamine is being abused.
where
5.1. Model equilibria
Setting the right-hand side of equations in model system (37) to zero, and solving for ,
and
, we obtain the polynomial
From Equation (38), corresponds to the methamphetamine-free equilibrium, denoted by
and this is a scenario in which the community is free of methamphetamine abuse.
Note that is the methamphetamine-abuse reproduction number.
5.2. Stability analysis
From polynomial equation given in (38),
which exists only if , and corresponds to the methamphetamine-endemic equilibrium, denoted by
such that
where
Due to the similarity between the structures of the two sub-models, we state the following theorems on the stability of the steady states.
Theorem 5.1. The unique methamphetamine-free equilibrium point, is locally asymptotically stable for
and unstable for
Theorem 5.2. The unique endemic equilibrium, is globally stable for
if the population is constant over the modelling time.
Remark:
We notice from Equation (14) that the reproduction number due to the combined abuse of alcohol and methamphetamine is basically the maximum of either of the sub-model reproduction numbers. Therefore , where
is the average number of new alcohol drinkers produced as a result of associating with an individual who drinks alcohol during his or her entire drinking life and
is the average number of new methamphetamine users produced as a result of associating with an individual who uses methamphetamine, during his or her entire methamphetamine-using career.
6. Numerical simulation
6.1. Parameter estimation
In this section, we estimate the co-use model parameters to be used in the simulations. While most parameters are obtained from the fitting of the sub-models to alcohol and methamphetamine data, some parameters are simply estimated based on available literature, see (Bhunu & Mushayabasa, Citation2012a; Burattini et al., Citation1998; Nyabadza & Hove-Musekwa, Citation2010; Nyabadza et al., Citation2013; UNODC, World Drug Report, Citation2013). On average, the life expectancy in Sub-Sahara Africa and that of South Africa at the beginning of the modelling time, i.e. 1997 was about 50 years (Jamison et al., Citation2006). This, therefore, corresponds to a mortality rate of 0.02 per annum. We thus have the natural mortality rate, . According to Gray in (Day & Gray, Citation2008), the average birth rate in South Africa is approximated 0.028 per annum. To account for impact immigration into the Western Cape Province of South Africa, we shall set our recruitment rate
to be greater than 0.028 per annum. The actual mortality rate due to substance abuse is complex to estimate. This could be due to variations in risky behaviours by individuals while under the influence of substances of abuse (Burattini et al., Citation1998). This variation also extends within and among a population. The mortality rate, for example, among injecting crack-cocaine users in (Burattini et al., Citation1998) was 0.018 per year. According to a report in (NIDA, National Institute on Drug Abuse, Citation2018), a smokers life expectancy is increased by about 14% if he/she quits smoking at about age 35. Since treatment impacts positively on the quality of life, we assume that it reduces mortality rate related to substance abuse. Thus, we choose
,
,
and
per year. The observed treatment demand for methamphetamine users was 17% in (Nyabadza & Hove-Musekwa, Citation2010). In this paper, we choose the average treatment demand of 30% as the corresponding treatment rate of 0.3. The summary of parameter values used in the numerical simulations is given in Table .
Table 2. Description of parameters of the co-abuse model, their values and their ranges
Observe from Figure that when the co-abuse model reproduction number , the populations of alcohol and methamphetamine abusers with and without treatment decline to near zero in numbers. However, the susceptibles population approaches a constant,
. This shows that when
; that is, (
and
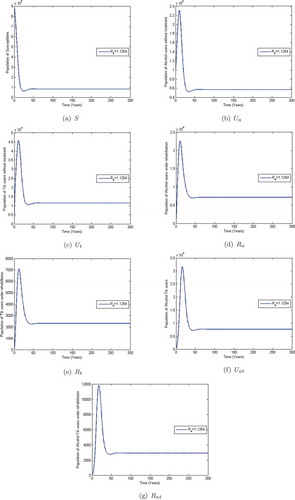
), the alcohol-methamphetamine co-abuse epidemic dies out and only the susceptible population remains. The given system approaches the substance-free equilibrium (SFE) which is consistent with Theorem 3.2. On the other hand, Figure shows that the populations of susceptibles, methamphetamine and alcohol abusers in treatment and those without treatment initially increase and later level off at different heights when
. This implies that the co-abuse system (4) stabilizes at an endemic equilibrium point
. The co-abuse epidemic would persist when
.
Figure 2. Graphs showing the population dynamics of ,
,
,
,
,
and
for
. Used parameter values are available in Table .
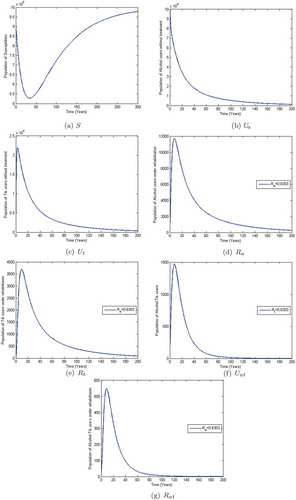
Figure 3. Graphs showing the population dynamics of ,
,
,
,
,
and
for
. Used parameter values are available in Table 2.
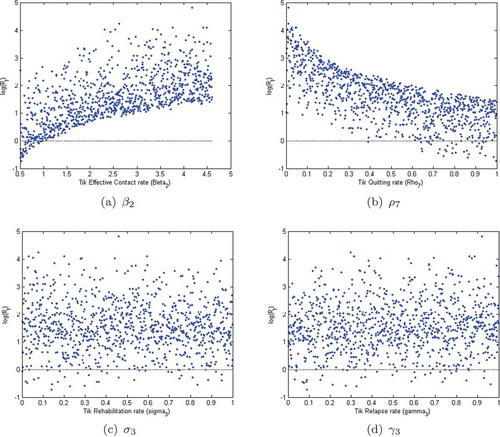
6.2. Sensitivity analysis
We use Latin Hypercube Sampling (LHS) to determine the Partial Rank Correlation Coefficients (PRCCs) with 1000 simulations per run to establish the sensitivity of the model parameters to the population of alcohol-methamphetamine abusers in the compartment . We observe from Figure , that the parameters with the greatest potential to worsen the co-use epidemic of alcohol and methamphetamine abuse are the effective person to person contact rates,
and
. Similarly, the relapse rate from the treatment to the class of methamphetamine users is observed to be highly significant, and may easily worsen the epidemic. Moreover, the quitting parameter,
is the parameter with the greatest potential to make the epidemic better when increased.
Figure 4. PRCCs for the full range of parameters from Table .
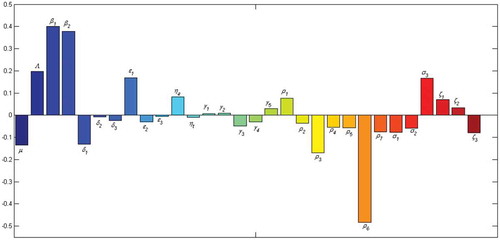
Figure 5. Graphs (a), (b), (c) and (d) show the Monte Carlo simulations for the four parameters with the greatest PRCC magnitude in the alcohol model. Parameter values in Table and ,000 simulations per run were used.

Using the parameter values defined in Table , we illustrated the Monte Carlo simulations for the four parameters whose PRCC magnitudes are as shown in Figure . We observe from Figure , that the parameters ,
,
and
are positively correlated with the population of co-users of alcohol and methamphetamine (
). The parameters
and
are highly significant whereas the parameters
and
are less significant in the correlation. This means that an increase in these parameters will worsen the substance abuse epidemic. Those that show some negative correlation decrease the epidemic when they are increased. Typically, this is observed in the permanent quitting rates.
The PRCC scatter plots clearly show that the alcohol reproduction number is mainly influenced by the transmission parameter and the relapse rate
. Control measures against alcohol abuse should, therefore, focus on reducing new cases and ensuring that all the treatment facilities provide effective treatment services to minimize the rampant cases of relapse. The above trend is also observed in the methamphetamine model (see Figure ).
Figure 6. Graphs (a), (b), (c) and (d) show the Monte Carlo simulations for the four parameters with the greatest PRCC magnitude in the methamphetamine (MA) model. Used parameter values can be found in Table (2). One thousand simulations per run were used.
6.3. Numerical results
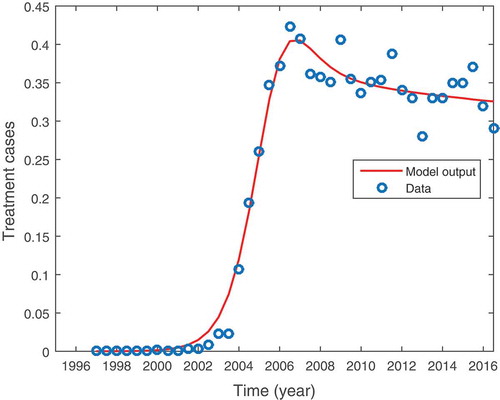
In this subsection, we fit the model systems (15) and (37) to the data of individuals seeking treatment for alcohol and methamphetamine as their primary substance of abuse at specialised treatment centres in the Western Cape Province. The data were collected from 1996 to 2016 on a 6-month interval by SACENDU (Siphokazi et al., Citation2017) and is given in Tables and .
Table 3. Primary Methamphetamine-abuse for the period 1997a to 2016b in % (Source: (Siphokazi et al., Citation2017)). The letters a and b represent the first 6 months (January–June) and the second 6 months (July–December) of the year, respectively
Table 4. Primary Alcohol abuse: by 6-month period (from 1997a to 2016b in % (Source: (Siphokazi et al., Citation2017))
The least squares curve fit is used to fit the models to data. A Matlab code is used in which, the unknown parameter values are given a lower bound and an upper bound from which the set of parameter values that produce the best fit are obtained. The data on the demand for treatment are used to model growth in the class in the methamphetamine sub-model.
Figure shows the graphical representation of model (15) fitted to data for persons seeking treatment for methamphetamine abuse. The circles and the solid line each represent the actual data points and the model fit to the data, respectively. We observe that the model fits well with the data. Furthermore, we notice that there was no population of methamphetamine users before 1996. The unavailability of such data could be attributed to a lack of data collection before the year 1996 (Nyabadza & Hove-Musekwa, Citation2010). Individuals may have been using the drugs but never really sort treatment services. It is equally important to notice that the population methamphetamine users under treatment peaked in the year 2006. The results showed a short-term and fast-growing methamphetamine epidemic in which there was a significant increase in the number of users between 2002 and 2005, followed by a significant slowdown in the generation of new cases. The data shows an epidemic that is stabilizing at about 35% of the rehabilitants. The model also shows a steady state solution close to this value.
Figure 7. Shows methamphetamine model (37) fitted to data for addicts seeking treatment for methamphetamine as a primary substance of abuse in the Western Cape Province of South Africa. Parameter values are in Table (2).
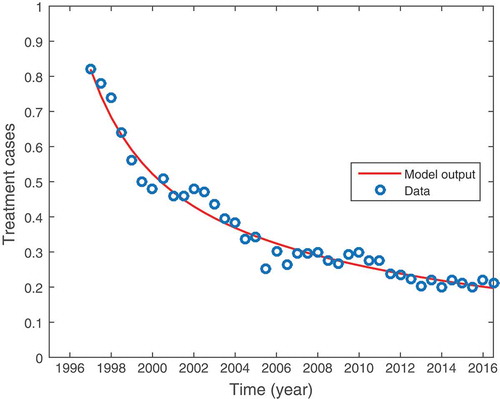
The data showing the demand for treatment for alcohol addiction are shown in Table . As with methamphetamine, the alcohol data were similarly collected by SACENDU (Siphokazi et al., Citation2017) from 1996 to 2016 in time intervals of 6 months.
From Figure , we observe that the proportion of individuals seeking treatment for alcohol abuse has been on a steady decline. The decline could be associated with heavy under-reporting of alcohol abuse. Given the stigma associated with alcohol drinking in many communities in SA, people tend to under-report their consumption of alcohol, as it is perceived to be socially undesirable (Livingston & Callinan, Citation2015; Parry et al., Citation2005; Stockwell et al., Citation2004). Moreover, it is also thought that some alcohol users may have found refuge in other substances/drug of abuse, thereby quitting alcohol or reducing their alcohol intake. The presented prevalence trends from data collected in WC by SACENDU may therefore not be representative of the actual prevalence and intensity of alcohol intake and abuse in the region. Further research work is thus necessary to establish why very few people only seem to recognize other substances/drugs and not alcohol as being part of their substance abuse problem. One way to address the current under-reporting in alcohol abuse is to use data on binge drinking to assist policymakers to monitor trends in alcohol use, especially risky drinking (Probst, Shuper, & Rehm, Citation2017; Vellios & Van Walbeek, Citation2018).
Figure 8. Shows alcohol-model (15) fitted to data for individuals seeking treatment for alcohol abuse in Cape town and Western Cape province of South Africa. Parameter values are in Table (2).
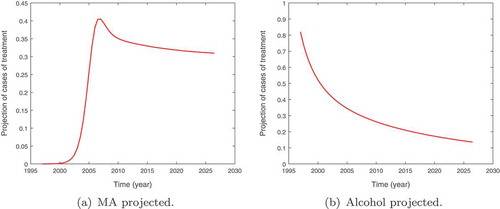
The projected population of alcohol and methamphetamine patients under treatment in the Western Cape Province until the year 2027 are given in Figure . We observe that the population of methamphetamine users would remain constant for the 9-year period. This is supported by the data that seems to fluctuate around this steady state. The population of alcohol users under treatment is however shown to be on the decline. The decline once again could be attributed to the growing popularity of other substances/drugs of abuse such as cannabis and methamphetamine in the region coupled with under-reporting.
Figure 9. Graphs showing the projected population of methamphetamine (MA), (a) alcohol (b) abuse patients seeking treatment services in Western Cape province, South Africa.
7. Discussion and conclusion
In this paper, a deterministic model of co-use of alcohol and methamphetamine is presented and analysed. The model is decomposed into two sub-models; the alcohol submodel and methamphetamine submodel. We establish that the co-use model reproduction number is the maximum of the sub-model reproduction numbers, and
. By constructing a suitable lyapunov function, the analysis shows that the alcohol-free equilibrium of the model is globally asymptotically stable whenever
is less than unity. The health implication of this observation is that keeping the reproduction numbers below unity may be necessary for the effort to control the growth of the alcohol epidemic and subsequently the co-use epidemic of alcohol and methamphetamine.
The results from the sensitivity analysis suggest that the control of the combined abuse of methamphetamine and alcohol pivots around social intervention programs aimed at new users. Limiting new cases through preventive measures such as educational campaigns and other activities that encourage new users to quit. Secondly, cases of relapse should be minimised. Furthermore, there is the need to adopt in-patient treatment methods as opposed to the usual out-patient method, as this would limit contact with other drug users and hence lowering new relapse cases.
During treatment, alcohol-methamphetamine co-abuse could be managed by ensuring that treatment providers and rehabilitation centres treat patients for their concurrent substance abuse aggressively or refer them appropriately to other medical facilities. The providers should try to understand and address the underlying causes of concurrent substance use among visiting patients. This is vital for future policy formulations.
The model presented has emphasised that data collection on substance abuse should not be restricted to the primary substances of abuse but should also extend to multiple abuses of substances/drugs. The different substance combinations should be well documented. Owing to the numerous modelling assumptions made in this paper, the presented co-use substance abuse model may not provide an exact and a true representation of the epidemic resulting from the co-use of alcohol and methamphetamine in the Western Cape Province of South Africa. The dynamics are much more complex than described here. We argue that the presented model provides the required insights to understanding co-use in substance abuse epidemic. The results are relevant in designing intervention strategies aimed at combating multiple substance abuse in the Western Cape Province of South Africa.
Acknowledgements
We are grateful to the University of Stellenbosch, the African Institute for Mathematical Sciences (AIMS) and Strathmore University for their support during the production of this manuscript.
Disclosure statement
The authors declare that there are no competing interests regarding the publication of this paper.
Additional information
Funding
Notes on contributors
T. O. Orwa
T. O. Orwa is currently a doctoral fellow pursuing his PhD in Biomathematics at the Institute of Mathematical Sciences, Strathmore University (Kenya). He holds a Masters of Science (MSc) degree in Mathematical Sciences from the African Institute for Mathematical Sciences (AIMS), South Africa and Masters of science (MSc) in Mathematics from University of Stellenbosch in South Africa. He has a range of interest in Mathematical Biology with specific interest in substance abuse modelling and infectious disease modelling.
F. Nyabadza
F. Nyabadza is a professor in the Department of Mathematical Sciences of Stellenbosch University, South Africa. He has many research articles and has supervised several students at masters level, PhD level and even at post-docs levels. His area of interest is Mathematical Epidemiology (specifically, infectious disease modelling).
Related Research Data
References
- Alter, M. J. (2006). Epidemiology of viral hepatitis and HIV co-infection. Journal of Hepatology, 44, S69. doi:10.1016/j.jhep.2005.09.019
- Barclay, G. A., Barbour, J., Stewart, S., Day, C. P., & Gilvarry, E. (2008). Adverse physical effects of alcohol misuse. Advances in Psychiatric Treatment, 14, 139151. doi:10.1192/apt.bp.105.001263
- Bhunu, C. P., & Mushayabasa, S. (2012a). A theoretical analysis of smoking and alcoholism. Journal of Mathematical Modelling and Algorithms, 11, 387–25.
- Bhunu, C. P., & Mushayabasa, S. (2012b). A theoretical analysis of smoking and alcoholism. Journal of Mathematical Modelling and Algorithms, 11(4), 387–408. doi:10.1007/s10852-012-9195-3
- Bolarin, G., & Omatola, I. U. (2006). A mathematical analysis of HIV/TB co-infection model. Applied Mathematics, 6(4), 65–72.
- Bower, B. (1985). Multiple drug use: A dangerous trend. Science News, 128(1), 1– 6.
- Brooker, S., Akhwale, W., Pullan, R., Estambale, B., Clarke, S. E., Snow, R. W., & Hotez, P. J. (2007). Epidemiology of plasmodium-helminth co-infection in Africa: Populations at risk, potential impact on anemia, and prospects for combining control. The American Journal of Tropical Medicine and Hygiene, 77, 88–98.
- Burattini, M. N., Massad, E., & Coutinho, F. A. B. (1998). A mathemaitical model of the impact of crack-cocain use on the prevalence of HIV/AIDS among drug users. Mathematical and Computer Modelling, 28, 21–29. doi:10.1016/S0895-7177(98)00095-8
- Cattadori, I. M., Boag, B., & Hudson, P. J. (2008). Parasite co-infection and interaction as drivers of host heterogeneity. International Journal for Parasitology, 38, 371380. doi:10.1016/j.ijpara.2007.10.004
- Center for Substance Abuse Treatment. (2005a). Medication-assisted treatment for opioid addiction in opioid treatment programs. Treatment improvement protocol (TIP) Series 43. HHS Publication No. (SMA) 12-4214. Rockville, MD: Substance Abuse and Mental Health Services Administration.
- Center for Substance Abuse Treatment. (2005b). Medication-assisted treatment for opioid addiction in opioid treatment programs.
- Chang, L., Alicata, D., Ernst, T., & Volkow, N. (2007). Structural and metabolic brain changes in the striatum associated with methamphetamine abuse. Addiction, 102(1), 16–32. doi:10.1111/j.1360-0443.2006.01782.x
- Cox, F. E. G. (2001). Concomitant infections, parasites and immune responses. Parasitology, 122, S23S38.
- Day, C., & Gray, A. (2008). Health and related indicators: Indicators. South African Health Review, 1, 239–395.
- Farai, N., Musekwa, H., & Senelani, D. (2010). From heroin epidemics to methamphetamine epidemics: Modelling substance abuse in a South African province. Mathematical Bio- Sciences, 225(2), 132–140. doi:10.1016/j.mbs.2010.03.002
- Jamison, D. T., Feachmen, R. G., Makgoba, M. W., Bos, E. R., Baingana, F. K., Hofman, K. J., & Rogo, K. O. (editors). (2006). Disease and mortality in Sub-Saharan Africa (2nd ed.). Washington D.C: World Bank.
- Kalechstein, A. D., Newton, T. F., & Green, M. (2003, Spring). Methamphetamine dependence is associated with neurocognitive impairment in the initial phases of abstinence. The Journal of Neuropsychiatry and Clinical Neurosciences, 15(2), 215–220. doi:10.1176/jnp.15.2.215
- Kalichman, S. C., Washington, C., Kegler, C., Grebler, T., Kalichman, M. O., Cherry, C., & Eaton, L. (2015). Continued substance use among people living with HIV-hepatitis-C Co- infection and receiving antiretroviral therapy. Substance Use & Misuse, 50(12), 1536–1543. doi:10.3109/10826084.2015.1023451
- Kalula, A. S., & Nyabadza, F. (1998). A theoretical model for substance abuse in the presence of treatment. South African Journal of Science, 108(3–4), 1–129.
- Kirkpatrick, G. M., Gunderson, W. E., R Frances, L., Foltin, W. R., & Hart, L. C. (2012). Acute and residual interactive effects of repeated administrations of oral methamphetamine and alcohol in humans. Psychopharmacol, 219, 191–204. doi:10.1007/s00213-011-2390-5
- La Salle, J. P. (1976). The stability of dynamical systems. SIAM, 25. doi:10.1137/1.9781611970432
- Livingston, M., & Callinan, S. (2015). Underreporting in alcohol surveys: Whose drinking is underes- timated? Journal of Studies on Alcohol and Drugs, 76(1), 158–164. Available from 10. 15288/jsad.2015.76.158
- Mendelson, J., Jones, R., Upton, R., & Jacob, P. (1995). Methamphetamine and ethanol interactions in humans. Clinical Pharmacology and Therapeutics, 57, 559–568. doi:10.1016/0009-9236(95)90041-1
- Merz, F. (2018). World Drug Report 2018. United Nations Office on Drugs and Crime(UNODC). SIRIUS-Zeitschrift for Strategische Analysen, 2(1). 85–86. De Gruyter Oldenbourg.
- Mposo, N. Tik and alcohol leading problems in WCape. Retrieved from https://www.iol.co.za/news/crime-courts/tik-and-alcohol-leading-problems-in-wcape-1334219
- Mulone, G., & Straughan, B. (2009). A note on heroin epidemics. Mathematical Biosciences, 218, 138–141. doi:10.1016/j.mbs.2009.01.006
- Naresh, R., & Tripathi, A. (2005). Modelling and analysis of HIV-TB Co-infection in a variable size population. Mathematical Modelling and Analysis, 10, 275286. doi:10.3846/13926292.2005.9637287
- NIDA. (2018). National Institute on Drug Abuse, Cigarettes and other tobacco products. Available from http://www.drugabuse.gov/infofact/tobacco.html
- NIH. (2018). Alcohol's effects on the body. National Institute on Alcohol Abuse and Alcoholism (NIAAA). Available from https://www.niaaa.nih.gov/alcohol-health/alcohols-effects-body
- Nordahl, T. E., Salo, R., & Leamon, M. (2003). Neuropsychological effects of chronic methamphetamine use on neurotransmitters and cognition: A review. The Journal of Neuropsychiatry and Clinical Neurosciences, 15(3), 317–325. doi:10.1176/jnp.15.3.317
- Nyabadza, F., & Hove-Musekwa, S. D. (2010). From heroin epidemics to methamphetamine epidemics. Modelling substance abuse in a South African Province. Mathematical Biosciences, 225, 132–140. doi:10.1016/j.mbs.2010.03.002
- Nyabadza, F., Njagarah, J. B. H., & Smith, R. J. (2013). Modelling the dynamics of crystal meth (’Tik’) abuse in the presence of drug-supply chains in South Africa. Bulletin of Mathematical Biology, 75(1), 24–48. doi:10.1007/s11538-012-9790-5
- Orwa, T. O. (2014). Modelling alcohol and methamphetamine co-abuse in the Western Cape Province of South Africa. Stellenbosch: Stellenbosch University, Stellenbosch University. Available from http://scholar.sun.ac.za/handle/10019.1/3783
- Parry, C., Pluddemann, A., Steyn, K., Bradshaw, D., Norman, R., & Laubscher, R. (2005). Alcohol use in South Africa: Findings from the first demographic and health survey (1998). Journal of Studies on Alcohol, 66(1), 91–97. doi:10.15288/jsa.2005.66.91.
- Pawlowski, A., Jansson, M., Skold, M., Rottenberg, M. E., & Kallenius, G. (2012). Tuberculosis and HIV co-infection. PLoS Pathogens, 8(2), E1002464. doi:10.1371/journal.ppat.1002464
- Petney, T. N., & Andrews, R. H. (1998). Multiparasite communities in animals and humans: Frequency, structure and pathogenic significance. International Journal for Parasitology, 28, 377393. doi:10.1016/S0020-7519(97)00189-6
- Pluddemann, A., Parry, C., Cerff, P., Bhana, A., Harker, N., Potgieter, H., Gerber, W., & Johnson, C. (2012). Monitoring alcohol and drug abuse trends in South Africa (July 2012-December 2012). SACENDU Research Brief. Mathematical Biosciences, 11.
- Probst, C., Shuper, P. A., & Rehm, J. (2017). Coverage of alcohol consumption by national surveys in South Africa. Availble from Addiction, 112(4), 705–710. doi:10.1111/add.13692
- Ramlagan, S., Peltzer, K., & Matseke, G. (2010). Epidemiology of drug abuse treatment in South Africa. SAJP, 16(2), 40–49.
- Roeger, L. I. W., Feng, Z., & Castillo-Chavez, C. (2009). Modeling TB and HIV co-infections. Mathematical Biosciences and Engineering, 6(4), 815–837. doi:10.3934/mbe.2009.6.815
- Samanta, G. P. (2011). Dynamic behaviour for a nonautonomous heroin epidemic model with time delay. Journal of Applied Mathematics and Computing, 35(1–2), 161–178. doi:10.1007/s12190-009-0349-z
- Samanta, G. P., & Sharma, S. (2012). Dynamic behaviour for heroin epidemic models. In M. B. Guthrie & B. M. Wooten (Eds.), Heroin: Pharmacology, effects and abuse prevention (pp. 51–91). New York: Nova Science Publishers, Inc.
- SANCA. (2018). Rehabilation programs offered. Sanca Western Cape. Available from http://sancawc.co.za/out-patient-programme/
- Sharma, S., & Samanta, G. P. (2015). Analysis of a drinking epidemic model. International Journal of Dynamics and Control, 3(3), 288–305. doi:10.1007/s40435-015-0151-8
- Sharomi, O., & Gumel, A. B. (2008). Curtailing smoking dynamics: A mathematical modeling approach. Applied Mathematics and Computation, 195(2), 475–499. doi:10.1016/j.amc.2007.05.012
- Siphokazi, D., Harker, B. N., Jodilee, E., Charles, P., Arvin, B., Furzana, T., & David, F. (2017). Monitoring alcohol,tobacco and drug use trends in South Africa (July 2016-December 2016). SACENDU Research Brief. Mathematical Biosciences, 20(1). Retrieved from http://www.mrc.ac.za/sites/default/files/attachments/2016-10-06/SACENDUBriefJune2016.pdf
- Slater, H. C., Gambhir, M., Parham, P. E., & Michael, E. (2013). Modelling co-infection with malaria and lymphatic filariasis. PLoS Computational Biology, 9(6), E1003096. doi:10.1371/journal.pcbi.1003096
- Stockwell, T., Donath, S., Cooper-Stanbury, M., Chikritzhs, T., Catalano, P., & Mateo, C. (2004). Under-reporting of alcohol consumption in household surveys: A comparison of quantity- frequency, graduated-frequency and recent recall. Addiction, 99(8), 1024–1033. doi:10.1111/j.1360-0443.2004.00815.x.
- UNODC. (2005). Foundation for a Drug-free World. A world epidemic of addiction. Available from http://www.drugfreeworld.org/drugfacts/crystalmeth/a-worldwide-epidemic-of-addiction.html.
- UNODC, World Drug Report. (2013). United nation publication sales no. E Vol.12. Retrieved from http://www.unodc.org/unodc/en/data-and-analysis/WDR-2013.html.
- van Den Driessche, P., & Watmough, J. (2002). Reproduction numbers and sub-threshold endemic equilibrium for the compartmental model of disease transmission. Bioscience, 180, 29–48.
- Vellios, N. G., & Van Walbeek, C. P. (2018). Self-reported alcohol use and binge drinking in South Africa: Evidence from the national income dynamics study, 2014-2015. South African Medical Journal, 108(1), 33–39. doi:10.7196/SAMJ.2017.v108i1.12615
- White, E., & Comiskey, C. (2007a). Heroin epidemics treatment and ODE modelling. Mathematical Biosciences, 208, 312–324. doi:10.1016/j.mbs.2006.10.008
- White, E., & Comiskey, C. (2007b). Heroin epidemics, treatment and ODE modelling. Mathematical Biosciences, 208(1), 312–324. doi:10.1016/j.mbs.2006.10.008
- WHO. (2018). Management of substance abuse. World Health Organization. Retrieved from http://www.who.int/substance_abuse/facts/en/