
ABSTRACT
East Asia is home to some of the most dynamic economies on earth, but also a locus of current and historical national and international conflicts. Some of the largest economies lack domestic energy resources, and nuclear power has been adopted as a perceived key to energy security. Lacking, however, is a concerted strategy for managing nuclear spent fuel at the regional or even, for the most part, national levels. Regional cooperation on spent fuel management offers many benefits, as well as challenges. This two-part paper explores four different “scenarios” of regional spent-fuel management, ranging from a national “go-it-alone” option to regional cooperation on uranium supply, enrichment and “back-end” spent fuel management. Results for physical flows of nuclear materials and other inputs and outputs, and for the relative costs of each scenario, are presented. Results suggest that the costs of scenarios that include reprocessing are higher than those without reprocessing, and costs for increased dry-cask storage (reducing the amount of fuel stored in high-density spent fuel pools) are likely to be a tiny part of overall nuclear fuel cycle costs. As result radiological risk and attendant political, social and legal concerns should drive decisions regarding spent fuel management, not costs.
Introduction and Background
This two-part paper provides an update of our analysis of scenarios for nuclear fuel cycle cooperation in East Asia within the context of three different nuclear energy paths for the nations of the region. Part I, below, provides an introduction to the energy and, specifically, nuclear energy and nuclear spent fuel issues in the region, describes the methods used to evaluate combined future nuclear fuel cycle “paths” and cooperation scenarios, and summarizes the results of those evaluations with respect to physical flows of nuclear materials and costs. Part II, which will be published in Volume 2, Issue 1 of J-PAND, provides a brief description of the energy security analysis methods applied to the path/scenario combinations described in Part I, and the results of those analyses, and also provides a discussion of the implications of the combined analyses on nuclear fuel cycle policy in the region and potential international cooperation on fuel cycle management.
The energy and, by extension, nuclear energy and nuclear spent fuel management situation in East and particularly Northeast Asia is a mix of both shared and unique problems and approaches among a group of very different countries.
Energy demand in the mature Japanese economy is not growing, and perhaps decreasing, as Japan’s population continues aging and begins to decline. The Fukushima accident has led Japan, more than any other nation, to rethink its national energy priorities. How that rethink will affect nuclear power and spent fuel management in the medium- and long-term is not yet clear. The reconsideration of Japan’s energy future, however, has already had a remarkable impact on deployment of renewable energy, and, to perhaps a lesser extent, energy efficiency. These developments, coupled with ongoing and long-planned electricity market liberalization, may shake up Japan’s energy sector in unexpected ways, in large part through their effect (together with that of the nuclear shut-down) on the finances of the large utility companies that dominate the energy sector, and their relationship with government. In Japan, significant growth in the nuclear energy sector, apart from restarting existing reactors – and there remains uncertainty as of this writing as to timing and to how many reactors will be restarted – seems unlikely.
Both energy demand and nuclear generation capacity in the Republic of Korea (ROK) continue to grow, but at a decreasing rate. Very large-scale additional deployment of new reactors in the ROK now seems unlikely, due to a combination of limited remaining available reactor sites and the social and political difficulties associated with siting new plants.
Japan and the ROK share several conundrums. First, both are highly dependent on energy imports, which was a key driver of the development of nuclear energy in the first place. Second, both are running out of at-reactor spent fuel pool space to store spent nuclear fuel. Third, both are hamstrung by a combination of laws and regulations, and by local opposition, with regard to siting of alternative at-reactor dry cask spent fuel storage. In addition, a lingering commitment among nuclear industry actors inside and outside of government to reprocessing in Japan, and to a not-yet-allowed (by the United States) variant of reprocessing, called pyroprocessing, in the ROK, also acts to slow movement toward a sustainable spent fuel management solution.
China faces different issues. With significant resources of its own, though not enough to fuel its massive economic growth, its energy imports are increasing, but are not yet at the above 90% level of total energy use that is the case in the ROK and Japan. China’s nuclear sector is young by comparison to Japan and the ROK, but growing fast, as most of the reactors built worldwide are being built in China. With a large land area and a not-yet-powerful civil society sector, siting of nuclear plants and spent fuel facilities is not yet a major problem for China, though it may grow to be so in the future. China’s use of many different kinds of reactors, ordered and funded by different provinces, and only loosely coordinated with power grid development, may prove to be problematic soon, and may complicate nationally coordinated management of spent fuel.
Added to this mix are:
Taiwan (Chinese Taipei), also suffering from a lack of storage space for spent fuel at its three operating reactor sites, embroiled in a contentious domestic argument over whether to revive work on a long-stalled (but nearly complete) fourth reactor complex (Lungmen), and facing difficulties in developing alternatives for spent fuel storage similar to those in Japan and the ROK (see, for example Word Nuclear Association (Citation2017a));
Mongolia, rapidly becoming a large exporter of coal and metals to (mostly) China, and with a large, open land area and a nuclear weapons-free zone status that, some have argued, may make it a potential host for a regional nuclear facility (though many Mongolians say otherwise);
Russia, and specifically, the lightly populated Russian Far East (RFE), with very limited current nuclear capacity (a few small reactors based on nuclear icebreaker technology), but proposals for large reactors. The RFE would like to export oil, gas and electricity to the major markets of the region, and has started to do so, albeit not to the extent that has been projected for many years; and
The Democratic Peoples’ Republic of Korea (DPRK), which physically stands in the way of overland gas and electricity exports from Russia to the ROK, and whose relationship with its neighbors and the international community in general – specifically regarding its nuclear weapons program, but in many other ways as well – adds considerations to nuclear plans in the ROK and Japan. At the same time, however, the desperate situation of the DPRK’s energy sector, and the DPRK’s desire to address its energy issues, may offer opportunities to catalyze energy cooperation in the region.
Potential nuclear energy users in the broader East Asia and Pacific region, including Indonesia, Vietnam and Australia, although each has a history of varying levels of political enthusiasm for nuclear power.
Safeguarding Nuclear Spent Fuel
One goal shared by all nuclear nations – if not with equal levels of concern among governments, groups and individuals – is the securing of radioactive materials from release during accidents or attacks, including terrorist attacks, on nuclear facilities. Here a key distinction is between spent fuel stored in spent fuel pools and in dry casks, the two major ways that spent fuel is stored pending the development of long-term storage or disposal facilities.
Spent fuel pools are deep pools of circulating water, typically adjacent to and/or contiguous with nuclear reactor containment buildings, in which irradiated fuel removed from the reactor core is cooled, usually for at least 5 years but often longer, before being moved to other storage facilities or being reprocessed to separate plutonium and uranium from other components of the fuel.
Dry-cask storage typically encases fuel elements in a sealed metal canister from which water has been removed, and which has been filled with an inert gas. The metal canister is then placed in a concrete and/or steel overpack, creating a massive (tens of tons), robust package.
Dry-cask storage of spent fuel appears much less vulnerable to release of radiation through accident or attack than storage of fuel in spent fuel pools. Release of radiation from fuel stored in dry casks essentially requires a concerted effort targeted specifically at the dry cask to not only break it open – requiring high explosives that detonate essentially on the cask or physically drilling into the cask, requiring proximity of attackers – but to ignite the spent fuel assemblies stored in the cask. Zircaloy-clad fuel assemblies in dense-racked spent fuel pools, on the other hand, can ignite if water from the pool is lost, as dense-racked pools lack the ability to passively release sufficient heat through the air when coolant is lost, leading to rising temperatures and, eventually, ignition of fuel cladding, resulting in releases of radioactivity. Most of the spent fuel pools in use in Northeast Asia today (and in many other places, including the United States) use dense-racking systems to conserve space in spent fuel pools, due to a lack of alternatives for spent fuel storage/processing/disposal.
Overall, the countries of the complex and varied East Asia/Pacific region share many (but not all) energy sector problems, and although cooperation on energy sector and nuclear sector (and other) issues has not generally been the hallmark of international relations in the region, cooperation may, in fact, bring mutual benefits, as discussed later in this paper.
Summary of Overall Northeast Asia Energy/Nuclear Energy/Energy Policy Situation
Over the past two decades, economic growth in East Asia – and particularly in China, the Republic of Korea (ROK), Vietnam, Taiwan and Indonesia – has rapidly increased regional energy requirements, especially electricity needs. Although economic growth slowed in much of the region during the global recession of 2008–2010, and electricity demand in Japan declined in the aftermath of the accident at the Fukushima reactor following the March, 2011 Great East Japan earthquake, overall growth in demand for electricity in the region continues. As a recent, eye-opening example of these increased needs, China added over 100 GW of generating capacity – which was more than the total generation capacity in the ROK as of 2010 – in each of the years between 2012 and 2016 alone (National Bureau of Statistics of China Citation2017). Despite increasing (and increasingly successful) efforts to boost hydroelectric and other renewable generation, the majority of the capacity China has added annually in recent years has continued to be coal-fired, underlining concerns regarding the global climate impacts of steadily increasing coal consumption.
With the difficult lessons of the “energy crises” of the 1970s in mind, several of the countries of East Asia – starting with Japan in the mid-1970s, and continuing with the ROK, Taiwan, and, in the early 1990s, China – have sought to diversify their energy sources and bolster their energy supply security, as well as achieving other policy and social objectives, by developing nuclear power. Several other East Asian nations are currently discussing adopting nuclear power as well, if not, like Vietnam, taking concrete steps toward developing their own nuclear facilities. At the same time, global security concerns related to terrorism and to the nuclear weapons activities of the Democratic People’s Republic of Korea (DPRK), Pakistan and India as well as the (nominally peaceful) uranium enrichment programs pursued by Iran and, as revealed publicly in 2010, the DPRK, have focused international concern on the potential for proliferation of nuclear weapons capabilities associated with nuclear power. Reducing the potential for proliferation is, in a sense, a part of nuclear disarmament, as it is the means by which the international community can avoid the production of nuclear weapons arsenals in the first place. In addition, old concerns regarding the management of nuclear spent fuel and other wastes, including the safety and long-term implications of various means of spent fuel management and/or disposal, as well as the siting of spent fuel facilities, remain, at best, only partially addressed.
One means of addressing proliferation concerns, reducing environmental and safety risks of nuclear power, and possibly modestly reducing the costs of nuclear energy to the countries of the region, is regional cooperation on nuclear fuel activities. A number of proposals for regional cooperation on safety, enrichment, spent-fuel and waste management and other issues have been offered over the years, some from within the region, and some from outside the region (see below). The net impact, however, of regional nuclear cooperation on energy security – expressed broadly to include supply security, economic impacts, environmental security and security related to social and military risks – requires a more detailed look at how cooperation on nuclear power might be organized and operated. Working with a network of collaborating teams in nine countries of the region, we defined several different scenarios for nuclear fuel cycle cooperation in East Asia, evaluated those scenarios under different sets of assumptions regarding the development of nuclear power in the region. These evaluations of the physical flows of nuclear fuel cycle materials and services, and of the costs of different elements of the fuel cycle, help to shed light on the relative readily quantifiable costs and benefits of different regional fuel cycle cooperation options. At least as important, however, are the relative impacts of different fuel cycle options on other aspect of (broadly defined) energy security, which can be evaluated qualitatively.
East Asia and the Pacific includes three nuclear weapons states – including the United States based on its physical proximity and jurisdiction over several Pacific territories, as well as its geopolitical and cultural importance in the region – plus one (the DPRK) that has been nuclear-armed since 2006. The region also includes three major economies that are nearly completely dependent on energy imports and for which nuclear energy plays a key role, a nuclear materials supplier nation currently without commercial reactors of its own, and at least two populous and fast-developing nations with stated plans to pursue nuclear energy. provides a summary of the status of major nuclear fuel-cycle activities in each country covered by the analysis summarized here. To this listing can be added Mongolia, which has significant uranium resources and a history of uranium production and exploration during Soviet times. Though Mongolia has no other active commercial nuclear facilities, its involvement in regional nuclear fuel cycle activities related to uranium supply has been proposed (see, for example Agvaanluvsan (Citation2009) and Miller (Citation2012)). Mongolia’s status as a nuclear weapons-free state, a process begun in 1992 and recently (2012) formalized through recognition by the five permanent members of the United Nations Security Council (see, for example Kimball (Citation2012)), also potentially makes it an interesting “player” in nuclear weapons and nuclear energy policy in the region, though when one of the authors of this paper visited Mongolia, the officials he talked with seemed less than enthusiastic about Mongolia’s participation in nuclear activities, and indicated that recent stated Mongolian energy policies omit nuclear power and related endeavors.
Table 1. Summary of nuclear energy activities in East Asia/Pacific countries.
Current Status of Electricity Consumption and Nuclear Generation
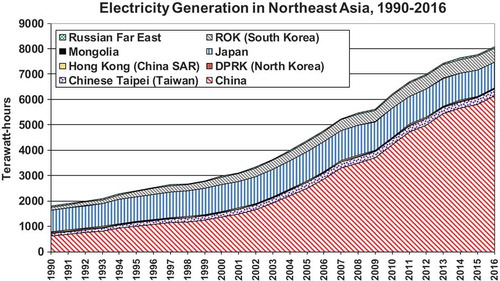
Footnote1Footnote2Footnote3 Footnote4 Recent growth in electricity generation and use in East Asia has been remarkable. As an example, shows total electricity generation in the Northeast Asia region more than tripled between 1990 and 2016, with generation in China increasing by nearly a factor of 10, generation in Taiwan increasing by a factor of nearly three, and generation in the ROK increasing by a factor of 4.7. Even though electricity production in Japan – which in 1990 had the highest generation in the region – grew by only 19% (an average of 0.7% annually), the fraction of global generation accounted for by the Northeast Asia region grew from just over 15% in 1990 to over 32% in 2016, even as electricity generation in the rest of the world grew at an average rate of 2.0% annually. As notable as this increase in overall consumption and of the fraction of the world’s electricity has been in Northeast Asia, the last few years have seen a decline in electricity generation in Japan, a leveling-off of generation in the ROK, and even, between 2014 and 2016, a decline to just over 4% average annual growth in reported generation in China, though previous years (2009–2014) saw annual increases in generation in China in the 6–13%/year range.
Figure 1. Electricity generation in Northeast Asia, 1990–2016.
Sources: Data from British Petroleum “Statistical Review of World Energy 2017” workbook (BP Citation2017) for all countries except the DPRK (based on updated Nautilus Institute results not yet publishedFootnote6), Mongolia (based on data from USDOE/EIA (Citation2018) and other sourcesFootnote7) and RFE (estimated from paper by Gulidov and Ognev (Citation2007)). Generation figures shown are for gross generation (that is, including in-plant electricity use), except for Mongolia and the RFE.
Footnote5Against this backdrop of growth in electricity needs – existing “business as usual” projections call for continuing strong increases in electricity use in the countries of East Asia (with the possible exception of Japan) – many of the countries of the region face significant energy resource constraints. The industrialized economies of Taiwan, the ROK and Japan import over 90% of their energy needs. Vietnam and Indonesia, though they have been net energy exporters for several decades, are at or near the point where they will become net importers. China, though endowed with large reserves of coal and significant oil and gas reserves, is obliged to meet the energy needs of an increasingly affluent 1.3 billion people, and the economy that sustains them. As a result, China is increasingly an energy importer as well. The sparsely settled Russian Far East has a vast resource endowment – including hydraulic energy, coal, oil and natural gas – that could potentially be harnessed for export to its neighbors. A combination of severe climatic conditions, politics and huge financial requirements for the infrastructure needed to accomplish oil, gas and power exports have slowed development of these resource sharing schemes. Even massive international pipelines and powerlines, however, will only make a modest contribution to the energy needs of Russia’s energy-hungry neighbors (see, for example von Hippel and Hayes (Citation2008)).Footnote Footnote
The resource constraints faced by most of the nations of the region, together with the technical allure of nuclear power, have made East Asia a world center for nuclear energy development, and – news reports of a global nuclear renaissance notwithstanding – one of the few areas of the world where significant numbers of nuclear power plants are being added. Nations have chosen nuclear power because they wish to diversify their energy portfolios away from fossil fuels (especially oil) and thus improve their energy supply security, because nuclear power provides a stable sources of baseload power with low air pollutant emissions (particularly compared with coal), and for the less practical but still significant reason that being a member of the nuclear energy “club” is seen as offering a certain level of status in the international community.
Previous Proposals for Nuclear Fuel Cycle Cooperation in East Asia
Regional (East Asia), and indeed, global nuclear fuel cycle cooperation proposals have been offered by a number of groups and individuals over the past two decades and earlier. Below we provide brief descriptions of selected prior proposals. Other authors have reviewed these and other proposals in greater detail than is possible here (for example Yudin (Citation2009, Citation2011), Suzuki (Citation1997), Tanabe and Suzuki (Citation1998)).
Interest in regional/international spent fuel/radioactive waste storage/disposal increased significantly in the 1970s and the early 1980s. In 1977, the IAEA reported that regional fuel cycle centers were feasible and would offer considerable nonproliferation and economic advantages. In 1982, the IAEA concluded a project of the International Fuel Cycle Evaluation (INFCE) in which IAEA expert groups suggested an establishment of international plutonium storage and international spent fuel management (Bunn et al. Citation2001).
In the mid-1990s, the concept of the International Monitored Retrievable Storage System (IMRSS) was proposed by Wolf Hafele. The IMRSS envisioned international sites where spent fuel, and possibly also excess separated plutonium, could be stored under monitoring for an extended period but could be retrieved at any time for peaceful use or disposal (Hafele Citation1996).
In the mid-1990s through the late 1990s, a number of proposals for nuclear power sector cooperation in the Asia-Pacific region, on topics ranging from safety to proliferation to waste management, were developed. Suzuki (Citation1997) prepared a comparison of various proposals for regional nuclear cooperation offered during the period and concluded that there are potential areas of cooperation where common needs and interests exist among the countries of Northeast Asia. At present, however, none of these proposals have been implemented to a significant degree.
The past decade has seen a number of additional proposals for cooperation on uranium enrichment, management of nuclear spent fuels, or both, many involving East Asian and Pacific countries. Brief summarizes of just some of the cooperation proposals on international enrichment and/or low-enriched uranium (LEU) fuel supply and spent fuel management that have come forth in the last 10 years or so follow (Suzuki and Katsuta Citation2009).
The Global Nuclear Energy Partnership (GNEP), proposed by the United States during the George W. Bush administration (in 2006), had as its enrichment component a proposal to establish a group of enriched fuel supplier states, and a requirement that those states provide enriched fuel to nonsupplier nations at a reasonable cost, while reducing the potential for proliferation of sensitive technologies, in part through cooperation with the IAEA on nuclear safeguards (Tomero Citation2008). GNEP proposed coupling these fuel supply guarantees and with spent fuel “take back” arrangements. GNEP has been recast as the International Framework for Nuclear Energy Cooperation (IFNEC), which “is a partnership of countries aiming to ensure that new nuclear in initiatives meet the highest standards of safety, security and nonproliferation”, and “involves both political and technological initiatives and extends to financing and infrastructure” (World Nuclear Association Citation2016).
The International Uranium Enrichment Center (IUEC) and LEU Nuclear Fuel Bank, was proposed by Russia in 2006, and initiated by Russia shortly thereafter. The concept is for Russia to host the IUEC at its existing Angarsk Electrolytic Chemical Combine (Loukianova Citation2008). Membership in the enrichment center, intended to be on an “equal and nondiscriminatory basis”, requires charter states to forego developing their own enrichment facilities, and be in compliance with their nonproliferation obligations (including membership in the Treaty on the Non-Proliferation of Nuclear Weapons). Reserves of LEU were placed at Angarsk in late 2010, and the IUEC Agreement went into force in early 2011, after which “the LEU reserve in Angarsk has been available for IAEA Member States”, constituting “the first proposals on nuclear fuel supply assurances to have been put into practice” (IAEA Citation2011).
In 2006, NTI (the Nuclear Threat Initiative) pledged $50 million toward an International Fuel Bank to be run by the IAEA. Since then, $100 million in matching contributions have been pledged by other countries. Similar to the Russian proposal, but not affiliated with a specific enrichment center, the goal of the Fuel Bank concept by NTI “… is to help make fuel supplies from the international market more secure by offering customer states, that are in full compliance with their nonproliferation obligations, reliable access to a nuclear fuel reserve under impartial IAEA control should their supply arrangements be disrupted. In so doing, it is hoped that a state’s sovereign choice to rely on this market will be made more secure” (NTI Citation2009, Citation2010; Horner Citation2010). The IAEA is siting the LEU repository at a remote site in Kazakhstan, at a metallurgical factory with existing storage infrastructure, and “inaugurated” the site in August of 2017. IAEA member states voted in favor of the fuel bank in late 2010 (NTI Citation2017).
In April of 2007, Germany proposed to the IAEA the creation of a multilateral enrichment facility, established by a group of interested states, to be placed in a host states but on an “extraterritorial basis” (Rauf and Vovchok Citation2007). Like the Russian proposal, and similar to the Fuel Bank NTI proposal, the facility would help assure supplies of enriched fuels to nations that qualify based on adherence to their nonproliferation treaty commitments and related IAEA safeguards (IAEA Citation2007).
The so-called “Six-Country” Proposal of a Nuclear Fuel Assurance Backup System, offered in 2006 by the enriched fuel supplier nations France, Germany, the Netherlands, Russia, the United Kingdom and the United States, proposed that enrichment suppliers would substitute enrichment services for each other to cover supply disruptions for enriched fuel consumers that have “chosen to obtain suppliers on the international market and not to pursue sensitive fuel cycle activities”. Further, the proposal would provide “physical or virtual” reserves of LEU fuel for use in the event that other fuel assurances fail (UNIDIR Citation2009).
Also in 2006, Japan proposed an IAEA Standby Arrangements System for the Assurance of Nuclear Fuel Supply. This system would be managed by the IAEA and would offer information, provided voluntarily by nuclear fuel supplier countries, on the status of uranium ore, reserves, conversion, enrichment and fuel fabrication in each country. The goal of this system is to help prevent disruption in international fuel supplies by acting as a kind of “early warning” system of impending supplier shortfalls for states purchasing fuel or fuel services. If a disruption in supply takes place, under this system, the IAEA acts as intermediary in helping a consumer country find a new supplier country (Rauf and Vovchok (Citation2007) and Yudin (Citation2009)).
In the 1990s, a commercial group called Pangea was looking for an international geologic repository for both spent fuel and radioactive wastes. Envisioning a facility for disposing of 75,000 MT heavy metal of spent fuel/HLW, Pangea initially selected Australia for its proposed repository, but is seeking other sites around the world after confronting political opposition in Australia (Bunn et al. Citation2001).
During the late 1990s to the early 2000s, two proposals involving depository sites in Russia were presented. One was a concept of the Nonproliferation Trust (NPT) that called for establishing a dry cask storage facility in Russia that would accept 10,000 MT heavy metal of spent fuel from abroad, and would include eventual spent fuel disposal. The other was a concept offered by MINATOM (Ministry for Atomic Energy of Russia) that suggested a plan for an international spent fuel service involving offering temporary storage with later return of the spent fuel, or reprocessing of spent fuel without return of plutonium or radioactive wastes for customer countries (Bunn et al. Citation2001).
In 2003, El Baradei (Citation2003) suggested multinational approaches to the management and disposal of spent fuel and radioactive waste. In 2005, commissioned at Dr. M. El Baradei’s suggestion in 2003, the IAEA published a report on Multilateral Approaches to the Nuclear Fuel Cycle in which the IAEA concluded that such approaches are needed and worth pursuing, on both security and economic grounds (IAEA Citation2005).
In January 2006, Russian President Vladimir Putin announced a Global Nuclear Power Infrastructure (GNPI) initiative to provide the benefits of nuclear energy to all interested countries in strict compliance with nonproliferation requirements, through a network of international nuclear fuel cycle centers (INFCC). INFCC are conceived as being related to the provision of enrichment services and to spent fuel management issues through the provision of reprocessing and the disposal of residual waste within the framework of INFCC, under IAEA safeguards (Ruchkin and Loginov Citation2006).
In 2008, Suzuki and Katsuta (Citation2009) proposed the idea of an “International Nuclear Fuel Management Association (INFA)” as a multilateral nuclear fuel cycle approach. The central principles of the INFA are universality, meaning avoiding discrimination between nuclear “haves” and “have nots”, transparency, meaning that the IAEA “Additional Protocol” or equivalent safeguards arrangements should be applied for all facilities, and demand should come first before supply, and economic viability, meaning that the activities of the Association should be consistent with global nuclear fuel market activities, and that the economic rationale of the Association should be clearly defined to support nuclear fuel cycle programs.
The Northeast Asia Peace and Cooperation Initiative, an ROK-led process that proposes to address several (often interrelated) topics of mutual concern to the countries of the region, one of which is “nuclear safety”, through a gradual, stepwise process (see, for example Lee (Citation2014) and MOFA (Citation2015)). The Initiative is notable in that explicitly seeks to include the DPRK, but it does not yet seem to have articulated specific goals or proposals for regional nuclear fuel cycle collaboration.
Methods and Key Modeling Assumptions and Inputs
In order to the estimate the relative costs and benefits of nuclear fuel cycle cooperation in the East Asia region, the following analytical approach was taken. What is presented here is necessarily a condensed description of the methods and data used. Additional details of assumptions used in the analyses described here are available in the printouts provided in Appendix 3 in the Supplementary Material to this paper.
Our analysis of nuclear fuel cycle cooperation scenarios in East Asia includes four major steps:
Preparation of three nuclear energy “paths” for each nation through the year 2050. These paths, embedded in the overall economy and electricity generation future of each nation, correspond to “BAU”, or business as usual/reference case paths, “MAX”, or maximum plausible nuclear deployment and “MIN”, for minimum likely nuclear build-out. The underpinnings of each path in each nation were taken from a variety of source, including energy sector modeling carried out under previous projects by teams of colleagues from the countries of the region, existing national publications and international compendia of nuclear sector plans, most notably those of the World Nuclear Association. For each nuclear path and for each country, estimates were prepared of capacity by type of plant and by year, output of electricity by year, requirements for nuclear fuel and production of nuclear spent fuel. A summary of the nuclear paths by country is provided below.
Preparation of nuclear cooperation scenarios. Four different international cooperation scenarios were developed based in part on previous proposals for regional fuel cycle cooperation in Northeast and East Asia, as well as on assumptions rooted in discussions between the authors and colleagues in the region. Brief definitions of the nuclear cooperation scenarios developed are provided later in this section.
Evaluation of the physical and cost flows associated with pairs of nuclear energy paths and nuclear cooperation scenario (3 paths times × 4 cooperation scenarios, or 12 total pairs). We developed an Excel workbook allowing the calculation by country of the physical flows (for example uranium ore/uranium metal, uranium enrichment, energy and water inputs, transport of nuclear materials, production of nuclear wastes and requirements for nuclear materials storage) and costs (for example purchase of uranium and enrichment services, transport costs, reprocessing costs and disposal costs) for each of the following aspects of the nuclear fuel cycle:
Uranium mining and milling;
Uranium transport and enrichment;
Nuclear fuel fabrication and transport; and
Reprocessing and spent fuel management.
Assessment of the relative energy security costs and benefits, both quantitative and qualitative, of selected nuclear path/cooperation scenario pairs, as presented in Part II of this article.
Brief summaries of methods and key assumptions associated with each of these steps are provided below.
Nuclear Energy Paths
Plans for nuclear generation capacity development are made in the context of developing overall plans for meeting national demand for energy services – specifically, energy services provided by electricity. To make sure that nuclear energy paths occur in context, we base our nuclear capacity paths on models of energy system development through at least 2030 in each of the nine countries. With the exception of the DPRK – for which energy paths are based on work by the authors – we in many cases based the nuclear paths described below on electricity forecasts and related electricity sector development paths included in models prepared by collaborating groups in each country. To facilitate the work of the collaborating groups, they were each asked to develop a “Business as Usual” (BAU) nuclear path, based on recent trends and/or government plans for the nuclear power sector, “Maximum Nuclear” (MAX), in which they were asked to estimate the most nuclear capacity that could reasonably be developed in the country through 2030 and “Minimum Nuclear” (MIN), in which country teams were asked to identify the minimum capacity that seemed plausible to be developed through 2030. For the purposes of evaluating regional nuclear cooperation scenarios, all of which involve the commitment to organizations and infrastructure that would persist well beyond 2030, nuclear capacity and output data for each country were roughly extrapolated to 2050. Extrapolations were performed using existing projections for nuclear capacity expansion by site where available, as well as by continuing trends of expansions through 2030. Details of the assumptions used to drive the three paths in each nation are provided in Appendix 1 in the Supplementary Material to this paper. In many cases, these assumptions update work done by researchers in the region (see, for example, von Hippel et al. (Citation2010)).
The three nuclear energy paths per country serve as the basis for estimating nuclear fuel cycle parameters – ranging from requirements for uranium ore through requirements for spent fuel management, as well as inputs, outputs and costs of fuel cycle activities. The three paths drive a range of possible results for consideration as policymakers choose directions for nuclear energy policy.
Regional Nuclear Fuel Cycle Scenarios to 2050
The authors and our colleagues developed four nuclear fuel cycle scenarios, each with components related to the “front end” (fuel provision/enrichment) and “back end” spent-fuel management/reprocessing of the cycle. Many of the components used in these scenarios have commonalities with or draw from the regional and international proposals reviewed briefly above. Though some of these scenarios call for regional facilities, the proposals are generic in terms of where – both in terms of nations and in terms of particular sites – shared facilities would be located. Particular sites and nations are not identified because there are a large number of different possible configurations of sites, too many to consider meaningfully here, including, in some cases, either having a single centralized set of facilities or multiple distributed facilities. Further, it is not our purpose in paper to look at the particular countries or sites as hosts, rather to explore the general energy security costs and benefits of different physical and institutional nuclear fuel cycle options. Clearly there are current legal and/or political constraints – local, national and sometimes international – to almost any regional nuclear initiative (and many national ones) but given the timelines and energy/environmental imperatives involved, it is conceivable that some of the constraints could eventually be relaxed through explicit or de facto changes in policy, or worked around, in the future. Some of the constraints faced for likely host countries are discussed later in this paper.
The descriptions below update earlier analyses of four cooperation “scenarios” for nuclear fuel enrichment and for spent fuel management. These generic scenarios borrow many concepts from earlier enrichment and spent-fuel management cooperation proposals, some of which are summarized above. Each scenario includes specific assumptions by country for each of several fuel-cycle “nodes”: uranium mining and milling, uranium transport, uranium conversion and enrichment, fuel fabrication, transportation of fresh reactor fuel, electricity generation, spent fuel management (including reprocessing), spent fuel transport, and permanent disposal of nuclear wastes. Key attributes of the scenarios are as follows – see Appendix 2 in the Supplementary Material to this paper for further detail of these scenarios:
“National Enrichment, National Reprocessing”: In this scenario the major current nuclear energy users in East Asia (Japan, China and the ROK), and perhaps others as well, each pursue their own enrichment and reprocessing programs. Disposal of high-level nuclear wastes from reprocessing would be up to each individual country, with attendant political and social issues in each nation. Security would be up to the individual country, and as a result, transparency in the actions of each country is not a given.
“Regional Center(s)”: This scenario features the use of one or more regional centers for enrichment and reprocessing/waste management, drawn upon and shared by all of the nuclear energy users of the region. We avoid identifying particular country hosts for the facilities, but China and Russia are obvious candidates.
“Fuel Stockpile/Market Reprocessing”: Here, the countries of the region purchase natural and enriched uranium internationally, but cooperate to create a fuel stockpile that the nations of the region can draw upon under specified market conditions. Reprocessing services are purchased from international sources, such as France’s AREVA or from Russia, while some spent fuel continues to be stored in nations where nuclear generation is used.
“Market Enrichment/Dry Cask Storage”: In this, likely the least expensive of the four scenarios for participants, countries in the region (with the possible exception of China) would continue to purchase enrichment services from international suppliers such as URENCO in Europe, USEC Inc. (USEC is now a subsidiary of Centrus Energy Corp) in North America, and in Russia. All spent fuel, after cooling in ponds at reactor sites, would be put into dry cask storage either at reactor sites or at intermediate storage facilities.
Cooperation on nuclear fuel cycle activities could take place between all of the countries of East Asia and the Pacific, or a narrower group of several countries within the region, or a broader group of countries that could include nations outside the region. At their least demanding (in terms of costs and institutional arrangements between nations), cooperation options can involve relatively modest types of activities such as straightforward scientific, educational and technical exchanges or collaborations – for example, through the International Atomic Energy Agency (IAEA) or other international agencies – on sharing of information on nuclear “best practices”. More complex options include consortiums for purchasing of raw uranium or of enriched fuel. More complex still are arrangements to share enrichment and spent-fuel management facilities. An IAEA Expert Group in 2005 produced a generic review of multilateral approaches to the nuclear fuel cycle, and some of that group’s observations and suggestions are reflected in the proposals by other groups summarized above, as well as in the regional cooperation scenarios elaborated and evaluated in this paper (IAEA Citation2005).
These scenarios are not by any means intended to exhaust the universe of possible nuclear fuel cycle cooperation (or noncooperation) options for the region. We believe that these scenarios do, however, represent a reasonable range of the different options that could be adopted.
Calculation of Nuclear Fuel Cycle Inputs, Outputs and Costs
By using the three nuclear power expansion path cases, we assess the relative costs and benefits of the four cooperation scenarios under a range of different nuclear capacity/energy production “conditions” to see which scenarios are more attractive at what levels of nuclear power adoption – taking into account parameters like existing reprocessing and spent fuel management capacities in the region, as well as issues such as management of nuclear fuel cycles for potential new members of the nuclear energy “club” in the region (Vietnam, Indonesia, North Korea and – less likely – Australia). Over a timeline of 2000–2050, simple stock and flow accounting is used to generate annual estimates of major required inputs to and outputs of the nuclear reactor fleet in each country, and of other nuclear facilities such as enrichment and reprocessing facilities. For each path and each cooperation scenario, we track key physical parameters such as the amounts of Uranium fuel (in tonnes of ore and metal) and enrichment capacity needed (in separative work units, or SWU) and quantities of spent fuel to be managed (in tonnes of heavy metal – or tHM) through each step in the transport and transformation of nuclear materials. The fuel cycle nodes modeled are uranium mining and milling, uranium transportation and enrichment, fuel fabrication and reactor fuel transport and reprocessing and spent fuel management. Key inputs at each (applicable) node include the mass of uranium (in various forms) and plutonium, energy, enrichment services, transport services and money, accounted for by country and by year. Key outputs at each node include uranium and plutonium, spent UOx (uranium oxide) and MOx (mixed oxide) fuel, and major radioactive waste products, again by country and year. Costs are presented and calculated in approximately 2009 constant (real) US dollars, except where noted.
Using this approach, quantitative results for 12 different regional cooperation scenario and nuclear power development path combinations were generated.
Many of the parameters incorporated in the analysis described here are uncertain, with the future costs of nuclear materials and facilities perhaps the most uncertain. As such, numerous assumptions informed by a variety of literature sources were used in this analysis. See the online materials accompanying this paper for selected inputs and assumptions used for in the nuclear fuel cycle analysis a summary of some of the key assumptions used in the analysis is as follows:
Uranium Cost/Price: $48.20/kgU in 2017 (Cameco Corporation Citation2017), escalating at 5.5%/year through 2035 as demand increases and inventories are used up in the near term, and at 3.5% per year thereafter through 2050. Note that these prices are indicative of spot market prices. Long-term prices, associated with uranium purchased under long-term contracts, have historically been about $25 more per kgU than spot market prices. This projection serves as a “medium” scenario, but uncertainties are, as noted, substantial. Just in the last decade, uranium prices “spiked” in 2007 at over $260/kg, fell to about the $120/kg level by 2009–2010, rose again in early 2011, then began to fall, particularly after the Fukushima accident, with continued decline, on average (though not in every year) over 2012 through September 2017 to about $48 per kg, due to an international glut in uranium production and inventories. As alternative projections of uranium prices, we prepared a “High” projection that assumes 7.3% average annual growth through 2035, and 5% average growth per year thereafter, and a “Low” projection case below, we assume an increase in uranium costs of 3.0% annually through 2020 from the current (2017) very low U prices, and a modest 0.50% annual real increase in uranium costs thereafter.Footnote8 It might be considered reasonable to pair the different projections of uranium prices with the different nuclear energy development paths, as we have done for enrichment prices (see below). We have decided against doing so, however, because it seems likely that uranium supply can respond to different levels of demand much more quickly than can enrichment capacity. We thus use the medium uranium price projection for all four scenarios of cooperation and for all three nuclear energy capacity paths, but use alternative price projections to prepare sensitivity analyses.
Average uranium (U) concentration in ore purchased from international market sources: 2.8%. Note that this estimated average, based mostly on 2016 output data, is heavily influenced by the uranium concentration of a single highly productive mine in Canada with an ore concentration of on the order of 20%. Excluding this mine, the global average U concentration in ore is slightly less than 0.1%, though in practice uranium concentrations in ore vary widely (World Nuclear Association Citation2017f).
Thirty percent of the enriched uranium from the international market was produced in gaseous diffusion plants in 2007, with the remainder in centrifuge-based plants, but all enrichment was sourced from centrifuge-based plants by 2014 as gaseous diffusion capacity, mostly the Paducah plant in Kentucky in the United States, was retired (this is roughly consistent with information in World Nuclear Association (Citation2017g)). Although some enriched uranium will continue to be sourced from highly enriched uranium from retired nuclear weapons, and it is possible that some laser enrichment will begin to be used in the international market, we assume that centrifuge-based plants will effectively continue to be the predominant supplier of enriched uranium for East Asia through 2050.
Enrichment costs have fallen by well over 50% in the last 5 years, from about $160/kg per separative work unit (SWU) in 2008 through early 2010 to about $72 per kg in 2015, and to about $40 in the first two-thirds of 2017, likely as a result of the combination of the global economic recession and the impacts on the nuclear industry of the Fukushima accident. The retirement of the (expensive) gaseous diffusion plant in the US may also have played a role in reducing enrichment costs. We assume, for the BAU nuclear generation capacity expansion case, that costs per SWU rise at 2.0% annually in real terms from the 2017 level, meaning that real 2050 costs per SWU will be substantially lower than they were at the cost peak in 2008/2009. Since the MAX nuclear capacity expansion case results in higher demand for SWU, we assume that the costs per SWU will rise faster than for BAU capacity expansion, at an average rate of 3.0% annually. Conversely, a low rate of nuclear generation capacity expansion reduces SWU demand, so we assume a 1.0% annual real escalation of costs per SWU from (very low) 2017 levels is associated with scenarios in based on the MIN capacity expansion case. Associating particular enrichment cost trajectories with specific nuclear capacity expansion/use scenarios is admittedly a modeling decision in and of itself, and one that can be questioned. If the region being modeled represented a smaller part of the current and expected market for enrichment, then one could justifiably argue that world SWU market prices should be largely independent of changes in nuclear generation in the region. In this case, however, the converse is true, and changes in the region are likely to have a large impact on enrichment demand. The supply of enrichment services, on the other hand, is arguably fairly inelastic, as enrichment plants are expensive and take a long time to plan, site, and build. Still, over a 30-plus year time horizon one might expect more enrichment to come on line and affect international prices. Sensitivity analysis can be used to examine the impacts of different enrichment price trajectories on different combinations of scenarios and nuclear capacity paths.
Raw uranium transport costs are set at roughly container-freight rates.
The cost of U3O8 conversion to UF6 (uranium hexafluoride, which is processed by enrichment plants) is $14/kg U.Footnote9
The cost of UOx fuel fabrication is $270/kg heavy metal (HM, meaning uranium and plutonium).Footnote10
The cost of MOx fuel blending and fabrication is $1800/kg heavy metal (Bunn et al. Citation2003). Note that this cost, as with other costs for fuel cycle facilities that either do not yet exist or for which no recently constructed examples exist, is likely to be highly uncertain. For example, if estimates of the eventual construction costs ($7.7 billion) for the now-canceled Mixed Oxide Fuel Fabrication Facility (MFFF) at the Savannah River site in the United States (U.S. Department of Energy, Citation2014) can be taken as a guide (an arguable point), the implied annualized capital costs alone, not including any running costs, would be over $100,000 per kg of MOx fuel per year.Footnote11 At that level, MOx fuel fabrication costs would be a significant fraction of overall nuclear fuel cycle costs.
The fraction of plutonium (Pu) in (fresh) MOx fuel is 9.5% (from World Nuclear Association (Citation2017k); MIT (Citation2003) cites a 7% Pu content for MOx).
Spent fuel transport costs by ship are about $40/tHM-km (OECD/NEA Citation1994).
The cost of reprocessing is $1200/kg HM (MIT Citation2003) except in Japan, where it is $3400/kg HM based on the costs of the existing Rokkasho plant,Footnote12 and in China where it is about $2770/kg HM based roughly on a proposed reprocessing project in China.Footnote13 For the purposes of this analysis, we assumed that spent MOx fuel would not be reprocessed.Footnote14
The effective average lag between placement of nuclear fuel in-service (in reactors) and its removal from spent fuel pools at reactors is 8 years.
The cost of treatment and disposal of high-level wastes is $150/kg HM reprocessed, the mass of Pu separated during reprocessing is 11 kg/t HM in the original spent fuel, and the cost of storage and safeguarding of separated plutonium is $3000/kg Pu-yr (OECD/NEA Citation1994).
The average capital cost of dry casks (for UOx or MOx spent fuel) is $0.8 million/cask and the operating cost of dry cask storage is $10,000 per/cask-yr.Footnote15
The cost of interim spent fuel storage (total) is $360/kg HM placed in storage, and the cost of permanent storage of spent fuel is assumed to be $1000/kg HM placed in storage (based roughly on OECD/IEA (Citation1994). Permanent storage, however, is not implemented, and its costs are not charged, in any of the scenarios above by 2050.
The annual cost of storing cooled spent fuel, including both UOx and MOx spent fuel, in pools is $11,700 per tHM.Footnote16 Note that this cost does not apply to spent fuel before it has cooled, as costs for at-reactor cooling for 8 years are assumed to be part of reactor operating and maintenance costs.
Results
Future Nuclear Capacity and Generation Paths
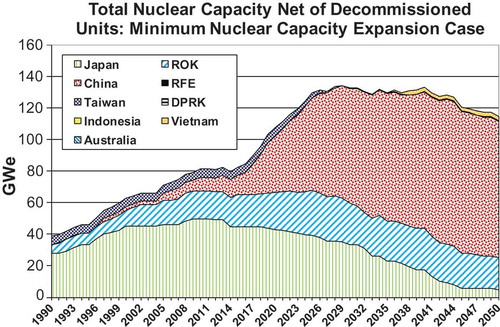
and summarize the nuclear capacity included for each the three nuclear capacity expansion paths (Business as Usual, Maximum Nuclear and Minimum Nuclear) for each country for the years 2010, 2030 and 2050. – show the capacity trends by year and country if all nations follow each of the three paths, though in practice it is likely that the nations of East Asia and the Pacific will not all choose the same one of the three paths described, thus the capacities in these three figures shown could be thought of as an approximate bounding of a wide range of potential combinations. In fact, the internal and external conditions that would cause each country to adopt a “MAX” or “MIN” (or BAU) path vary by country, although some trends toward the extremes could be driven by international events (for example another Fukushima-like event) or agreements (for example nuclear fuel cycle cooperation that reduces tensions and increases citizen confidence in nuclear power) with impacts in many nations of the region.
Table 2. Regional nuclear generation capacity, summary of BAU, MAX and MIN paths.
Table 3. Regional nuclear electricity output, summary of BAU, MAX and MIN paths.
Figure 2. Trends in regional nuclear generation capacity, BAU path.
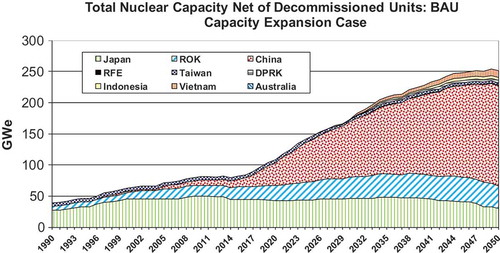
Figure 3. Trends in regional nuclear generation capacity, sum of national MAX paths.
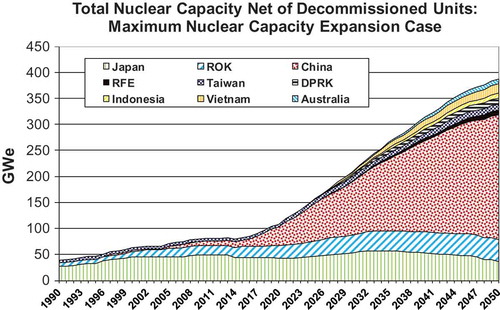
Figure 4. Trends in regional nuclear generation capacity, sum of national MIN paths.
Key assumptions by country used to determine nuclear capacity and output for the other nations of East Asia and the Pacific are presented in Appendix 1 in the Supplementary Material.
Spent Fuel Management Cooperation Scenario Results
Results for the spent fuel management cooperation scenarios described above are provided in this section of this paper. These results update previous work on the topic.
Uranium Production and Enrichment
Over the period from 2000 through 2050, the countries of East Asia and the Pacific included in this study are projected to use a cumulative 1.45–1.54 million tonnes of natural uranium (as U) in the BAU capacity expansion case, with usage under Scenario 4 about 7% higher than in Scenarios 1 and 2. Producing these quantities of uranium will require the extraction of about 65 (Scenarios 2–4) to 270 million tonnes (Scenario 1)Footnote17 of uranium ore, with extraction in Scenario 1 being much higher because more of the ore is mined domestically (mostly in China), rather than being sourced from higher-grade Canadian (and other) deposits. As large as these figures seem, they are dwarfed by the annual volume of coal extracted in China alone in a single year – over 3.4 billion tonnes in 2016 (BP Citation2017), although of course Chinese coal-fired power plants generated on the order of 10 times as much power during 2016 than did all of the reactors in the region combined. This comparison is, of course, inexact, because coal ash and other wastes have different disposal attributes and environmental impacts – and thus costs for disposal – than do uranium tailings. Milling the uranium needed for reactors in the region will require about 1.4–1.5 billion cubic meters of water over the period from 2000 through 2050 with BAU-case capacity expansion, which, to put the level of resource use in perspective, is about half of one day’s discharge of water from the Yangtze River to the ocean, or about a tenth of annual domestic water use in Japan.
The enrichment services requirements for the BAU paths across scenarios are about 36–37 million kg SWU in 2050 in Scenarios 1–3, and nearly 40 M kg SWU for Scenario 4 (which includes no MOx use). For the MAX generation capacity expansion path, needs rise to about 66 M SWU/yr in 2050 in scenarios without substantial MOx use, and are about 8–12% less in scenarios with MOx use. For the MIN path, requirements are about 15–18 million SWU in the 2020s, falling slowly (on the strength of continued lower growth in the Chinese nuclear sector offset by declines elsewhere in the region) to 16 million SWU in 2050.
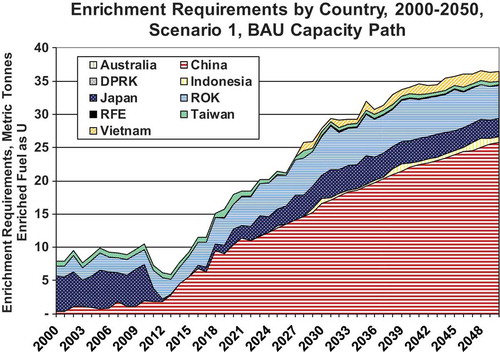
Under Scenario 1, additional enrichment capacity in the countries of the region will be required under all nuclear capacity expansion paths, though under the MIN path Japan’s maximum annual SWU demand (2025–2029) is quite close to the reported eventual full capacity (1.5 million SWU/yr) of the Japan Nuclear Fuel Ltd (JNFL) commercial enrichment plant at Rokkasho (World Nuclear Association Citation2017j). Under other scenarios, global enrichment capacity as the World Nuclear Association (Citation2017g) projects it to be in 2020 (66.7 M kg SWU/yr) would need to be expanded to meet 2050 regional plus out-of-region enrichment demand under the BAU or MAX expansion paths. Under the MAX expansion path and Scenario 1, China alone would need to build additional new enrichment capacity by 2050 approximately equal to about half of projected year 2020 global capacity. Under the MIN expansion path, however, international enrichment facilities extant as of 2020 are likely sufficient to meet regional and out-of-region demand without significant expansion, assuming existing facilities (or replacement facilities) continue to operate. summarizes the required regional volume of enrichment service required, both in-country and out-of-country (that is, from regional or international facilities), for the period from 2000 through 2050 for each of the four scenarios. shows enrichment requirements over time by country. Though the ROK and Japan account for almost all enriched uranium needs pre-Fukushima, the rapid growth of China’s nuclear power sector and the slow process of restarting Japan’s reactors means that China’s demand for enrichment will outstrip needs in the rest of the region well before 2020.
Figure 5. Requirements for enriched Uranium by scenario, adjusted for MOx use, BAU nuclear capacity expansion path.
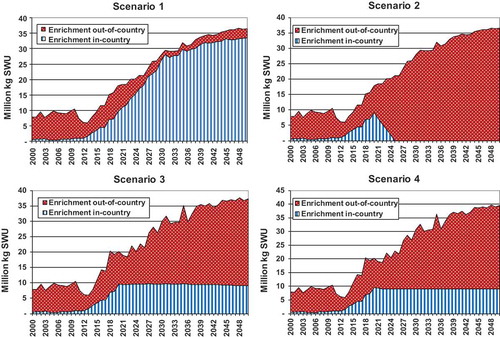
Figure 6. Requirements for enriched Uranium by country, Scenario 1, adjusted for MOx use, for the BAU nuclear capacity expansion path.
Spent Fuel Management
The increase in production of spent fuel has implications for the sufficiency of space for storage of spent fuel at reactors (spent fuel pools) and other facilities. In Scenario 1 under the BAU nuclear capacity expansion path, Taiwan (Chinese Taipei), Japan and the ROK will require new spent fuel storage capacity by the early 2020s. This need for spent fuel capacity could come sooner in the ROK and possibly Japan, depending on whether spent fuel pools remain dense-racked, and the extent of reactor restart and the timeline for starting the Mutsu dry cask storage facility in Japan. For the latter, see, for example Takase and von Hippel (Citation2017). New storage may be needed by the mid-2030s in China. By 2050, in the BAU case, storage, disposal or reprocessing for about 4200–4400 tHM of cooled uranium oxide (UOx) spent fuel will need to be added annually, with nearly two-thirds percent of that requirement in China alone. An additional 200 or more tHM of cooled MOx spent fuel will also need to be placed in storage in some scenarios. In the absence of regional cooperation on spent fuel management, the countries of East Asia, and in particular Japan, the ROK and China, will in the next 10–20 years need to begin opening a large amount of out-of-reactor-pool spent fuel storage or disposal space, or develop the same equivalent amount of storage space in reprocessing facilities (or a combination). This result is based, as noted above, on the assumption that new reactors will (mostly) be designed with 15 years of spent fuel storage capacity. Though it may be that new nuclear plants will be designed with larger spent fuel pools, the tendency to build larger spent fuel pools may be tempered by consideration of the risks of at-reactor pool storage of large quantities of spent fuel, particularly when, as in many existing plants in Northeast Asia (and elsewhere), spent fuel pools are “dense packed” with fuel rod assemblies. These risks were underscored by the damage to spent fuel in pool storage that occurred during the Fukushima Daiichi Plant accident in Japan starting in March 2011. Given the recent history of public opposition to new nuclear sites in Japan and the ROK, one would expect the process of developing new storage/disposal/reprocessing facilities to be difficult. China, with more lightly populated areas than the ROK or Japan, and less of a tradition of civic involvement in security and environmental issues, may find an easier path to siting such facilities. On the other hand, in the 20 years between now and when China will need such facilities, and given the recent trend of a growing civil society voice in key issues, spent fuel management facilities may also become progressively harder to site in China as well. This trend is indicated, for example, by 2016 protests over siting of a reprocessing facility in the city of Lianyungang (Stanway Citation2016), which resulted in suspension of work on the plant.
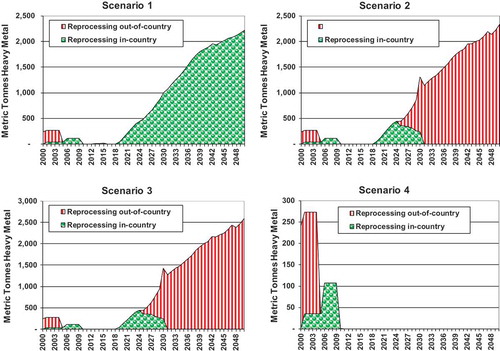
summarizes the region-wide use of reprocessing over time in each of the four scenarios. A similar amount of reprocessing takes place in each of Scenarios 1–3, rising to 2200 tonnes of heavy metal or more annually by 2050, but reprocessing in Scenario 1 takes place mostly in the countries of the region, while in Scenarios 2 and 3 reprocessing is mostly done either outside the region, or in shared reprocessing facilities in the region. In Scenario 4, as a result of the scenario assumptions, no reprocessing takes place after about 2010. Note that the scale in the graph for Scenario 4 is much smaller than the scale in the other three panels of . Combinations of active reprocessing programs and high or medium growth in nuclear generation capacity yield large, though transitional, inventories of plutonium – on the order of 60–90 tonnes. For example, Scenario 1 coupled with the “BAU” capacity expansion path produces a Pu inventory of 91 tonnes by 2040, but a third of that inventory is used in MOx fuel by 2050, given Scenario 1 assumptions. Pu stocks in any given year are exquisitely sensitive to assumptions as to when and how much MOx fuel is used, relative to when and how much reprocessing takes place. Several scenario/path combinations actually result net negative plutonium stocks regionwide in the last 2–4 years of the modeling period (ending in 2050), implying that Pu from other international separation programs – or, perhaps, conversion of plutonium originally produced for weapons – would be used to produce MOx fuel in those few years (and/or MOx fuel use would be decreased). Given the assumptions above, the MIN capacity expansion paths result in ever-increasing inventories of Pu in Scenarios 1–3, with some scenarios implying inventories of over 170 tonnes by 2050. Plutonium inventories remain at about 53 tonnes in all Scenario 4 capacity variants from about 2015 on. Placed in perspective, in almost all years any of these quantities of Pu are sufficient that diversion of even a few hundredths of 1% of the total regional stocks would be enough to produce one or more nuclear weapons.
Figure 7. Region-wide quantities of spent fuel reprocessed by year by scenario, BAU nuclear capacity expansion path.
Spent Fuel Production
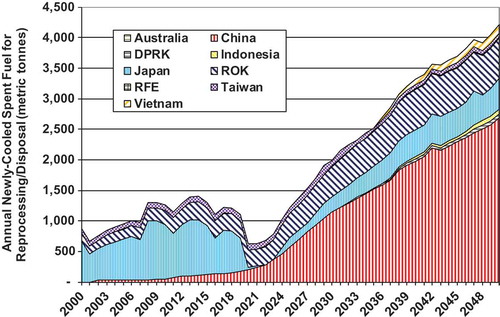
summarizes cooled spent fuel (UOx fuel only) production by country in Scenario 1 for the BAU capacity expansion path. By 2050, an annual volume of somewhat over 4200 tonnes of spent fuel regionwide will be cooled and ready for storage, reprocessing or disposal. In Scenarios 1–3, an additional 230 or more tonnes per year of MOx spent fuel will be cooled and require further management – but likely somewhat different management than UOx fuel, due to its different radiological properties – in 2050, with all cooled MOx fuel coming from Japan, China, and the ROK. Note, in , that the dip in cooled spent fuel production corresponds to the very low (or zero) capacity factors for nuclear power in Japan in the aftermath of the Fukushima accident. The actual cooled spent fuel production in the mid-to-late 2020s may be even lower, as the capacity factors used in this study for the post-Fukushima years in Japan may prove to be overstated.
Figure 8. Production of cooled spent UOx fuel by year and by country, Scenario 1 and BAU nuclear capacity expansion path.
Relative Costs of Scenarios
Along with the inputs to and outputs of nuclear fuel cycle facilities, the estimated costs of key elements of the nuclear fuel cycle have been evaluated for each combination of scenario and nuclear capacity expansion path. In general, though not in every case, “levelized” costs have been used, expressed, for example, on a per-tonne-heavy metal processed basis, to include a multitude of operating and maintenance as well as capital costs, often for very long-lived facilities. In other cases market trends in prices have been extrapolated, for example, for uranium prices and enrichment services, while providing for the option of modeling different price trends. All costs in the figures in this section are provided in 2009 US dollars. The figures below focus on the results of the BAU nuclear capacity expansion path. As with other parameters, cost estimates are in many cases by their very nature quite speculative, as they often specify costs for technologies that have not yet been commercialized (permanent waste storage, for example), or are commercialized but practiced in only a few places in the world (reprocessing and high-level waste vitrification, for example), or are subject to regulatory oversight with the potential to considerably change costs, or for which specific costs were not immediately available for this analysis (such as most nuclear materials transport costs). As such, the costs estimates provided here should be taken as indicative only, for use primarily in comparing regional scenarios.
Not yet included directly in the cost analysis for the scenarios and paths summarized here are the costs of nuclear generation, apart from fuel-related costs. These costs have been omitted (capital costs and O&M costs, for example) in analyses thus far because a full comparison of different nuclear paths also requires inclusion of the capital costs of other electricity generation sources and of other methods of providing energy services (such as energy efficiency improvements) that might be included in a given energy sector development path for a given country. We have, however, prepared a rough estimate of total nuclear generation costs, apart from the fuel-cycle costs presented in detail here, and those costs are presented for order-of-magnitude comparison purposes below. It should be noted, however, that using MOx fuel in some of the region’s reactors will require modifications in reactor design and operation that will vary in cost by plant, but will likely be in the range of tens of millions of dollars in capital costs and tens of millions of dollars in annual operations costs, per reactor (see, for example Williams (Citation1999)). These costs would accrue to scenarios with substantial MOx use, but not to scenarios where reprocessing (and MOx use) is avoided.
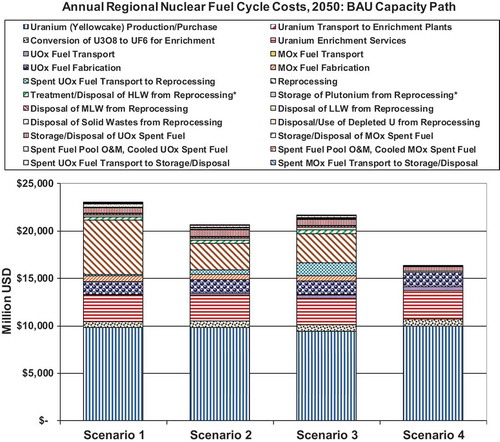
Highlights of the cost results summarized as annual costs in 2050 for the BAU path () include:
Uranium mining and milling costs for the region (modeled as U3O8 purchase costs) are estimated at $9.4–$10.0 billion per year by 2050, with the inclusion of reprocessing in Scenarios 1–3 reducing costs only modestly (2–6%) relative to Scenario 4. It should be remembered that the BAU scenario uses a “Medium” international price trajectory for uranium, under which cost per kgU returns to near the historical (but transient) high price spike of 2007, in real terms, by 2050. Use of a lower uranium price forecast would substantially lower estimated mining and milling/purchase) costs.
Natural uranium transport costs, at an estimated 2–6 million dollars per year in 2050, are a negligible fraction of overall costs.
Uranium conversion costs range from 660 to 720 million dollars per year by 2050 for the countries of the region.
Uranium enrichment costs for the region are about 30% of mining and milling costs, at an estimated at $2.7–$3.0 billion per year by 2050, with the inclusion of reprocessing in scenarios again reducing costs only modestly. As noted above, enrichment costs, like uranium costs, have been historically volatile – decreasing by a factor of three between 2009 and 2016 alone – so use of a higher price trajectory could substantially increase this cost, relative to the medium enrichment price scenario (returning to only 2015 price levels by 2050) reflected in these results.
UOx fuel fabrication costs are estimated at $1.4–$1.5 billion annually by 2050.
Though the quantity of MOx fuel used is much lower than that of UOx fuel, MOx fabrication costs are estimated at about $580–$590 million annually by 2050 in Scenarios 1–3 where MOx is used.
Reprocessing costs range from about $2.8 to $5.7 billion per year in those Scenarios (1–3) that feature reprocessing, with Scenario 1, with more (and more expensive) reprocessing in Japan having the highest reprocessing costs, but with Chinese reprocessing costs also significant.
Treatment of high-level wastes from reprocessing adds $330–$390 million per year to the costs of Scenarios 1–3, with treatment of medium-level, low-level and solid wastes from reprocessing, and of uranium separated from spent fuel during reprocessing (less uranium used for MOx fuel) adding an aggregate $190–$230 million per year to costs by 2050.
Plutonium storage costs range from $160 to $240 million/year in 2050, with those scenarios that result in higher Pu inventories by 2050 (those where Pu is not in part used up in MOx fuel) showing higher costs for that year.
Interim storage of nonreprocessed spent fuels (and of MOx fuel), in Scenarios 1–3, has estimated costs in 2050 of $820 million to $1.0 billion per year. In Scenario 4, using dry-cask storage, estimated costs in 2050 are about $550 million per year, or somewhat lower, though the amount of spent fuel being handled in Scenario 4 includes the fuel that would otherwise have been sent to reprocessing in the other scenarios. Estimated costs for transportation of spent fuel in are about $100 million annually in 2050 in Scenario 1, about $220–$250 million/year in Scenarios 2 and 3, and zero in Scenario 4 (due to the assumption of that on-site dry cask storage is used.
Figure 9. Annual regional nuclear fuel cycle costs in 2050.
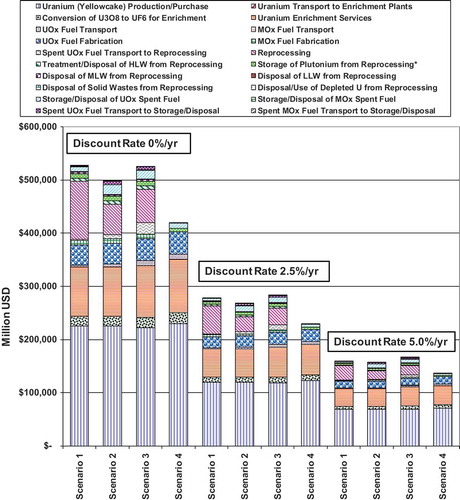
Overall, the conclusion from the above – similar to the conclusion that a number of other researchers have reached using per-unit costs (not from regional scenarios), is that reprocessing of spent fuel results in much higher costs–higher by on the order of $4–7 billion per year (about 26–41%), region-wide, in 2050 – than using dry-cask storage and avoiding reprocessing of spent fuel, as shown in . shows net present value costs from 2010 through 2050 (calculated with three different discount rates) for the nuclear fuel cycle elements. Scenarios 1–3 yield total costs that are about 15–22 (at a discount rate of 5.0%/year) to 19–28% (at a zero discount rate) higher overall than in the least expensive scenario (Scenario 4). The absolute cost difference between scenarios declines somewhat as the discount rate used increases. Results at three different real discount rates are shown to reflect a range of potential perspectives as to the time value of money in nuclear investments. Present interest rates in Japan, for example, are near zero (and in the negative range in real terms as recently as 2016). In addition, one could argue that as investments with decidedly intergenerational implications, nuclear fuel cycle costs should be evaluated with a near-zero, zero, or even negative discount rate (see, for example Hellweg, Hofstetter, and Hungerbühler (Citation2003)).
Figure 10. Net present value of regional nuclear fuel cycle costs.
Cooperation Scenario Costs in Context
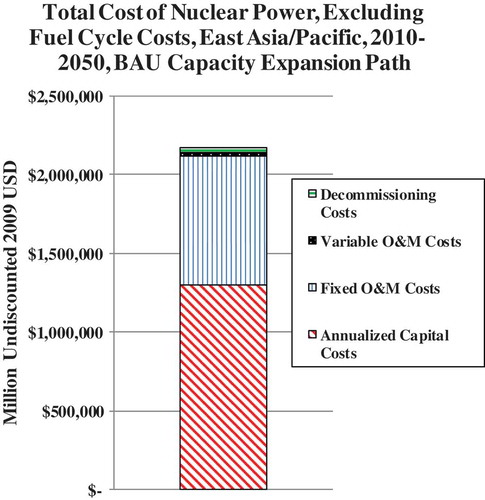
Although significant, nuclear fuel cycle costs are only a portion of the overall costs of nuclear generation. In order to gauge the magnitude of fuel cycle costs relative to other costs, we prepared a rough estimate of the overall costs of nuclear power in each of the countries of the region over the period from 2010 through 2050. shows our assumptions used in preparing an overall estimate of the costs of nuclear power in the region for major costs excluding fuel-cycle costs, which are covered above. The costs categories included here are capital costs (annualized using a cost recovery factor based on an interest rate of 5%/yr in real terms), annual fixed (O&M) operating and maintenance costs, variable (nonfuel-cycle) O&M costs (typically small for nuclear plants), and decommissioning costs. Capital and other costs for nuclear power plants are notoriously hard to estimate, particularly where future costs are involved, but the estimates below generally fall within the range of costs available from various literature sources.Footnote18
Table 4. Nuclear power cost assumptions by country and component.
For the BAU capacity expansion path, as shown in , we estimate the overall regional undiscounted cost of nuclear power in East Asia/Pacific over the period 2010–2050 to be about $2.2 trillion. This figure excludes fuel cycle costs, so the overall regional total cost for nuclear generation is about $2.6–$2.7 trillion including the estimates (at a discount rate of zero) for fuel cycle costs shown for the four cooperation scenarios in . The bulk of the nonfuel cycle costs are annualized capital costs (60%) and fixed O&M costs (37%), with nonfuel variable costs and decommissioning costs making up a much smaller fraction of the total.Footnote19 Total nonfuel nuclear costs if all countries pursue MAX capacity expansion paths are estimated at $2.7 trillion over the same period, versus $1.5 trillion for the MIN capacity expansion path.
Figure 11. Total estimated cost of nuclear power in East Asia/Pacific, excluding nuclear fuel cycle costs.
Overall, the difference between the costs of the four cooperation scenarios – between $75 and $100 billion over the entire region from 2010 through 2050 – represents only a few percent of the overall cost of nuclear power. Given the broad span of time and space over which these estimates are calculated, and the substantial uncertainties in many of the parameters involved, this result suggests that costs should not be the overriding factor in deciding between nuclear fuel cycle options. Rather, parameters that are difficult or impossible to accurately estimate quantitatively, such as the impacts of different fuel cycle options on radiological risks, security of the sector from attack, and/or the responses of local communities to different fuel cycle choices, should be regarded as more significant in informing nuclear fuel cycle policy decisions, as described below.
Cooperation Scenario Results Summary
The results of the regional scenario evaluation above indicate that Scenario 4, which focuses on at-reactor dry cask storage and coordinated fuel stockpiling, but largely avoids reprocessing and mixed-oxide fuel (MOx, that is, reactor fuel that uses a mixture of plutonium reprocessed from spent fuel and uranium and as its fissile material) use, results in lower fuel-cycle costs, and offers benefits in terms of social-cultural and military security. These results are consistent with (and, indeed, draw ideas and parameters from) broader studies by other research groups, including, for example, the joint work by the Harvard University Project on Managing the Atom and the University of Tokyo Project on Sociotechnics of Nuclear Energy.
That said, there are definite trade-offs between scenarios. Scenario 1, by using much more domestic enrichment and reprocessing than the other scenarios, arguably improves energy supply security for individual nations, but results in higher technological risk due to national reliance on one or a small number of enrichment and reprocessing plants, rather than the larger number of largely well-established plants that constitute the international market. Scenario 1 would also raise significant proliferation concerns (not the least of which would be the DPRK’s reaction to ROK enrichment and reprocessing). Scenario 1 also results in the at least transient build-up of stockpiles of plutonium (Pu) in each of the nations pursuing reprocessing. Though the magnitude of the plutonium stockpiles, and the rate at which they are used, varies considerably by nuclear path and scenario, the quantities accrued, ranging up to about 90 tonnes of Pu at a maximum in Scenario 1 by the late 2030s, are sufficient for tens of thousands of nuclear weapons, meaning that the misplacement or diversion of a very small portion of the stockpile becomes a serious proliferation issue, and thus requires significant security measures in each country where plutonium is produced or stored. Scenario 4, without additional reprocessing, maintains a stockpile of about 53 tonnes of Pu from about 2010 on. This still represents a serious proliferation risk, but does not add to existing stockpiles or create stockpile in new places.
Scenarios 1–3, which include reprocessing, result, as noted above, in higher annual costs – about $4–$7 billion per year higher in 2050 relative to Scenario 4 – over the entire region. Scenarios 1–3 reduce the amount of spent fuel to be managed substantially – by 50% or more over the period from 2000 through 2050, relative to Scenario 4 – but imply additional production of more than 20-fold more high-level waste that must be managed instead (thousands versus hundreds of cubic meters). This in addition to medium- and low-level wastes from reprocessing and wastes from MOx fuel fabrication that must be managed in significant quantities in Scenarios 1–3, but not in Scenario 4. Scenarios 1–3 offer a modest reduction – less than 10% in the BAU nuclear capacity paths case – in the amount of natural uranium required region-wide, and in attendant needs for enriched uranium and enrichment services. This reduction is not very significant from a cost perspective unless uranium costs rise much, much higher in the next four decades. The quantities of electricity and fuel used for uranium mining and milling, as well as production of depleted uranium, are generally somewhat lower under Scenarios 1–3 than under Scenario 4, though results for Scenario 1 differ from Scenarios 2 and 3 because of the emphasis on sourcing uranium from domestic mines in the region. shows aggregated front-end (fuel preparation) and back-end (spent fuel management) costs by Scenario and for each of the three nuclear capacity paths for the region.
Figure 12. Summary of year 2050 annual costs by scenario and by nuclear capacity expansion path.
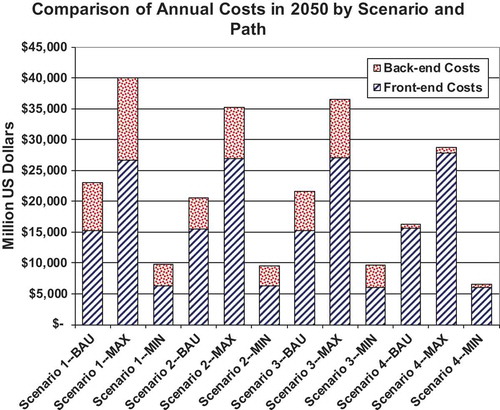
Scenarios 2 and 3, though they include reprocessing, place more of the sensitive materials and technologies in the nuclear fuel cycle in regional and international facilities, and as a consequence, are likely to be superior to Scenario 1 in terms of reducing proliferation opportunities, reducing security costs, and increasing the transparency of (and thus international trust in) fuel cycle activities. The costs of Scenarios 2 and 3 shown in this analysis are not significantly different, overall, from those of Scenario 1, but a more detailed evaluation of the relative costs of nuclear facilities (particularly, enrichment and reprocessing facilities) in different countries, when available, might result in some differentiation in the costs of these three scenarios. Overall, however, although the total costs of the scenarios may vary by several billion dollars per year, it must be remembered that these costs are inconsequential to the overall annual costs of electricity generation in general, and modest even when compared to the cost of nuclear generation alone, as described in section “Relative Costs of Scenarios”. In considering the costs of electricity generation in general in the region, in round terms, if one assumes that the total electricity demand in East Asia in 2050 is on the order of 20,000 TWh, or about three times electricity demand in the countries in the region as of 2011, and that the per-unit total cost of electrical energy at that time is on the order of 10 US cents/kWh (perhaps somewhat greater than the average in the region today, but possibly an underestimate for 2050), then the implied total cost of electricity supplies in 2050 in the countries under consideration in this Working Paper is on the order of $2 trillion per year. The nuclear fuel cycle-related costs considered here are therefore just a percent or so of the total, and the differences between scenarios is a just a small fraction of a percent. Both of these values are easily lost in the margin of uncertainty regarding future power costs.
Scenarios 2 and 3 result in significantly more transport of nuclear materials – particularly spent fuel, enriched fuel, MOx fuel, and possibly high-level wastes – around the globe, likely by ship, than Scenario 1, though there would be somewhat more transport of those materials inside the nations of East Asia in Scenario 1.
The scenarios described and evaluated above have, of necessity, to a certain extent suspended consideration of national and international political and legal constraints in order to focus on alternatives for regional fuel cycle management. It is more than clear, however, that there are substantial legal and political constraints to regional cooperation on nuclear fuel cycles, and that these constraints will either limit the opportunities for cooperation, or need to be overcome in some way, in order to allow regional arrangements to proceed. These constraints include (but are unlikely to be limited to) legal and/or political constraints on regional spent fuel management, enrichment, and integrated facilities. Specific and detailed discussion of these issues is beyond the scope of this paper but will play a crucial role in determining the practicality of specific cooperation schemes, as discussed briefly below.
Discussion
Please see Part II of this paper for a summary of some of the potential benefits and challenges of nuclear fuel cycle cooperation in East Asia, thoughts on the special case of including the DPRK in nuclear fuel cycle cooperation, explorations of the cost-benefit implications of cooperation scenarios, and descriptions of how the conclusions regarding spent fuel cycle cooperation might interact with other issues related to nuclear power.
Supplemental Material - Appendix
Download MS Word (985.2 KB)Acknowledgments
This paper builds upon the work of a number of colleagues who worked with the authors as a part of Nautilus Institute’s Asian Energy Security and related projects since 2000, and we acknowledge with gratitude their input and insights. The John D. and Catherine T. MacArthur Foundation provided support for much of the work described in this paper, most recently for the Vulnerability to Terrorism in Nuclear Spent Fuel Management Project. In addition, some of David von Hippel’s most recent work on nuclear energy paths in China as reflected in this paper was funded by the Nonproliferation Policy Education Center, Washington D.C.
Disclosure Statement
No potential conflict of interest was reported by the authors.
Supplemental data
Supplemental data for this article can be accessed here: https://doi.org/full/10.1080/25751654.2018.1541874.
Additional information
Notes on contributors
David F. Von Hippel
David F. Von Hippel is a Nautilus Institute Senior Associate based in Eugene, Oregon (USA), working on energy and environmental issues in Asia and elsewhere, as well as extensive analyses of the patterns of fuels use and prospects for energy sector redevelopment in North Korea. In addition to his work with Nautilus, David works and has worked for a number of private and public organizations in the US around the world on topics ranging from utility planning and energy efficiency to planning for reduction of greenhouse gas emissions.
Peter Hayes
Peter Hayes is Honorary Professor, Center for International Security Studies, Sydney University, Australia and Director, Nautilus Institute in Berkeley, California. His main research interests are nuclear weapons, climate change and energy security, particularly in Northeast Asia.
Notes
1 “GWe” and “MWe” denote, respectively, gigawatts and megawatts of electricity generation capacity.
2 This thermal output is the equivalent of approximately 25–30 MWe.
3 World Nuclear Association (Citation2017d). Note that 2010 and 2011 production were substantially lower than the average of over 8000 t U per year in the previous decade (2000–2009), a trend that has continued, with average output and exports post-2011 close to 6000 tU per year.
4 See, for example South China Morning Post (Citation2018).
5 David von Hippel, personal communication with Vietnamese officials. The Vietnamese economy has not performed as well as hoped, and although nuclear plants remain of interest in Vietnam, it appears that the cost of the plants may become more of a barrier to large-scale adoption of the technology. See also: Associated Press (Citation2016).
6 See von Hippel and Hayes (Citation2012) for an earlier version of the updated DPRK electricity generation results used for this figure.
7 Erdenechuluun (Citation2014) (data for 2010–2013), Enebish (Citation2016) (estimates for 2014 and 2015) and Mongolian Statistical Agency (Citation2017).
8 This is the same escalation rate used by a team of MIT researchers in preparing Deutch et al. (Citation2009).
9 The World Nuclear Association (Citation2017h) lists costs for UF6 conversion as of March 2017 as $14 per kg UO2. This is more than twice the cost listed in the earlier study by Deutch et al. (Citation2009).
10 The World Nuclear Association (Citation2017h) lists costs for fuel fabrication as of March 2011 as $240 per kg UO2.
11 This is a very rough calculation, using a discount rate of 5%/yr, a facility lifetime, of 30 years, a Pu use rate for the MFFF of 3.5 tonnes/year (World Nuclear Association (Citation2017k)), and a Pu fraction in MOx fuel of 9.5%.
12 T. Katsuta, personal communications, 2010.
13 The World Nuclear Association (Citation2017i) quotes the cost of one proposed reprocessing project in China as follows: “…Areva-CNNC agreement was signed for the 800 t/yr plant, referencing Areva’s La Hague plant and envisaging a cost of CNY 100 billion ($15.70 billion)”. Assuming a 40-year plant lifetime and an interest rate of 5% annually, and assuming an average capacity factor of 90% plus an adder of 15% to capital cost for interest accrued during construction, for a plant with capacity of 800 tHM per year, this implies an annualized capital cost of $1.05 billion, or $1461 per kg HM processed. Orszag (Citation2007) uses a value of 6% of capital cost as an estimate of annual operations and maintenance costs for a reprocessing facility. This would imply annual operating costs of $0.94 billion annually, for a total levelized capital and O&M costs of $1.99 billion per year, or $2770 per kg HM processed.
14 Although MOx spent fuel has been reprocessed on a limited basis in the past and reprocessing of spent MOx fuel is apparently planned in Japan, reprocessing of MOx does not appear to be common practice, and it is not clear to use whether MOx fuel recycling is likely to become prevalent. See World Nuclear Association (Citation2017k).
15 Capital and operating costs based very roughly on US DOE (Citation1994) and TRW (Citation1993).
16 A recent estimate for the operating costs of spent fuel pools was not immediately available, but an older US study, Rod (Citation1991), lists an average (mean) cost of operating spent fuel pools of $7.41 per kg U-yr, presumably in 1991 dollars or similar, which implies $11.71 per kg U-yr in 2009 dollars.
17 In the MAX capacity expansion case, cumulative 2000–2050 uranium ore extraction is about 510 million tonnes in Scenario 1.
18 The rough estimates shown are based on a variety of literature sources, some country-specific, and some more general. See, for example World Nuclear Association (Citation2017h), Drollette (Citation2014).
19 For simplicity, decommissioning costs were treated as incurred in the first year of decommissioning. This is of course not entirely realistic, as decommissioning costs are typically spread over many years, and projected outlays for decommissioning are often accumulated in advance from ratepayers. Decommissioning costs are much higher in countries with older reactor fleets (especially Japan), but still make up a small part of total nuclear costs.
Related Research Data
References
- Agvaanluvsan, U. 2009. “The Global Context of Nuclear Industry in Mongolia.” Mongolia Today, the Mongolian National News Agency, December 2009. https://fsi.stanford.edu/sites/default/files/AgvaanluvsanMongolia_nuclear_industry.pdf
- Associated Press. 2016. “Vietnam Scraps Plans for its First Nuclear Power Plants.” 10 November 2016. http://bigstory.ap.org/article/544e8f5088b347f0bf71138bf3f1bdb3/vietnam-scraps-plans-its-first-nuclear-power-plants?mkt_tok=eyJpIjoiT0daak56UmtZakZtTXpneCIsInQiOiJkNWxVblNxbXRvVVRCdnd4aldSY3RUa1wva3BLb1wvZTBtTlZFS3UxQll0T0lMZWd0QytxVkdITEFWenVMWTVtWjVtSGpYem8zUmxkekxZZERVcFlTQTUzeExZejArcjhseUVOdG5hODdsRTlzPSJ9
- British Petroleum (BP). 2017. “BP Statistical Review of World Energy June 2017.” Excel file downloaded as “bp-statistical-review-of-world-energy-2017-underpinning-data.xlsx,” from https://www.bp.com/en/global/corporate/energy-economics/statistical-review-of-world-energy.html
- Bunn, M., J. P. Holdren, A. Macfarlane, S. E. Pickett, A. Suzuki, T. Suzuki, and J. Weeks. 2001. “Interim Storage of Spent Nuclear Fuel: A Safe, Flexible, and Cost-Effective Near-Term Approach to Spent Fuel Management.” A Joint Report from the Harvard University Project on Managing the Atom and the University of Tokyo Project on Sociotechnics of Nuclear Energy. June 2001. https://dash.harvard.edu/bitstream/handle/1/29914175/Bunn_Interim-Storage-of-Spent-Nuclear-Fuel.pdf?sequence=1
- Bunn, M., S. Fetter, J. P. Holdren, and B. van der Zwaan. 2003. The Economics of Reprocessing vs. Direct Disposal of Spent Nuclear Fuel: Final Report, 8/12/1999-7/30/2003, Project on Managing the Atom, Belfer Center for Science and International Affairs, John F. Kennedy School of Government, Harvard University, dated December 2003, Report number DE-FG26-99FT4028. http://belfercenter.ksg.harvard.edu/files/repro-report.pdf
- Cameco Corporation. 2017. “URANIUM PRICES, URANIUM Spot Price History, though September, 2017.” http://www.cameco.com/invest/markets/uranium-price
- Deutch, J., C. W. Forsberg, A. C. Kadak, M. S. Kazimi, E. J. Moniz, J. E. Parsons, Y. Du, and L. Pierpoint. 2009. Update of the MIT Citation2003 Future of Nuclear Power Study, MIT Energy Initiative http://web.mit.edu/nuclearpower/pdf/nuclearpower-update2009.pdf
- Drollette, D. Jr. 2014. “The Rising Cost of Decommissioning a Nuclear Power Plant,” Bulletin of the Atomic Scientists, Accessed 28 April 2014. http://thebulletin.org/rising-cost-decommissioning-nuclear-power-plant7107
- El Baradei, M. 2003. “Toward a Safer World.” The Economist, Accessed 16 October 2003.
- Enebish, N. 2016. “Overview of Energy/Electricity Demand and Renewable Energy Potential in Mongolia,” Asia Super Grid (ASG) Workshop 25-27th May 2016, JW Marriott Hotel, Seoul, South Korea. https://www.renewable-ei.org/images/pdf/20160525/Enebish_Namjil.pdf
- Erdenechuluun, K. 2014. “Mongolian Power Sector: Background and Current Policy,” Institute of Energy Economics Japan, August 2014. https://eneken.ieej.or.jp/data/5590.pdf
- Gulidov, R., and A. Ognev. 2007. “The Power Sector in the Russian Far East: Recent Status and Plans,” Prepared for the 2007 Asian Energy Security Project Meeting “Energy Futures and Energy Cooperation in the Northeast Asia Region,” Tsinghua University, Beijing, China, October 31–2 November 2007. http://nautilus.wpengine.netdna-cdn.com/wp-content/uploads/2011/12/Russia-Energy-Changes.ppt
- Hafele, W. 1996. “The Concept of an International Monitored Retrievable Storage System.” In: Uranium Institute Symposium, London, UK, August 1996.
- Hecker, S. S. 2010. “A Return Trip to North Korea’s Yongbyon Nuclear Complex.” NAPSNet Special Report, Accessed 22 November 2010, http://www.nautilus.org/publications/essays/napsnet/reports/a-return-trip-to-north-korea2019s-yongbyon-nuclear-complex
- Hellweg, S., T. B. Hofstetter, and K. Hungerbühler. 2003. “Discounting and the Environment: Should Current Impacts Be Weighted Differently than Impacts Harming Future Generations?” International Journal of Life-Cycle Analysis 8 (1): 8–18. http://www.lcaforum.ch/Portals/0/DF_Archive/DF22/Steffi.pdf
- Horner, D. 2010. “IAEA Board Approves Russian Fuel Bank Plan,” Arms Control Today January/February 2010. https://www.armscontrol.org/act/2010_01-02/FuelBank
- International Atomic Energy Agency (IAEA). 2005. Multilateral Approaches to the Nuclear Fuel Cycle: Expert Group Report Submitted to the Director General of the International Atomic Energy Agency. Document # INFCIRC/640, Accessed 22 February 2005. https://www.iaea.org/INPRO/2nd_Dialogue_Forum/mna-2005_web.pdf
- International Atomic Energy Agency (IAEA). 2007. Communication Received from the Resident Representative of Germany to the IAEA with Regard to the German Proposal on the Multilateralization of the Nuclear Fuel Cycle, IAEA document # INFCIRC/704, Accessed 4 May 2007. https://www.iaea.org/publications/documents/infcircs/communication-received-resident-representative-germany-iaea-regard-german-proposal-multilateralization-nuclear-fuel-cycle
- International Atomic Energy Agency (IAEA). 2011. “Assurance of Supply for Nuclear Fuel: IUEC and the LEU Guaranteed Reserve,” Accessed 31 October 2011. https://www.iaea.org/OurWork/ST/NE/NEFW/Assurance-of-Supply/iuec.html
- Kimball, D. G. 2012. “Mongolia Recognized as Nuclear-Free Zone,” Arms Control Today, October 2012. http://www.armscontrol.org/act/2012_10/Mongolia-Recognized-as-Nuclear-Free-Zone
- Loukianova, A. 2008. “The International Uranium Enrichment Center at Angarsk: A Step Towards Assured Fuel Supply?,” NTI Issue Brief, Accessed November 2008. http://www.nti.org/e_research/e3_93.html
- Massachusetts Institute of Technology (MIT). 2003. The Future of Nuclear Power, an Interdisciplinary MIT Study. http://web.mit.edu/nuclearpower/pdf/nuclearpower-full.pdf
- Miller, J. B. 2012. “Mongolia Eyes Nuclear Ties,” The Diplomat, Accessed 6 March 2012. http://thediplomat.com/flashpoints-blog/2012/03/06/mongolia-eyes-nuclear-ties/
- Mongolian Statistical Agency. 2017. “ЦАХИЛГААН ЭРЧИМ ХҮЧНИЙ ТЭНЦЭЛ” (Google Translate translation, “Electrical Temple”). Downloaded from http://www.1212.mn/tables.aspx?TBL_ID=DT_NSO_1100_009V1
- Nagano, A. 2012. “Current Status and Efforts in Japan after Fukushima Accident,” JAIF International Cooperation Center (JICC), June, 2012. http://www.iaea.org/NuclearPower/Downloads/Infrastructure/meetings/2012-06-18-20-TM-Vienna/10.Status_and_Efforts_after_Fukushima.pdf
- National Bureau of Statistics of China. 2017. “China Statistical Yearbook, 2017,” Table 9-15, “Installed Capacity of Power Generation.” http://www.stats.gov.cn/tjsj/ndsj/2017/indexeh.htm
- NTI. 2010. “IAEA to Pursue Nuclear Fuel Bank in Kazakhstan.” Global Security Newswire, Accessed 11 January 2010. http://www.nti.org/gsn/article/iaea-to-pursue-nuclear-fuel-bank-in-kazakhstan/
- NTI. 2017. “IAEA LEU Bank Reaches Milestone with Storage Facility Inauguration in Kazakhstan,” Accessed 29 August 2017. https://www.iaea.org/newscenter/pressreleases/iaea-leu-bank-reaches-milestone-with-storage-facility-inauguration-in-kazakhstan
- Nuclear Threat Initiative (NTI). 2009. “NTI/IAEA Fuel Bank Hits $100 Million Milestone; Kuwaiti Contribution Fulfills Buffett Monetary Condition,” NTI press release Accessed 5 March 2009. http://www.nti.org/newsroom/news/ntiiaea-fuel-bank-100-million-kuwaiti-buffett/
- Organization for Economic Cooperation and Development Nuclear Energy Agency (OECD/NEA). 1994. The Economics of the Nuclear Fuel Cycle. OECD/NEA, Paris, France. https://www.oecd-nea.org/ndd/reports/efc/EFC-complete.pdf. doi:10.3168/jds.S0022-0302(94)77044-2
- Orszag, P. R. 2007. CBO TESTIMONY, Statement of Peter R. Orszag, Director, Costs of Reprocessing Versus Directly Disposing of Spent Nuclear Fuel, before the Committee on Energy and Natural Resources, United States Senate, Accessed 14 November 2007. https://www.cbo.gov/sites/default/files/cbofiles/ftpdocs/88xx/doc8808/11-14-nuclearfuel.pdf
- Platts. 2012. “Taiwan Mulls Conversion of Under-Construction Nuclear Power Plant to Gas-Fired,” Accessed 1 November 2012. http://www.platts.com/RSSFeedDetailedNews/RSSFeed/ElectricPower/7213676
- Rauf, T., and Z. Vovchok. 2007. “Fuel for Thought.” IAEA Bulletin 49-2, March 2008, 59–63. https://www.iaea.org/sites/default/files/publications/magazines/bulletin/bull49-2/49204845963.pdf
- Rod, S. R. 1991. Cost Estimates of Operating Onsite Spent Fuel Pools After Final Reactor Shutdown, Report Number PNL-7778, Accessed August 1991. http://www.osti.gov/scitech/servlets/purl/5349359/
- ROK Ministry of Foreign Affairs (MOFA). 2015. “Northeast Asia Peace and Cooperation Initiative,” undated, but probably 2014 or 2015, http://www.mofa.go.kr/ENG/North_Asia/res/eng.pdf
- Ruchkin, S. V., and V. Y. Loginov. 2006. “Securing the Nuclear Fuel Cycle: What Next?.” IAEA Bulletin 48/1, September 2006. https://inis.iaea.org/search/searchsinglerecord.aspx?recordsFor=SingleRecord&RN=38058793
- Sang-Hyun, L. 2014. “The Northeast Asia Peace and Cooperation Initiative (NAPCI): A Vision toward Sustainable Peace and Cooperation in Northeast Asia,” The ASAN Forum, Accessed 15 December 2014. http://www.theasanforum.org/the-northeast-asia-peace-and-cooperation-initiative-napci-a-vision-toward-sustainable-peace-and-cooperation-in-northeast-asia/
- South China Morning Post. 2018. “Taiwanese Protesters Rally for ‘Nuclear-Free’ Island,” Accessed 11 March 2018. https://www.scmp.com/news/china/policies-politics/article/2136732/taiwanese-protesters-rally-nuclear-free-island
- Stanway, D. 2016. “China Halts Work on $15 Billion Nuclear Waste Project after Protests,” Reuters, Accessed 9 August 2016. https://www.reuters.com/article/us-china-nuclearpower/china-halts-work-on-15-billion-nuclear-waste-project-after-protests-idUSKCN10L0CX
- Suzuki, T. 1997. “Nuclear Power in Asia: Issues and Implications of “ASIATOM” Proposals.” In: United Nations Kanazawa Symposium on Regional Cooperation in Northeast Asia, Kanazawa, Japan. June 2–5, 1997.
- Suzuki, T., and T. Katsuta. 2009. “A Proposal of Multilateral Nuclear Fuel Cycle Approach: ‘International Nuclear Fuel Management Arrangements (INFA)’.” Presentation prepared for A-MAD Project Mini Workshop on Policy Recommendations for Nuclear Disarmament and Non-proliferation, September, 2009.
- Takase, K., and D. F. von Hippel. 2017. “Options for Remote Interim Storage of Nuclear Spent Fuels in Japan,” NAPSNet Special Reports, Accessed 20 October 2017. https://nautilus.org/napsnet/napsnet-special-reports/options-for-remote-interim-storage-of-nuclear-spent-fuels-in-japan/.
- Tanabe, T., and T. Suzuki. 1998. “Institutional and Policy Issues for Cooperation Schemes in the Asia-Pacific Region.” In Pacific Basin Nuclear Conference, Banff, Canada, May 3-7, 1998.
- Tomero, L. 2008. “The Future of GNEP: The International Partners,” Bulletin of the Atomic Scientists online edition, Accessed 31 July 2008. https://thebulletin.org/future-gnep-international-partners
- TRW Environmental Safety Systems, Inc. 1993. “At Reactor Dry Storage Issues.” Report # E00000000-01717-2200-00002, September, 1993.
- United Nations Institute for Disarmament Research (UNIDIR). 2009. UNIDIR Project “Multilateral Approaches to the Nuclear Fuel Cycle.” http://www.unidir.org/programmes/weapons-of-mass-destruction/multilateral-approaches-to-the-nuclear-fuel-cycle
- United States Department of Energy (US DOE). 1994. Multi-Purpose Canister Evaluation: A Systems Engineering Approach, Report DOE/RW-0445, September, 1994. https://www.osti.gov/servlets/purl/10186007. doi:10.3168/jds.S0022-0302(94)77044-2.
- United States Department of Energy (US DOE) Office of Inspector General, Office of Audits and Inspections. 2014. Audit Report: Cost and Schedule of the Mixed Oxide Fuel Fabrication Facility at the Savannah River Site, Report DOE/IG-0911, May, 2014. https://www.energy.gov/sites/prod/files/2014/05/f16/DOE-IG-0911.pdf
- United States Department of Energy, Energy Information Administration (USDOE/EIA). 2018. “International Energy Statistics, Mongolia.” Data on net electricity generation available as https://www.eia.gov/beta/international/data/browser/#/?pa=00000000000000000000000000000fvu&c=000000000000000000000000000008&ct=0&tl_id=2-A&vs=INTL.2-12-MNG-BKWH.A&vo=0&v=H&end=2015&showdm=y(through 2015)
- von Hippel, D., T. Suzuki, T. Katsuta, J. Kang, A. Dmitriev, J. Falk, and P. Hayes. 2010. Future Regional Nuclear Fuel Cycle Cooperation in East Asia: Energy Security Costs and Benefits, Nautilus Institute Report, June, 2010. http://nautilus.wpengine.netdna-cdn.com/wp-content/uploads/2012/01/EASS_Report_6-2010_rev.pdf
- von Hippel, D. F., and P. Hayes. 2008. Growth in Energy Needs in Northeast Asia: Projections, Consequences, and Opportunities. Paper prepared for the 2008 Northeast Asia Energy Outlook Seminar, Korea Economic Institute Policy Forum, Washington, DC, 6 May 2008. http://s3.amazonaws.com/zanran_storage/www.keia.org/ContentPages/44539229.pdf
- von Hippel, D. F., and P. Hayes. 2012. Foundations of Energy Security for the DPRK: 1990-2009 Energy Balances, Engagement Options, and Future Paths for Energy and Economic Redevelopment, NAPSNet Special Reports, Accessed 13 September 2012. http://nautilus.wpengine.netdna-cdn.com/wp-content/uploads/2012/12/1990-2009-DPRK-ENERGY-BALANCES-ENGAGEMENT-OPTIONS-UPDATED-2012_changes_accepted_dvh_typos_fixed.pdf
- Williams, K. A. 1999. “Life Cycle Costs for the Domestic Reactor-Based Plutonium Disposition Option,” Oak Ridge National Laboratory Report ORNL/TM-1999-257 Accessed October, 1999. https://www.osti.gov/servlets/purl/750989
- World Nuclear Association. 2016. “International Framework for Nuclear Energy Cooperation,” Accessed November 2016. http://www.world-nuclear.org/information-library/current-and-future-generation/international-framework-for-nuclear-energy-coopera.aspx
- World Nuclear Association. 2017a. “Nuclear Power in Taiwan,” Accessed August 2017. http://www.world-nuclear.org/information-library/country-profiles/others/nuclear-power-in-taiwan.aspx
- World Nuclear Association. 2017b. “Nuclear Power in South Korea,” Accessed December 2017. http://www.world-nuclear.org/information-library/country-profiles/countries-o-s/south-korea.aspx
- World Nuclear Association. 2017d. “Australia’s Uranium,” Accessed November 2017. http://www.world-nuclear.org/information-library/country-profiles/countries-a-f/australia.aspx
- World Nuclear Association. 2017e. “Nuclear Power in Vietnam” Accessed June 2017. http://www.world-nuclear.org/information-library/country-profiles/countries-t-z/vietnam.aspx
- World Nuclear Association. 2017f. “World Uranium Mining,” Accessed July 2017. http://www.world-nuclear.org/information-library/nuclear-fuel-cycle/mining-of-uranium/world-uranium-mining-production.aspx
- World Nuclear Association. 2017g. “Uranium Enrichment,” Accessed May 2017. http://www.world-nuclear.org/information-library/nuclear-fuel-cycle/conversion-enrichment-and-fabrication/uranium-enrichment.aspx
- World Nuclear Association. 2017h. “The Economics of Nuclear Power,” Accessed December 2017. http://www.world-nuclear.org/information-library/economic-aspects/economics-of-nuclear-power.aspx
- The World Nuclear Association. 2017i. “China’s Nuclear Fuel Cycle,” Accessed November 2017. http://www.world-nuclear.org/information-library/country-profiles/countries-a-f/china-nuclear-fuel-cycle.aspx
- World Nuclear Association. 2017j. “Japan’s Nuclear Fuel Cycle,” Accessed November 2017. http://www.world-nuclear.org/information-library/country-profiles/countries-g-n/japan-nuclear-fuel-cycle.aspx
- World Nuclear Association. 2017k. “Mixed Oxide (MOX) Fuel,” Accessed September 2017. http://www.world-nuclear.org/information-library/nuclear-fuel-cycle/fuel-recycling/mixed-oxide-fuel-mox.aspx
- World Nuclear Organization. 2017c. “Nuclear Power in China,” Accessed January 2018. http://www.world-nuclear.org/information-library/country-profiles/countries-a-f/china-nuclear-power.aspx
- Yudin, Y. 2009. “Multilateralization of the Nuclear Fuel Cycle: Assessing the Existing Proposals.” United Nations Institute for Disarmament Research, report # UNIDIR/2009/4. http://www.unidir.org/files/publications/pdfs/multilateralization-of-the-nuclear-fuel-cycle-assessing-the-existing-proposals-345.pdf
- Yudin, Y. 2011. Multilateralization of the Nuclear Fuel Cycle A Long Road Ahead, United Nations Institute for Disarmament Research, report number UNIDIR/2011/5. http://www.unidir.org/files/publications/pdfs/multilateralization-of-the-nuclear-fuel-cycle-a-long-road-ahead-378.pdf