
 ?Mathematical formulae have been encoded as MathML and are displayed in this HTML version using MathJax in order to improve their display. Uncheck the box to turn MathJax off. This feature requires Javascript. Click on a formula to zoom.
Abstract
In this study, we describe a behaviour comparison between powdered and calcined adsorbents prepared from vegetables waste of Persea species to remove Eriochrome Black T as anionic dye from aqueous solutions. Potential capabilities of these two adsorbents have been evaluated by studying some experimental parameters such as solution pH, adsorbent dosage, initial dye concentration, contact time and temperature. Kinetic study has been achieved by the application of pseudo-first and second orders and Elovich model. Results found agreed well with the pseudo-second order model. The experimental data were analysed using Langmuir, Freundlich and Tempkin isotherms models. The equilibrium data fitted well with the Freundlich isotherm and the adsorption capacities were calculated to be 120.50 mg/g and of 96.15 mg/g for calcined and powdered adsorbents, respectively. Thermodynamic study was also undertaken and provided important results indicating a spontaneous reaction and feasibility on the two adsorbents. The two adsorbents have been characterized via spectroscopic data such infrared spectrum, X-ray and by emission scanning electron microscopy.
1. Introduction
Adsorption is one of the most used tools for the removal of pollutant chemicals species. Every day researchers describe new ways and elaborate a new adsorbent on the basis of good selectivity for a chemical species, or for the low cost of the process. Among the chemical species removed by adsorption are industrial dyes. It is already known that dyes are very toxic and cause undesirable effects when discharged to aqueous media by preventing the penetration of sunlight, depleting dissolved oxygen and affecting human and animal health (Abuzer, Mehmet, & Huseyin, Citation2009; Chakraborty, Basak, Dutta, Bhunia, & Dey, Citation2013).
A number of conventional methods are used for textile wastewater treatment, generally classified as biological, chemical and physical treatments (Nethaji, Sivasamy, Thennarasu, & Saravanan, Citation2010; El Haddad et al., Citation2012; Azizian, Citation2004; Mittal, Mittal, Malviya, & Gupta, Citation2010; Gupta, Jain, Nayak, Agarwal, & Shrivastava, Citation2011; Saravan et al., Citation2013a, Citation2013b, Citation2013c; Saravanan et al., Citation2015). The current study focuses on the adsorption technique as it is an effective and inexpensive treatment option. The adsorption process can be carried out using various inexpensive and renewable adsorbents, making the treatment even more inexpensive.
Activated carbon is the most preferred adsorbent for the removal of dyes because of its excellent adsorption ability. However, widespread use of activated carbon is restricted because of its high cost. An alternative adsorbent is considered to be of low cost when minimal processing is required, it is abundant in nature, or it is derived from industrial by-products (Sonai, de Souza, de Oliveira, & de Souza, Citation2016). Among these, different sorts of materials have been studied as potential adsorbents for the removal of dyes by a number of researchers. Some that are commonly used include Cerastoderma lamarcki shell (Kazemi, Biparva, & Ashtiani, Citation2016), Partherium hysterophorus (Chatterjee, Kumar, Basu, & Dutta, Citation2012), sugar beet pulp (Malekbala, Hosseini, Kazemi Yazdi, Masoudi Soltani, & Malekbala, Citation2012), animal bones (Slimani et al., Citation2011), mussel shells (El Haddad et al., Citation2014), pistachio shell (Deniz and Kepekci, Citation2016), orange peel powder (Munagapati and Kim, Citation2016), peanut hull waste (Tahira, Bhatti, Iqbal, & Noreen, Citation2017), mango stone (Shoukat, Bhatti, Iqbal, & Noreen, Citation1987), clay/MnFe2O4 composite (Kanwal, Bhatti, Iqbal, & Noreen, Citation2017), native acidic and composite clay (Ehsan, Bhatti, Iqbla, & Noreen, Citation2017) and calcined bones (El Haddad, Mamouni, Saffaj, & Lazar, Citation2016).
The chromophores in anionic and non-ionic dyes mostly consist of anthraquinone or azo groups. Due to fused aromatic rings, anthraquinone-based dyes are particularly resistant to degradation, and their persistence in wastewaters is growing at the present time. In this fact, the presence of an azo group (N = N) on Eriochrome Black T (EBT) and its low biodegradability makes it a concern for environmental study. The removal of EBT dye from aqueous solutions is very important due to its toxicity, and it was selected in this study as representative anionic dye.
In our research plan, we have already undertaken many studies for the removal anionic and cationic dyes from aqueous media using calcined mussel shells and bones and sawdust.
We describe here the ability of powdered Persea americana nuts and Persea americana nuts calcined and activated under acidic conditions for the adsorption of an azo anionic dye such as EBT contained in aqueous solution. A comparative study was made for the evaluation of the potentialities of the two prepared adsorbents for removing dye from aqueous solutions. The adsorption experiments were performed in batch mode, and studies such as isotherms models, kinetics forms, and thermodynamic calculations were evaluated and discussed. Finally, the reusability efficiency of the two adsorbents was enhanced.
2. Materials and methods
2.1. Adsorbents preparation
Persea americana nuts were washed several times with distilled water to remove adhered impurities from their surface. The resulting material was dried at 105 °C for 24 h, crushed and sieved. This is abbreviated as P – PAN for powdered Persea americana nuts.
The activation of P – PAN was carried out using an appropriate weight and 25 mL of concentrated phosphoric acid (1:4) and completed by carbonization at temperature 500 °C for 2 hours, producing a black carbonaceous residue. The activated carbon was repeatedly washed with distilled water until neutral pH was achieved. The resulting adsorbent was dried at 105 °C for 2 hours, and was abbreviated as C – PAN, for carbon Persea americana nuts.
The characterization of P – PAN and C – PAN adsorbents was achieved by Fourier-transform infrared spectroscopy (FT–IR) applied to investigate the surface characteristic functional groups and scanning electronic microscopy (SEM) images for studying the morphology of surface texture.
2.2. Preparation of Eriochrome Black T solution
The chemical structure of the studied dye EBT is shown in , and its characteristics are summarized in . The stock of EBT dye solution (1000 mg/L) was prepared by dissolving 100 mg of EBT dye in 1L of distilled water. Experimental solutions of the desired concentrations were prepared by successive dilutions. The pH zero point charge (pHZPC) of the P – PAN and C – PAN adsorbents was determined using the pH drift method (Foo and Hameed, Citation2012).
Figure 1. Chemical structure of EBT.
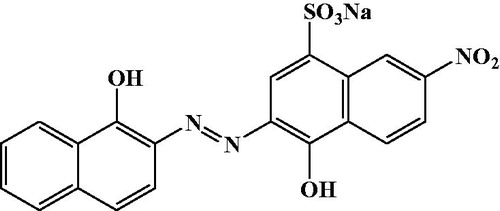
Table 1. Some properties of Eriochrome Black T dye.
2.3. Experimentation conditions of adsorption studies
The adsorption isotherm and kinetics experiments were performed by batch mode. An aliquot of 50 mL of EBT dye solution of known initial concentration (60 mg/L) was used. The mixture solution was stirred at 1500 rpm, with a required dose of adsorbents (10–25 mg) for a specific period of contact time (5–60 min) using a magnetic stirrer, after noting down the initial pH of the solution to the optimum pH. The pH of the solutions was adjusted to the required value by adding either 0.1 M HCl or 0.1 M NaOH solution.
After equilibrium, the final concentration (Ce) was measured using absorbance values with a UV/Visible spectrophotometer (JANWAY 6300) and compared with the absorbance values of the initial solutions. The absorbance was measured at 530 nm. Experiments were carried out in duplicate and mean values are presented. The percent removal (%) of dyes was calculated using the following equation:
where C0 is the initial dye concentration and Ce (mg/L) is the concentrations of EBT dye at equilibrium.
The amount of dye adsorption per unit mass of P – PAN and C – PAN adsorbents at equilibrium, qe (mg/g) was calculated by the following equation:
where Ce (mg/L) is the liquid concentration of dye at equilibrium, C0 (mg/L) is the initial concentration of the EBT dye in solution. V is the volume of the solution (L) and W is the mass of dye adsorbent (g).
3. Results and discussion
3.1. Characterization of P – PAN and C – PAN adsorbents
The FT–IR spectra of the unmodified and modified P – PAN were obtained to determine the surface functional groups and are shown in and .
Figure 2. FT–IR spectra of C – PAN and P – PAN adsorbents.
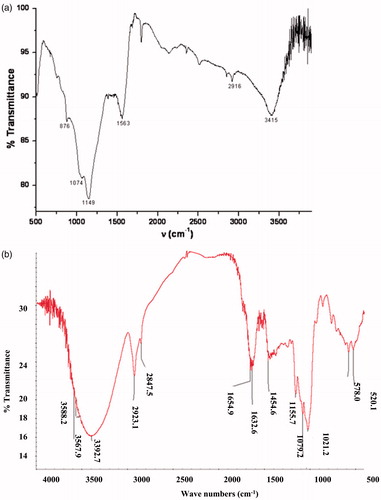
From the peaks were also found at frequencies: 876, 1074, 1149, 1563, 2916 and 3415 cm−1. The absorption band at 3415 cm−1 is attributed to the hydroxyl groups (OH) vibration (Liang, Guo, & Tian, Citation2011). The bands at 2916 cm−1, 1563 cm−1 and 1381 cm−1 correspond, respectively, to unsymmetrical aliphatic C–H stretching, C=C stretching of aromatic rings and aromatic C=C stretching vibration. The band at 1149 cm−1 is ascribed to C–O stretching in alcohol or ether or hydroxyl group (He, Ma, He, Zhao, & Yu, Citation2002; Pavia, Lampman, & Kaiz, Citation1987).
From , the peaks at 3275.13 cm−1 and 2924.09 cm−1 indicate the presence of hydroxyl (OH) group. The peak around 1635 cm−1 is due to the C=C stretching that can be attributed to the aromatic C–C bond, while bands at 1021 cm−1 and 1454 cm−1 are due, respectively, to C–O–C, P–O or P–OH stretching.
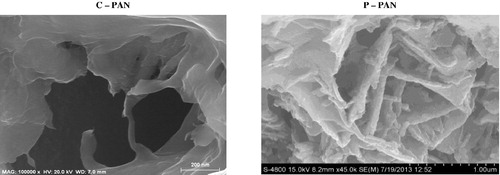
SEM has been a primary tool for characterizing the surface morphology and fundamental physical properties of the adsorbent. SEM images of C – PAN and P – PAN are shown in . As can be seen from this figure, a lot of large pores were clearly found on the surface of C – PAN relative to the surface of P – PAN.
Figure 3. SEM image of C – PAN and P – PAN adsorbents.
3.2. Effect of adsorbent dosage
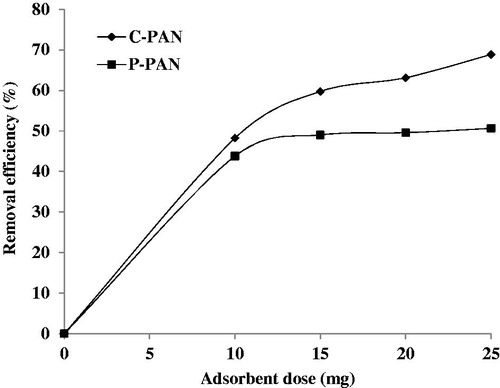
The effect of adsorbent dosage of P – PAN and C – PAN adsorbents was studied at different amounts of adsorbents (10, 15, 20, and 25 mg); analyses were conducted using 50 mL of EBT solutions at 60 mg/L at ambient temperature and at pH 2. In the light of these results, it appears that equilibrium of P – PAN and C – PAN adsorbents was attained above 60 min. Before this time, the % adsorption increases from 43% to 51% for P – PAN and from 48% to 69% for C – PAN, when the adsorbent dosage was increased from 10 to 25 mg. It was observed that the uptake of the EBT dye increased by the amount of adsorbents added and that the maximum dye removal was achieved within the amount 25 mg. This implied that the number of adsorption sites increased as the adsorbents’ mass increases (see ). This can be attributed to the increase in the adsorbent surface area and availability of more adsorption sites (Mahmoodi, Hayati, Arami, & Lan, Citation2011). Finally, % removal efficiency of EBT was better onto C – PAN than onto P – PAN. These results can be explained by the higher affinity for C – PAN making many pores on the adsorbent area.
Figure 4. Effects of P – PAN and C – PAN adsorbent amounts on the % removal efficiency of EBT dye. Experimental conditions: C0 = 60 mg/L, pH = 2, V = 50 mL, ambient temperature.
3.3. Effect of pH
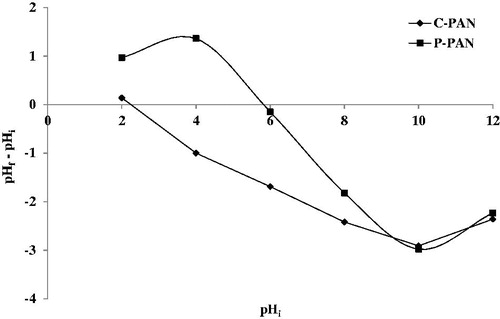
pH plays an important role in the determination of significant adsorption capacity of an adsorbent. This study explores the variation of % adsorption of EBT dye onto P – PAN and C – PAN adsorbents versus pH (2 – 10). All results of this study are shown in . It is observed that uptake decreases from 50.65 to 4.01% for P – PAN and from 68.87 to 31.23% for C – PAN with increasing pH from 2 to 10. In explaining this behaviour, the determination of pHZPC plays an important role. Thus, pHZPC of P – PAN is 5 and is of 2.1 for C – PAN, as depicted in . The pHZPC of P – PAN indicated that the surface of the adsorbent was positively charged at pH less than 5 and negatively charged at pH values above 5. At this pH, a significantly high electrostatic attraction phenomenon exists between the negatively charged anionic dye and the positively charged surface of adsorbent, resulting in a higher uptake of EBT dye. For P – PAN, greater adsorption was found under pH 6 and this decreases clearly at pH greater than 6. By comparison, from the results of % adsorption of EBT dye from the two adsorbents, it appears that C – PAN provides a better response than P – PAN.
Figure 5. Effect of pH on % removal of EBT dye onto P – PAN and C – PAN adsorbents. Experimental conditions: C0 = 60 mg/L, W = 25 mg, pH = 2, V = 50 mL, ambient temperature.
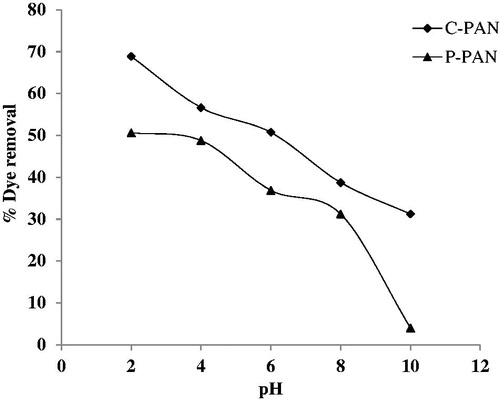
Figure 6. Values of pHZPC for P – PAN and C – PAN adsorbents.
3.4. Effect of initial dye concentration
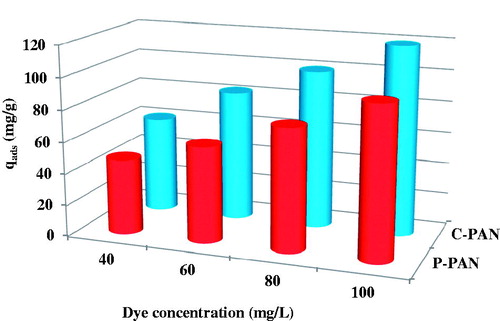
The effect of initial dye concentration depends on the immediate relation between the concentration of the dye and the available sites on an adsorbent surface. The effect of the initial dye concentration was investigated as follows: a 25 mg sample of P – PAN and C – PAN was added to 50 mL solution of EBT dye with initial concentrations varying from 60 to 100 mg/L. shows the effect of initial dye concentration and nature of the adsorbent on the adsorption capacity of EBT dye at pH 2. An increase in initial EBT dye concentration leads to an increase in the adsorption capacity for P – PAN and C – PAN adsorbents. As the initial dye concentration increases from 40 mg/L to 100 mg/L, the adsorption capacity of dye changes from 47.52 to 95.81 mg/g for P – PAN and from 61.14 to 119.3 mg/g for C – PAN. This indicates that the initial dye concentration plays an important role in the adsorption capacity of dye, as described by other research (Regti, Laamari, Stiriba, & El Haddad, Citation2017). From these results, C – PAN was considered better than P – PAN as an adsorbent.
Figure 7. Effect of Erichrome Black T dye concentrations on dye removal by P – PAN and C – PAN. Experimental conditions: m = 25 mg, pH = 2, V = 50 mL and ambient temperature.
3.5. Kinetic studies
The linearized integral form of the pseudo-first order model is generally expressed as
where qe and qt are the adsorption capacities (mg/g) at equilibrium and time t, respectively, and k1 is the pseudo-first order rate constant (min−1) (Li, Yue, & Gao, Citation2010).
The calculated equilibrium adsorption capacity qe (cal) and qe (exp) values have shown large deviation at various initial EBT dye concentrations onto P – PAN and C – PAN adsorbents (see ). The pseudo-first order kinetic model rate law failed to explain the adsorption of EBT dye onto P – PAN and C – PAN adsorbents, with poor fit at various concentrations.
Table 2. Kinetic parameters for EBT dye removal onto P – PAN and C – PAN adsorbents.
The pseudo-second order model is based on the assumption that the rate-limiting step involves chemisorptions (Qin, Ma, & Liu, Citation2009). The pseudo-second order rate equation is given as
where qe is the maximum adsorption capacity (mg/g), k2 the rate constant of the pseudo-second order equation (g/mg.min) and qt is the amount of dye adsorbed on adsorbed per unit mass of the adsorbent (mg/g).
The results of the pseudo-second order plot at various initial EBT dye concentrations are given in . The equilibrium adsorption capacity qe(cal) and qe(exp) values are in close agreement at various concentrations. From the results it is clear that the equilibrium capacity increases with increasing initial EBT dye concentration. The adsorption of EBT dye onto P – PAN and C – PAN adsorbents is explained well by the pseudo-second order model kinetics, with a very high correlation coefficient. The uptake of EBT dye indicates that the rate-determining step could be chemisorption in nature (Kadirvelu, Karthika, Vennilamani, & Pattabhi, Citation2005; Karthikeyan, Rajgopal, & Iranda, Citation2005). By comparing the adsorption capacity data for P – PAN and C – PAN adsorbents, it appears the C – PAN adsorbent shows better results than those of P – PAN.
The Elovich equation is often used when the adsorbing surface is heterogeneous. The linear form of the Elovich equation is given as described by Elovich:
where α (mg/g.min) is the initial adsorption rate constant and the parameter β (g/mg) is related to the extent of surface coverage and activation energy for chemisorption. The values of α and β can be calculated from the plot of qt against ln (t). The values of the constants α and β are given in . For any adsorbent, values of α and β increase with increasing EBT dye concentration. Despite the fact that the correlation factor is not close to unity, important suggestions can be deduced, like the values of α are much higher for P – PAN than those for C – PAN, suggesting a slow reaction onto P – PAN. Similarly, values of β are higher for P – PAN than those for C – PAN. This is a logical result because the adsorption reaction occurs very slowly. Through this model, we confirm that the adsorption of EBT dye is more favourable onto C – PAN adsorbent than P – PAN adsorbent.
3.6. Adsorption isotherms
The adsorption isotherm is significant for explaining how the adsorbent will interact with the adsorbate, and giving an idea of adsorption capacity. This plays an important role in understanding the mechanism of adsorption. In this study, Langmuir, Freundlich and Tempkin adsorption isotherms were studied.
The Langmuir adsorption model is established on the following hypotheses: uniformly energetic adsorption sites, monolayer coverage, and no lateral interaction between adsorbed molecules (Langmuir, Citation1918). A mathematical expression of the Langmuir isotherm is given by the following equation:
where qe (mg/g) is the amount of dye adsorbed on the solid adsorbent at equilibrium, qm (mg/g) is the maximum adsorption capacity, KL (L/mg) is the Langmuir equilibrium constant, and Ce (mg/L) is the EBT dye concentration at equilibrium. The essential characteristic of the Langmuir isotherm can be expressed by the dimensionless constant called equilibrium parameter, RL, defined by
where C0 is the initial EBT dye concentration (mg/L). Values of RL indicate the possibility type of the request isotherm which may be
The values of the maximum adsorption capacity qm and the adsorption constant KL were obtained by plotting Ce/qe versus Ce and are presented in . Firstly, values of RL are 0.45 and 0.22 for P – PAN and C – PAN, respectively, suggesting the favourable adsorption of EBT dye onto both dyes.
Table 3. Isotherm constants for Eriochrome Black T biosorption onto P – PAN and C – PAN.
The Freundlich isotherm endorses the heterogeneity of the surface and assumes that the adsorption occurs at sites with different energy of adsorption. The energy of adsorption varies as a function of surface coverage (Freundlich, Citation1906). This equation is also applicable to multilayer adsorption and is expressed by the following linear form:
where KF (L/mg) is the Freundlich constant and n is the heterogeneity factor. The KF value is related to the adsorption capacity; while the 1/n value is related to the adsorption intensity, values of 1/n indicate the type of isotherm to be Irreversible: 1/n = 0; Favourable: 0 < 1/n < 1; Unfavourable: 1/n > 1.
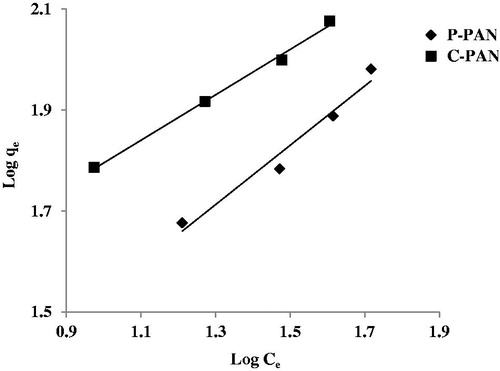
Therefore, a plot of log (qe) versus log (Ce) should be a straight line of slope 1/n and intercept log (Kf). shows the plot of Freundlich isotherm for EBT dye onto P – PAN and C – PAN adsorbents, showing an acceptable linearity straight line. Values of n parameter are 1.7 for P – PAN and 2.22 for C – PAN, suggesting values of 1/n comprised between 0 and 1, indicating a favourable adsorption of EBT dye onto both dyes.
Figure 8. Plot Curve of linear equation Freundlich model for the adsorption of EBT dye onto P – PAN and C – PAN adsorbents.
Tempkin considered the effects of some indirect adsorbate/adsorbate interactions on adsorption isotherms and suggested that, because of these interactions, the heat of adsorption of all the molecules in the layer would decrease linearly with coverage. The Tempkin equation is given as described in Tempkin and Pyzhev (Citation1940):
where
A plot of qe versus ln (Ce) enables the determination of the isotherm constants BT and KT from the slope and the intercept, respectively. KT is the equilibrium binding constant (L/mol) corresponding to the maximum binding energy and constant BT is related to the heat of adsorption.
The isotherm constants of each model were calculated and presented in . Examination of the linear isotherm parameters show that the correlation coefficients (R2) obtained from the Freundlich isotherm model were higher in comparison with the other models.
Therefore, the Freundlich equation represents better the adsorption process, which proves that the heterogeneous adsorption surface with sites that have different energies of adsorption as the model assumes.
3.7. Thermodynamic studies
The thermodynamic parameters such as standard enthalpy (ΔH0), the standard entropy (ΔS0) and free standard energy (ΔG0) have been calculated using the following equations:
where R is the universal gas constant (8.314 J/mol K), T is the temperature (K) and KC is the distribution coefficient of EBT dye for adsorption mechanism. The parameter KC can be calculated using the following equation as described in Han et al. (Citation2006):
where Ce is the equilibrium EBT dye concentration on the adsorbent (mg/L) and qe is the solid phase concentration (mg/g).
The values of ΔH0 and ΔS0 were calculated from the slope of the linear plot of ln (KC) versus 1/T (see ) and the free energy change ΔG0 was calculated at different temperatures and is given in . We consider firstly the adsorption of EBT dye onto P – PAN adsorbent; the negative values of ΔG0 have decreased from –2.72 to –7.48 kJ/mol with increases in temperature from 298 K to 328 K. This behaviour indicates the spontaneous nature of adsorption favourable at higher temperatures. On the other hand, the positive value of ΔH0 (44.514 kJ/mol) suggests that the process was endothermic in nature, and the positive value of ΔS0 (158.51 J/mol K) indicates that the entropy of the system increased during the adsorption.
Figure 9. Van’t Hoff plot for the adsorption of EBT dye onto P – PAN and C – PAN adsorbents.
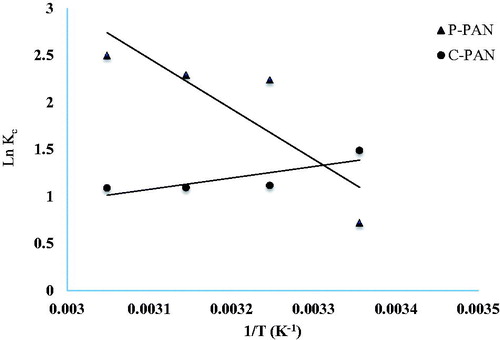
Table 4. Thermodynamic parameters for the adsorption of EBT dye onto P – PAN and C – PAN adsorbents.
Secondly, in the adsorption of EBT dye onto C – PAN adsorbent, the increased values of ΔG0 from –3.43 kJ/mol to –2.76 kJ/mol with the increasing temperature from 298 to 328 K indicate a decrease in feasibility of adsorption at higher temperatures. The negative value ΔH0 –10.087 kJ/mol shows that the adsorption is exothermic in nature. The negative value of change of entropy ΔS0 –22.32 J/mol K suggests that the adsorption onto C – PAN adsorbent occurs by a decreasing randomness at the solid/liquid interface.
3.7. Comparison study
depicts some results of the uptake of EBT dye onto some adsorbents cited in the literature. The comparison shows that C – PAN adsorbent gives a better adsorption capacity, and it is above 120 mg/g.
Table 5. Comparison of adsorption capacity of the uptake EBT dye onto other adsorbents.
3.8. Regeneration and reusability of P – PAN and C – PAN adsorbents
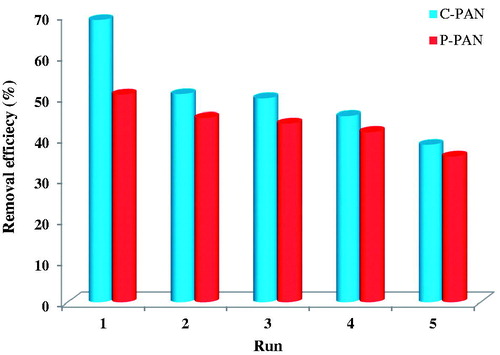
The economic and environmental aspects of the use of adsorbent materials make their re-use important. displays the difference in percent removal of first and fifth cycles. The adsorption efficiency was reduced from 51% to 35% for P – PAN adsorbent, and from 69% to 38% for C – PAN adsorbent. This result can be explained by the reduction in the specific surface of this material following the heat treatment carried out.
Figure 10. Reusability of P – PAN and C – PAN adsorbents. Experimental conditions: C0 = 60 mg/L, m = 25 mg, pH =2, V = 50 mL, ambient temperature.
5. Conclusion
In this study, we have achieved the removal of EBT from aqueous solutions onto P – PAN and C – PAN as adsorbents. The best adsorption capacity was found with C – PAN at different concentrations, and showed that for the removal of EBT dye C – PAN acts as a better adsorbent than P – PAN. The equilibrium adsorption data obtained at different concentrations fitted well with the requirements of the Freundlich isotherm model, indicating multilayer adsorption on a heterogeneous surface. Kinetic studies show that the EBT adsorption demonstrates pseudo-second order chemical reaction kinetics.
The adsorption of the dye on modified P – PAN is spontaneous and exothermic, as evidenced by negative values of the changes in free energy and enthalpy, while the adsorption at P – PAN is spontaneous and endothermic as indicated by the negative values of the changes in free energy and positive values of enthalpy.
Disclosure statement
No potential conflict of interest was reported by the authors.
References
- Abuzer, C., Mehmet, Y., & Huseyin, B. (2009). Kinetic and equilibrium studies on the adsorption of reactive red 120 from aqueous solution on Spirogyra majuscule. Chemical Engineering Journal, 152(1), 139–145.
- Arsalan, K., & Mukarram, Z. (2018). A Comparative Study on the Adsorption of Eriochrome Black T Dye from Aqueous Solution on Graphene and Acid-Modified Graphene. Arabian Journal for Science and Engineering, 43, 2167–2179.
- Azizian, S. (2004). Kinetic models of sorption: a theoretical analysis. Journal of Colloid Interface and Science [Database], 276, 47–52.
- Boumchita, S., Lahrichi, A., Benjelloun, Y., Lairini, S., Nenov, V., & Zerrouq, F. (2017). Application of Peanut shell as a low-cost adsorbent for the removal of anionic dye from aqueous solutions. Journals of Materials and Environmental Science, 8 (7), 2353–2364.
- Chakraborty, S., Basak, B., Dutta, S., Bhunia, B., & Dey, A. (2013). Decolorization and biodegradation of Congo red dye by a novel white rot fungus Alternaria alternata CMERI F6. Bioresource Technology, 147, 662–666.
- Chatterjee, S., Kumar, A., Basu, S., & Dutta, S. (2012). Application of response surface methodology for methylene blue dye removal from aqueous solution using low cost adsorbent. Chemical Engineering Journal, 181-182, 289–299.
- Deniz, F., & Kepekci, R. A. (2016). Dye biosorption onto pistachio – by product: A green environmental engineering approach. Journal of Molecular Liquid, 219, 194–200.
- Ehsan, A., Bhatti, N. H., Iqbla, M., & Noreen, S. (2017). Native, acidic pre-treated and composite clay efficiency for the adsorption of dicationic dye in aqueous medium. Water Science and Technology, 75, 753–764.
- El Haddad, M., Mamouni, R., Saffaj, N., & Lazar, S. (2012). Removal of a cationic dye – Basic Red 12 – from aqueous solution by adsorption onto animal bone meal. Journal of the Association of Arab Universities for Basic and Applied Sciences, 12, 48–54.
- El Haddad, M., Mamouni, R., Saffaj, N., & Lazar, S. (2016). Evaluation of Performance of animal bone meal as a new low cost adsorbent for the removal of a cationic dye Rhodamine B from aqueous solutions. Journal of Saudi Chemical Society, 20, S53–S59.
- El Haddad, M., Regti, A., Laamari, R., Slimani, R., Mamouni, R., El Antri, S., & Lazar, S. (2014). Calcined mussel shells as a new and eco-friendly biosorbent to remove textile dyes from aqueous solutions. Journal of Taiwan Institute of Chemical Engineers, 45(2), 533–540.
- Foo, K. Y., & Hameed, B. H. (2012). Potential of jackfruit peel as precursor for activated carbon prepared by microwave induced NaOH activation. Bioresource Technology, 112, 143–150.
- Freundlich, M. F. (1906). Over the adsorption in solution. Journal of Physical Chemistry, 57, 385–470.
- Gupta, V. K., Jain, R., Nayak, A., Agarwal, S., & Shrivastava, M. (2011). Removal of the hazardous dye-Tartrazine by photodegradation on titanium dioxide surface. Materials Science and Engineering C, 31 (5), 1062–1067.
- Han, R., Wang, Y., Han, P., Shi, J., Yang, J., & Lu, Y. (2006). Removal of Methylene Blue from aqueous solution by chaff in batch mode. Journal of Hazardous Materials, 137(1), 550–557.
- He, J., Ma, Y., He, J., Zhao, J., & Yu, J. C. (2002). Photooxidation of azo dye in aqueous dispersions of H2O2/α-FeOOH. Applied Catalysis B: Environment, 39(3), 211–220.
- Kadirvelu, K., Karthika, C., Vennilamani, N., & Pattabhi, S. (2005). Activated carbon from industrial solid waste as an adsorbent for the removal of Rhodamine-B from aqueous solution: kinetic and equilibrium studies. Chemosphere, 60(8), 1009–1017.
- Kanwal, A., Bhatti, H. N., Iqbal, M., & Noreen, S. (2017). Basic dye adsorption onto Clay/MnFe2O4 composite: A mechanistic study. Water Environment Research, 89(4), 301–311.
- Karthikeyan, T., Rajgopal, S., & Iranda, L. R. (2005). Chromium (VI) adsorption from aqueous solution by Hevea brasilinesis sawdust activated carbon. Journal of Hazardous Materials, 124(1-3), 192–199.
- Kazemi, S. Y., Biparva, P., & Ashtiani, E. (2016). Cerastoderma lamarcki shell as natural, low cost and new adsorbent to removal of dye pollutant from aqueous solutions: Equilibrium and kinetic studies. Ecological Engineering, 88, 82–89.
- Langmuir, I. (1918). The adsorption of gases on plane surfaces of glass, mica, and platinum. Journal of the American Chemical Society, 40(9), 1361–1403.
- Li, Y., Yue, Q. Y., & Gao, B. Y. (2010). Adsorption kinetics and desorption of Cu(II) and Zn(II) from aqueous solution onto humic acid. Journal of Hazardous Materials, 178(1-3), 455–461.
- Liang, S., Guo, X., & Tian, Q. (2011). Adsorption of Pb2+ and Zn2+ from aqueous solutions by sulfured orange peel. Desalination, 275(1-3), 212–216.
- Mahmoodi, N. M., Hayati, B., Arami, M., & Lan, C. (2011). Adsorption of textile dyes on Pine Cone from colored wastewater: Kinetic, equilibrium and thermodynamic studies. Desalination, 268(1-3), 117–125.
- Malekbala, M. R., Hosseini, S., Kazemi Yazdi, S., Masoudi Soltani, S., & Malekbala, M. R. (2012). The study of the potential capability of sugar beet pulp on the removal efficiency of two cationic dyes. Chemical Engineering Research and Design, 90(5), 704–712.
- Mittal, A., & Gupta, V. K. (2010). Adsorptive removal and recovery of the azo dye Eriochrome Black T. Toxicol. Environmental Chemistry, 92 (10) 1813–1823.
- Mittal, A., Mittal, J., Malviya, A., & Gupta, V. K. (2010). Removal and recovery of Chrysoidine Y from aqueous solutions by waste materials. Journal of Colloid and Interface Science, 344 (2), 497–507.
- Moeinpour, F., Alimoradi, A., & Kazemi, M. (2014). Efficient removal of Eriochrome black-T from aqueous solution using NiFe2O4 magnetic nanoparticles. Journal of Environmental Health Science and Engineering, 12(1), 112–116.
- Munagapati, V. S., & Kim, D.-S. (2016). Adsorption of anionic of azo dye congo red from aqueous solution by cationic modified orange peel powder. Journal of Molecular Liquids, 220, 540–548.
- Nethaji, S., Sivasamy, A., Thennarasu, G., & Saravanan, S. (2010). Adsorption of Malachite 339 Green dye onto activated carbon derived from Borassus aethiopum flower biomass. Journal of Hazardous Materials, 181(1-3), 271–280.
- Pavia, D. L., Lampman, G. M., & Kaiz, G. S. (1987). Introduction to Spectroscopy: A Guide for Students of Organic Chemistry. National Library of Australia: W.B. Saunders Company.
- Qin, Q. D., Ma, J., & Liu, K. (2009). Adsorption of anionic dyes on ammonium-functionalized MCM-41. Journal of Hazardous Materials, 162(1), 133–139.
- Regti, A., Laamari, R., Stiriba, S., & El Haddad, M. (2017). Use of response factorial design for process optimization of basic dye adsorption onto activated carbon derived from Persea species. Microchemical Journal, 130, 129–136.
- Saravanan, R., Joicy, S., Gupta, V. K., Narayanan, V., & Stephen, A. (2013a). Visible light induced degradation of methylene blue using CeO2/V2O5 and CeO2/CuO catalysts. Materials Science and Engineering C, 33(8), 4725–4731.
- Saravanan, R., Karthikeyan, N., Gupta, V. K., Thirumal, E., Thangadurai, P., Narayanan, V., & Stephen, A. (2013b). ZnO/Ag nanocomposite: An efficient catalyst for degradation studies of textile effluents under visible light. Materials Science Engineering C: Materials for Biological Applications, 33 (4), 2235–2244.
- Saravanan, R., Mansoob Khan, M., Gupta, V. K., Mosquera, E., Gracia, F., Narayanan, V., & Stephen, A. (2015). ZnO/Ag/CdO nanocomposite for visible light-induced photocatalytic degradation of industrial textile effluents. Journal of Colloid and Interface Science, 452, 126–133.
- Saravanan, R., Thirumal, E., Gupta, V. K., Narayanan, V., & Stephen, A. (2013c). The photocatalytic activity of ZnO prepared by simple thermal decomposition method at various temperatures. Journal of Molecular Liquids, 177, 394–401.
- Shoukat, S., Bhatti, H. N., Iqbal, M., & Noreen, S. (1987). Mango stone biocomposite preparation and application for crystal violet adsorption: A mechanistic study. Materialwissenschaft Und Werkstofftechnik, 18(7), 180–189.
- Slimani, R., Anouzla, A., Abrouki, Y., Ramli, Y., El Antri, S., Mamouni, R., Lazar, S., & El Haddad, M. (2011). Removal of a cationic dye -Methylene Blue- from aqueous media by the use of animal bone meal as a new low cost adsorbent. Journals of Materials and Environmental Science, 2, 77–87.
- Sonai, G. G., de Souza, S. M. A. G. U., de Oliveira, D., & de Souza, A. A. U. (2016). The application of textile sludge adsorbents for the removal the reactive red 2 dye. Journal of Environmental Management, 168, 149–156.
- Tahira, N., Bhatti, H. N., Iqbal, M., & Noreen, S. (2017). Biopolymers composites with peanut hull waste biomass and application for Crystal Violet adsorption. International Journal of Biological Macromolecules, 94, 210–220.
- Tempkin, M. J., & Pyzhev, V. (1940). Recent modifications to Langmuir isotherms. Acta Physico–chimica USSR, 12, 217–222.