
 ?Mathematical formulae have been encoded as MathML and are displayed in this HTML version using MathJax in order to improve their display. Uncheck the box to turn MathJax off. This feature requires Javascript. Click on a formula to zoom.
Abstract
As the Kingdom of Bahrain's population and development expand, sewage transport outside the national sewer network becomes an ever increasing requirement. Due to the risk associated with sewage transport, an evaluation of industry safety practices has become necessary. Four main factors were selected to make a comprehensive safety assessment model, namely: safety policy compliance, route planning effectiveness, accident management and vehicle reliability. A questionnaire-based study was used to assess compliance to these factors using descriptive and quantitative methods. The study also included a safety mapping analysis to visualize the outcome of the evaluation of the factors of the assessment model. The development and use of indices in analysing both objective and perceptual questionnaire questions and safety mapping, to evaluate the sub-factors of the assessment model, are the main contributions of this study. The main conclusions of this study were: that a safety assessment model is used to evaluate the safety performance level of the sewage trucking companies; that the model developed can be used as a base for a comprehensive safety compliance checklist for raw sewage trucking to be used by the authorities and the trucking companies; and that larger companies uphold the safety principles better than smaller companies.
1. Introduction
Through history, there have been several sewage management strategies and treatment technologies implemented worldwide. The management strategies can be categorized as either centralized, where all the sewage is collected and conveyed to a central location for treatment and disposal, or de-centralized, where the sewage is treated or disposed of on-site near the source. The reasons for a particular preference are based on a combination of cost, urban development patterns, the nature of sewage (e.g. industrial or toxic waste), and other factors. The urban sewage management strategies and treatment technologies from the early nineteenth century up to the present day have been subjected to several developments (Burian, Nix, Pitt, & Rocky Durran, Citation2000).
In the Kingdom of Bahrain, the sewer network infrastructure is not connected to all urban areas. Some areas still rely on septic tanks to collect the local waste from connected clusters of houses and businesses. Then, trucks are used to vacuum suck these septic tanks empty and transport the sewage to treatment plants (STPs), namely, Tubli STP and the newly constructed Muharraq STP in the Hidd area. This type of transportation system has constraints including safety, cost, environmental and health impacts and efficiency. The safety, health and environmental concerns associated with sewage transportation by truck are growing in number and complexity. Raw sewage transported by trucks contains toxic substances, and if released to the environment through spillage or odour can threaten human safety, health, environment and property. The sewage transportation systems in Bahrain will be taken as an example for this study. Tubli STP is the main central treatment plant in Bahrain which is designed based on a pressurized system that is not fully connected to the network by sewer lines. Hence, trucks are used to transport the raw sewage to the plant. Growing population growth, urbanization and an increase in the standard of living in Bahrain increase the volume of sewage. Therefore, Tubli STP may not be capable to treat all the waste water from all Bahrain areas.
Sewage is liquid waste that is derived from domestic, industrial, commercial and institutional sources (Katyal and Satake, Citation2001). According to the regulations, definitions and the hazardous waste flow chart (Hazardous Waste Legislation Guide, June Citation2005); domestic raw sewage is classified as non-hazardous waste by definition and composition when contained in vessels, septic tanks, sewer systems and trucks. Whereas, in the case of spill or de-containment, some of the components of raw sewage, such as hydrogen sulphide, when released to the environment, or the occurrence of the direct contact with the sewage can be hazardous to personnel and the environment. Therefore, raw sewage cannot be considered as non-hazardous while transported by trucks (US DOT, Citation2004b).
Hazmat transport incidents can occur at the origin or destination (when loading and unloading) or en-route. Incidents involving hazmat cargo can lead to severe consequences such as fatalities, injuries, evacuation, property damage, environmental degradation and traffic disruption. In 2003, there were 488 serious incidents (among a total of 15 178 incidents) resulting in 15 deaths, 17 major and 18 minor injuries, and a total property damage cost of $37.75 million (US DOT, Citation2004c).
As hazmat transportation by road has been tackled as an issue during the last few years, different surveys on hazmat accidents have been carried out to analyse the road accidents, including their causes, consequences, severity and frequency (Zhao, Wang, & Qian, Citation2012; Yang et al., Citation2010; Shen, Yan, Li, Xie, & Wang, Citation2014). In these surveys, 322 hazmat transportation accidents were conducted in China from 2000 to 2008, using statistical methods, and in conclusion four main causes were found to be responsible for these accidents: driver error, mechanical and equipment failure, management failure and external factors. It is widely recognized that the management of safety plays an important part in achieving and maintaining safety standards. Safety management practices are the vital ingredient of comprehensive safety management systems. Safety management practices can influence and shape employees’ attitudes towards the importance of safety and can contribute to their safe behavior. Safety management practices have been shown to have positive effects on increasing driver safety perception (Newnam, Griffin, & Mason, Citation2008), driver safety behavior (Newnam, Watson, & Murray, Citation2002; Dejoy, Schaffer, Wilson, Vandenberg, & Butts, Citation2004) and reducing crash rates (Moses and Savage, Citation1994) in general fleets.
Routing is a critical factor to consider in hazmat logistics, therefore one of the research areas related to hazmat transportation is the investigation of transportation routes .The main objective of hazmat routing is to determine the optimal path(s) for routing the hazmat on a network by taking into account safety considerations and cost minimization. Models for hazmat routing have been proposed previously by Leonelli, Bonvicini, & Spadoni (Citation2000).
According to Choueiri, Choueiri, & Choueiri (Citation2013), in their overview of the transport sector and road safety in the MENA region, the factors that could directly affect vehicle safety are: inappropriate vehicle safety; lack of vehicle safety standard tests; the age of vehicle fleet; incompatibility of vehicles on the roads; and lack of standard safety equipment in vehicles. Steps to ensure vehicle maintenance should be planned and organized like any other business activity as stated by the European Agency for Safety and Health (CitationEU-OSHA). There should be clear procedures and arrangements for daily routines to ensure self and other’s safety.
It was concluded from the review of the literature regarding hazmat incidents that no studies related to the safety evaluation of raw sewage transportation by trucks were carried out in the Kingdom of Bahrain or the neighboring Gulf countries. Thus the main objective of this study is to evaluate the safety of sewage transport by trucks in the Kingdom of Bahrain and to suggest a quantitative safety assessment model that will guide sewage trucking companies to evaluate their safety performance level.
2. Data collection
In order to obtain data for the assessment of the safety associated with the transportation of raw sewage by trucking companies; two questionnaires were designed and prepared. The first questionnaire was distributed to the established sewage trucking companies in the Kingdom of Bahrain and the other was conducted through the interview of experts in the management of sewage trucking businesses and safety associations to seek their opinions on the importance of each factor that affects safety performance. The first questionnaire was distributed to all 50 companies involved in sewage transport in Bahrain, and replies were received from 38 companies (i.e. a response rate of 76%). The questionnaire is divided into six sections. The aim of the first section (Company Safety Policy) is to establish how efficient the companies are in devising and implementing safety procedures to reduce the risks. The second section (Journey/Route Planning) is concerned with the measures taken by companies in planning for trucking journeys, and choosing the safest route while trying to reduce the number of journeys made per a trucking job. Section three (Accidents) is designed to collect data regarding the number of accidents each company faced. The fourth section titled (Vehicles) will look into the integrity of vehicles used by the trucking companies in carrying out the sewage trucking jobs and if the fleet is well maintained and periodically checked. Each of the first sections consists of two parts: objective and perceptual questions. In addition to these, sections were added for Operational Costs and Maintenance.
The aim of the second questionnaire is to establish relative weights of all the attributes regarding the main factors which cover the integrity of a proper and safe sewage trucking system. The opinion of the management of sewage trucking businesses and the experts about the importance of each factor that affect safety performance are sought.
2.1. Safety assessment model of raw sewage transportation by trucks
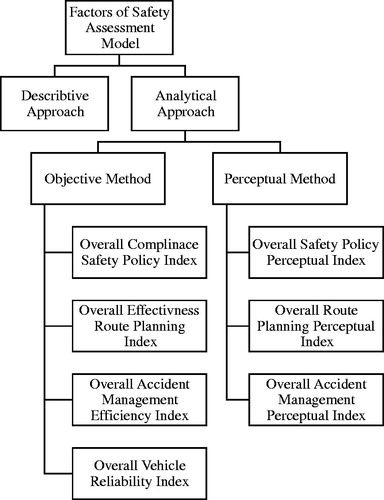
Safety assessment models are among the multi-hierarchy valuation structures established on the basis of key influence factors. The weight of factors and sub-factors are usually calculated by fuzzy analytical hierarchy process (Liu, Mao, Li, & Yao, Citation2007; Montoya, Planas, & Casal, Citation2009; Wu, Liu, Huan, Liu, & Guan, Citation2018). In the present study, four main factors were selected to form a comprehensive safety assessment model of raw sewage transportation by trucks:
Safety Policy Compliance
Route Planning Effectiveness
Accidents Management
Vehicles Reliability
Each main factor will be divided into a number of sub-factors (six for factor 1, seven for factor 2, four for factor 3, and three for factor 4). The identified factors were evaluated through a descriptive and an analytical approach. The descriptive approach presented the logic and implication of each factor and its subsequent sub-factors, and the extent of conformity to these factors by the sample companies. The analytical approach was derived through objective and perceptual methods, and indices of conformity were calculated for each method by using the sub-factor weights, as depicted in .
Figure 1. Safety assessment model outline.
In order to build a comprehensive assessment of safety management, a questionnaire consisting of the above four main factors was prepared and distributed to 10 selected experts to evaluate individually the level of importance of each selected sub-factor. This step is inspired by the idea that the experts’ ratings will give weight to different factors. Some of the targeted experts work at a managerial level in Tubli STP and Muharraq STP; others are Principal Environmental Consultants who work in private consultancy firms. All of the experts selected have a minimum of 10 years’ experience. So, the questionnaire seeks the opinion of independent parties.
3. Results and discussions
Fifty surveys initially were sent to all the listed Sewage Trucking Service Companies in the Kingdom of Bahrain from which thirty eight replied back, giving a response rate of 76%. To achieve the objective of this data analysis, the evaluation of the safety management of sewage trucking practices, the responders from sewage trucking companies were categorized into three sub-groups according to truck fleet size (Small: less than 10 trucks, Medium: between 10 to 25 trucks and Large: greater than 25 trucks). This categorization stemmed from the answer of each respondent to the question in the survey of how they evaluated their fleet size. The response rate based on the sub-grouping is shown in .
Table 1. Summary of responders' statistics.
Analysis of the objective questions is carried out by establishing an index for each sub-factor of the main factor using the following relationships:
(1)
(1)
Where SFI (i,j) is the sub-factor index of sub-factor of the main factor (i), and the sample size is the number of trucking companies surveyed, which is 38. Then the overall index of the main factor (i) is obtained by the following relationship:
(2)
(2)
where ISF (i, j) is the importance of sub-factor (j) of the main factor (i), which is established based on the experts’ such that the sub-factor with the highest rank will have the highest importance number.
In addition to the above objective based indices, perceptual indices for each main factor are established using the relationship:
(3)
(3)
where PI (i,j) is perceptual indicator (j) of the main factor (i), w (k) is the rating scale in the experts’ questionnaire such that the highest importance value is 6 and the lowest 1, f(i,j,k) is the frequency of perceptual indicator (j) associated with the main factor (i) for rating (k). The weight of each perceptual indicator—WPI (i, j)—is obtained using the following relationship:
(4)
(4)
3.1. Analysis of safety factors
For analysing the safety factors (SF), an evaluation for both the objective and perceptual questions is carried out followed by determining the overall compliance of the safety factors' indices and the safety factors' perceptual indices. Analysing the answers for both the objective and perceptual questions will enable validating the trueness and precision of the replies, or identifying discrepancies in replies when the answers of related questions are cross-tabulated. For example, the compliance of Safety Policy Index (CSPI) gives an explanation of how effective the company is in implementing a management system that ensures compliance with safety requirements. The Compliance Indices of SF (i) are established from the number of Yes responses over the sample size as shown in EquationEquation (1)(1)
(1) and the results are shown in .
Table 2. Number of responders and importance ratings of the safety policy sub-factors of the main factors.
The numbers of Yes responses collected for the sub-factors of the main factors (i), i.e. the Safety Policy, overall effectiveness of route planning, accident management, vehicle reliability and their importance ratings are shown in . For example, calculation of the compliance of the first sub-index (Availability of a pre-defined transport safety program) is as follows:
Table 3. Overall indices of the main factors.
Similarly, the compliance of other indices are calculated and shown in .
The calculation of the overall compliance of safety policy index (OCSPI) using EquationEquation (2)(2)
(2) is as follows:
Thus, the overall compliance of the safety policy index is 53.9%. Similarly, the overall compliance of the other main factors’ indices is calculated and the results are shown in .
In addition to the objective-based indices, perceptual indices (PI (i, j)) for each main factor (i) are calculated by EquationEquation (3)(3)
(3) and the results are shown in .
Table 4. Number of responders of the main factors perceptual indicators.
The main factor (i) perceptual indices (j) and their corresponding weights (WPI (i, j)) are calculated using EquationEquations (3)(3)
(3) and Equation(4)
(4)
(4) and the data in . The results are as shown in .
Table 5. Main factor perceptual indices and their weights.
The overall main factor (i) perceptual index (OF (i) PI (j)) is determined by:
(5)
(5)
Where is the weight of the main factor (i) perceptual indicator, calculated using EquationEquation (4)
(4)
(4) . For example the overall safety policy perceptual index is calculated by using EquationEquation (5)
(5)
(5) .
Thus, the overall safety policy perceptual index is 60.9%.
Similarly, using EquationEquation (5)(5)
(5) and the data in , the overall main factor (i) perceptual indices are calculated and the results are shown in .
Table 6. Overall main factor perceptual indices.
3.2. Summary of objective and perceptual indices of the main factors
The objective and perceptual indices for each of the main factors of safety assessment model of raw sewage transportation by trucks are summarized in .
Table 7. Summary of objective indices and perceptual indices.
For all the factors, the objective indices have fallen around the value of 0.5 which indicates that in an objective sense all the companies are moderately conforming to the subject of the factor. Whereas, in a perceptual sense, the companies tend to be conforming more to the subject of the factors, as indices show higher values than the objective indices values. Route planning effectiveness gained 0.726 which is the highest perceptual index followed by the accident management factor.
The above indices are developed through analysing the main factors, and the magnitudes of conformity by the trucking companies to these factors are calculated. A safety index which evaluates the level of safety performance by the trucking companies has emerged from this approach. Therefore this approach can be used as a safety assessment model for transportation of raw sewage by trucks.
An overall objective index for safety assessment (OOSAI) can be established by weighting the indices of the four main factors. By assuming equal weights, this index is calculated using the values of as:
Similarly, an overall perceptual index for safety assessment (OPSAI) can be calculated using as:
3.3. Analysis of operational and maintenance costs
Given the competitive nature of the sewage trucking industry in the Kingdom of Bahrain and the extreme sensitivity associated with corporate financials and expenditures, the operational and maintenance cost information was collected through the questionnaire in order to be analysed against the safety assessment. The operational cost is mainly related to truck drivers’ salaries and fuel consumption relative to fleet size. In analysing the data collected from the questionnaires’ replies the following is drawn up for the drivers’ hourly rate.
Table 8. Summary of responders to the drivers’ salaries.
As can be seen in , 81% of the small fleet size companies indicated low payments to drivers whereas the majority (66%) of the large fleet size companies employ average-waged truck drivers. In the case of the medium fleet size companies, three companies declared low salaries and two companies declared average wages. None of the sample companies pay high wages to drivers, no matter what the number of years of experience are.
Fuel costs can be concluded to be directly related to fleet sizes, i.e. large fleet size companies would shoulder more fuel costs than small fleet size companies. But also, small fleet size companies can pay more fuel costs if they have to make more journeys per trucking job since they don’t have the capacity to comply with daily job targets.
The maintenance cost for the sewage trucking companies is mainly related to the periodical preservation of vehicles, and if this periodical maintenance is done in-house or by a service provider. By analysing the data collected from the questionnaires’ replies, are drawn up.
Table 9. Summary of responders to average periodical maintenance.
Table 10. Summary of responders to the fleet vehicle model.
Table 11. Summary of responders to vehicle servicing.
The average periodical maintenance is compared across the sub-groups in . Medium size companies tend to do the most frequent maintenance on vehicles, whereas the small fleet size companies carry out the least frequent maintenance. As for the fleet models which relate directly to maintenance costs, it can be seen from that the great majority of companies across all fleet sizes declared to have recent models. In large fleet companies, more maintenance is expected as two of them do have old models (more than 15 year's old) alongside their recent fleet models. It is worth mentioning that some companies have more than one vehicle model.
Carrying out periodical maintenance by the vehicle’s manufacturer or agency can be significantly most costly than carrying out maintenance in-house or at local vehicle garages. It can be seen from that the small size companies have a tendency not to carry out the maintenance on vehicles by manufacturers' service. Most large and medium fleet size companies do seek the service provider to carry out periodical maintenance on vehicles. The majority of companies across all sub-groups declared to hold spare parts and carry out simple repairs in-house, therefore reduced maintenance costs may be achieved to some extent.
gives a quick glance on the drivers’ age and years of experience across the three sub-groups, which are factors contributing to vehicle maintenance costs. All sub-groups declared that their truck drivers’ practices are good, by indicating an average of seven years of experience, which may imply reduced maintenance costs. Large fleet companies have more experienced drivers compared to medium and small fleet size companies; this could mean that large fleet companies face less maintenance cost of vehicles.
Table 12. Summary of responders to the driver-related questions.
4. Safety mapping
A safety mapping tool is developed by the authors to assess quantitatively the safety of the transport of sewage by trucks. Conceptually it is similar to the risk matrix associated with quantitative risk assessment (Knutson & Huettel, Citation2015; Duijm, Citation2015). It is a graphical representation in which the evaluation of the sub-factors of the main factors of the safety assessment model of raw sewage transportation by trucks form the x axis, while their importance form the y axis. The way to prioritize the sub-factors is by designating an importance level for each area of the graph such as Very High (VH), High (H), Medium (M), Low (L) and Very Low (VL), as shown in , where the higher the combined field and importance ratings, the higher the overall level of safety concern.
Table 13. Example of safety map.
Where the limits range for each region are:
The red region of the map is where safety is considered to be highly compromised, the yellow region is where safety is moderately compromised, and the green region is where safety requirements are achieved.
The safety maps for the main four factors are presented in the following sections.
4.1. Safety policy compliance map
The compliance percentages of safety policy sub-factors are established by using EquationEquation (1)(1)
(1) , and their importance ratings’ percentages are established based on the experts’ rating for each sub-factor, divided by the number of sub-factors as shown in .
Table 14. Percentage of compliance and importance ratings of the safety policy sub-factors.
Thus, the map for the safety policy compliance factor as shown , is as follows:
Table 15. Safety policy compliance map.
As shown in , the fourth sub-factor (Conducting risk assessment analysis prior to attending to new trucking orders) has high importance but the compliance is low, therefore, it falls in the red region which means a critical review is needed. While the first, second, third and fifth sub-factors fall in the medium region, which indicates more elaboration is necessary. The Table shows that an acceptable level of periodical health check for drivers has been achieved.
Thus, the hazard associated with safety policy compliance factor is: lack of “conducting risk assessment analysis prior to attending to new trucking orders”. Not carrying out such assessment prior to attending raw sewage trucking journeys can prevent recognition and control of problems arising during these journeys. The more informed and aware the drivers are of the risks, the lower the number of incidents will be. Also conducting risk assessment analysis can reduce costs by being proactive and working towards preventing incidents rather than being reactive after the incidents, which usually costs more.
4.2. Route planning effectiveness map
The effectiveness percentages of route planning sub-factors are established by using EquationEquation (1)(1)
(1) , and their importance ratings’ percentages are established based on the experts’ rating for each sub-factor divided by the number of sub-factors as shown in .
Table 16. Percentage of effectiveness and importance ratings of the route planning sub-factors.
Thus, the map for route planning effectiveness factor by using is as follows:
As shown in , the seventh sub-factor (Identifying potential hazards in the route) has fallen in the red region as its effectiveness is low and its importance is considered to be high. Therefore, the result of this sub-factor needs reviewing. While the second, fifth and sixth sub-factors need more elaboration. Other sub-factors fall within the green region.
Table 17. Route planning effectiveness map.
Thus, the hazard associated with “route planning effectiveness factor” is that the potential hazards in the delivery route will not be identified beforehand. By planning a route and identifying hazards in delivery routes, companies and their drivers will be able to predict hazardous aspects of road design, approach to customer’s premises etc. Alternative safer routes and times may be considered and thus potentially avoid incidents.
4.3. Accident management map
The efficiency percentages of accident management sub-factors are established by using Equation (9), and their importance ratings’ percentages are established based on the experts’ rating for each sub-factor divided by the number of sub-factors, as shown in .
Table 18. Percentage of efficiency and importance ratings of the accident management sub-factors.
Thus, the map for accident management factor shown in is as follows:
As shown in . the results for two high-importance sub-factors, i.e. availability of accident recovery procedures and accident spillage incident records (second and fourth) require critical review as they show low efficiency, while the placement of the first sub-factor require further elaboration.
Table 19. Accident management efficiency map.
Thus, the hazards associated with accident management efficiency are non-availability of an accident recovery procedure and accident spillage incident records. After an incident involving raw sewage, a recovery plan within which the drivers are trained on and become familiar with, is essential in order to minimize the impact of the spillage of the raw sewage as much as possible and thereby reduce the impact on the immediate vicinity. Spillage records can be used to draw up the recovery plans as by driving lessons from previous incidents.
4.4. Vehicle reliability map
The reliability percentages of vehicle sub-factors are established by using Equation (14), and their importance ratings’ percentages are established based on the experts’ rating for each sub-factor divided by the number of sub-factors as shown in .
Table 20. Percentage of reliability and importance ratings of the vehicles sub-factors.
Thus, the map for the vehicle reliability factor shown in is as follows:
As shown in . further elaboration is needed for the second and third sub-factors. While, the highly important sub-factor number four (availability of pre-trip vehicle checklist) should be critically reviewed, because of its low reliability. Therefore, the hazard associated with vehicles reliability factor is non-availability of pre-trip vehicle checklist. Safety is the most important and the obvious issue is to inspect a vehicle before launching a trip. A vehicle defect found during an inspection could save unforeseen incidents during a trip.
Table 21. Vehicle reliability map.
4.5. Summary of safety mapping of the main factors
The potential hazards associated with each of the main factors of safety assessment model of raw sewage transportation by trucks are pointed out from safety mapping and summarized in .
Table 22. Summary of the hazards associated with transportation of raw sewage by trucks.
For all the factors, the hazards have fallen in the high importance and low effectiveness region. The accident management efficiency factor is the only factor which has more than one hazard, which is non-availability of an accident recovery procedure; and non-availability of accident spillage incident records.
Safety mapping's primary purpose is to inform the trucking companies of the hazards associated with transport of raw sewage by trucks. Then, the responsibility of trucking companies is to carry out safety mapping exercises to investigate the hazards individually, rank and prioritize them. Because of the nature of safety performance level of the trucking companies, the maps have to be revised on a regular basis.
5. Discussion and analysis of results
The analysis of the cross-tabulation between the questions related to having a predefined safety program, establishing a safety committee and holding periodical safety meetings can be conceived to reach to this conclusion. Sixty-two percent of the small fleet size companies have a pre-defined transport safety policy, while only 27% of these companies have an established safety committee. Meanwhile, 100% of the large fleet companies have a transport safety policy and 83% of them do have a safety committee establishment to oversee this policy. Small differences are expected between the percentages because having a pre-defined safety policy and having periodical safety meetings are strongly associated with the presence of a safety committee to draw up and/or follow such policies, but analysis of the percentages for the replies to the related questions have shown otherwise. The cross tabulation has also shown that conducting risk assessment analysis prior to trucking journeys is not a strength of the majority of small size companies, as 65% replied with a No and this conforms well with the fact that seven (27%) small companies claimed to be “ineffective” in taking drivers suggestions into consideration in route planning and seven other small companies replied that taking drivers' suggestions into account is “Not applicable”. This situation is not deduced from larger fleet size companies in the analysis.
Fifty-five percent of the companies (21 out of 38) have a job completion target per day and the majority of sampled companies (58%) do not account for the number of journeys made to complete a sewage trucking job, while 39% (14 out of 38) do put the effort to reduce the number of journeys and thus reduce the possible risk imposed on the environment. Maximum tank load capacity could have an impact on a company's costs in terms of affecting the number of journeys made per trucking job. Sixty-six percent of sample companies declared that they do not have a maximum tank load policy, also the large majority of companies (20 out of 38) of total responders declared that the procedures to keep the maximum loads in-check were not applicable. Therefore, it can be concluded that the maximum load is not adhered to during journeys. The objective indices have fallen around the value of 0.5 for all the factors which indicates that in an objective sense all the companies conform to the subject of the factor moderately. Whereas, in a perceptual sense, the compliance is well above average. The companies tend to conform more to the subject of the perceptual factors as indices show higher values than the objective indices values. Route planning effectiveness gained 0.726 which is the highest perceptual index followed by the accident management factor which gained 0.723. The development and use of indices in analysing both objective and perceptual questionnaire questions is a new approach. Also, safety mapping is seen as a new concept in safety analysis. It helps in visualizing and identifying sub-factors where more elaboration is needed. Also, safety mapping has aided in drawing up the hazards associated with the main factors of the safety assessment model where a critical review is needed by the trucking companies. Therefore, we may conclude that the objectives of the present study have been achieved.
6. Conclusion
The major focus of this research was to evaluate the safety level of practices in the ever-expanding industry of raw sewage transport by trucks in the Kingdom of Bahrain, and the following conclusions were drawn:
A safety assessment model has been suggested in order to evaluate the level of safety performance by the trucking companies. The trucking companies were found to be in border-line conformity with the main factors when the objective indices were calculated as part of the safety assessment model.
The model developed here can be taken as a base to draw up a comprehensive safety compliance checklist for raw sewage trucking, to be used by the authorities and the trucking companies.
The development and use of indices in analysing both objective and perceptual questionnaire questions and the subsequent safety mapping analysis tool can be considered as one of the main successes of this study.
Trucking of raw sewage safely is compromised to a certain extent in smaller fleet size companies compared to those with larger fleets.
Due to a perceived cost factor, the trucking companies focus their efforts on meeting the job completion target per day and overlook the safety requirements
The findings mentioned above, indicate that a better distribution of the trucking companies around the Kingdom of Bahrain would reduce the risk caused by longer journeys and facilitate more efficient and easier route planning.
Acknowledgement
This work is extracted from a thesis submitted in partial fulfilment for an MSc Degree in Engineering Management offered by the University of Bahrain to Engineer Fatima Hameed Qambar.
Disclosure statement
No potential conflict of interest was reported by the authors.
Related Research Data
References
- Burian, S. J., Nix, S. J., Pitt, R. E., & Rocky Durran, S. (2000). Urban wastewater management in the United States: Past, present and future. Journal of Urban Technology, 33–62
- Choueiri, B. M., Choueiri, E. M., & Choueiri, G. M. (2013). An overview of the transport sector and road safety in the MENA region. Advances in Transportation Studies Journal Section A, 30, 43–56.
- Dejoy, D. M., Schaffer, B. S., Wilson, M. G., Vandenberg, R. J., & Butts, M. M. (2004). Creating safer workplaces: Assessing the determinants and role of safety climate. Journal of Safety Research, 35(1), 81–90.
- Duijm, N. J. (2015). Recommendation on the use and design of risk matrices. Safety Science, 76, 21–31.
- European Agency for Safety and Health at Work (EU-OSHA) (2001). Maintenance and Work-related road safety.
- Hazardous Waste Legislation Guide, June (2005).
- Katyal, T., & Satake, M. (2001). Environmental Pollution, Published by Anmol Publications Pvt Ltd., New Delhi, India
- Knutson, B., & Huettel, S. A. (2015). The risk matrix. Current Opinion in Behavioral Sciences, 5, 141–146.
- Leonelli, P., Bonvicini, S., & Spadoni, G. (2000). Hazardous materials transportation: a risk-analysis-based routing methodology. Journal of Hazardous Materials, 71(1-3), 283–300.
- Liu, Y.-J., Mao, S.-J., Li, M., & Yao, J.-M. (2007). Study of a comprehensive assessment method for coal mine safety based on a hierarchical grey analysis. Journal of China University of Mining and Technology, 17(1), 6–10.
- Montoya, M. I., Planas, E., & Casal, J. (2009). A comparative analysis of mathematical models for relating indoor and outdoor toxic gas concentrations in accidental releases. Journal of Loss Prevention in the Process Industries, 22(4), 381–391.
- Moses, L. N., & Savage, I. (1994). The effect of firm characteristics on truck accidents. Accident; Analysis and Prevention, 26(2), 173–179.
- Newnam, S., Griffin, M. A., & Mason, C. (2008). Safety in work vehicles: A multilevel study linking safety values and individual predictors towork-related driving crashes. Journal of Applied Psychology, 93(3), 632–644.
- Newnam, S., Watson, B., & Murray, W. (2002). A comparison of the factorsinfluencing the safety of work-related drivers in work and personal vehicles. Road Safety Research, Policing and Education Conference. Adelaide, Australia.
- Shen, X., Yan, Y., Li, X., Xie, C., & Wang, L. (2014). Analysis on Tank Truck Accidents Involved in Road Hazardous Materials Transportation in China. Traffic Injury Prevention, 15(7), 762–768.
- US DOT (2004b). List of hazardous materials. The Office of Hazardous Materials Safety, US Department of Transportation, Washington, DC.
- US DOT (2004c). Hazmat summary by mode/cause: Calendar year 2003. Serious incidents, printed on January 4, 2005. The Office of Hazardous Materials Safety, US Department of Transportation, Washington, DC. Retrieved from: http://hazmat.dot.gov/pubs/inc/data/2003/2003scause.pdf
- Wu, C., Liu, G., Huan, C., Liu, Q., & Guan, X. (2018). Ecological Vulnerability Assessment based on Fuzzy Analytical Method and Analytical Hierarchy Process in Yellow River Delta. International Journal of Environmental Research and Public Health, 15(5), 855–869.
- Yang, J., Li, F., Zhou, J., Zhang, L., Huang, L., & Bi, J. (2010). A survey on hazardous materials accidents during road transport in China from 2000 to 2008. Journal of Hazardous Materials, 184(1-3), 647–653.
- Zhao, L. J., Wang, X. L., & Qian, Y. (2012). Analysis of factors that influence hazardous material transportation accidents based on Bayesian networks: a case study in China. Safety Science, 50(4), 1049–1055.