
 ?Mathematical formulae have been encoded as MathML and are displayed in this HTML version using MathJax in order to improve their display. Uncheck the box to turn MathJax off. This feature requires Javascript. Click on a formula to zoom.
Abstract
It is important to develop a suitable model to calculate electricity demand forecasting requested by decision makers. The present study deals with the electrical long-term peak load demand forecasting using a developed Adaptive Neuro-Fuzzy Inference System (ANFIS) and Multiple Linear Regression (MLR) methods. The MLR model is formulated as a function of population and Gross Domestic Product (GDP) for the Gulf Cooperation Council (GCC) region. The Neuro-Fuzzy is thereafter trained using previous sets of data. This training gives a future annual electricity load prediction. The results obtained from the developed models have an acceptable level of mean errors. In general, the GCC region has high-energy consumption influenced by a number of factors, such as population and GDP. The annual variation of both population and GDP growth scenarios is based on development in the country. The obtained results will encourage the GCC through the energy field development and setting the future plans for it. The novelty of the present study is to avoid an increase in generation capacity in mid-term and long-term plans, which will help the GCC countries to avoid load shedding and meet the energy demands in different sectors. The developed models will help the economic development of the GCC countries. It also helps with finding the optimum time for electrical energy trading. The obtained results for the GCC illustrate the average percentage error calculated which was found to be close to 2% and 0.53% in multilinear regression and Neuro-Fuzzy, respectively. These results reduce capital investment, limiting the equipment installed and the expected load needed for better load distribution in the region. In conclusion, the Neuro-Fuzzy is the most accurate technique compared with MLR to estimate future electricity demand and, at the same time, it can be used in power system planning and development.
1. Introduction
In a deregulated economy, maximum load forecasting is important for the electricity industry. Many applications are included such as energy generation and purchasing. The aim of the present study is to find the most suitable models for peak load demand for the Gulf Cooperation Council (GCC) countries. Many mathematical models have been developed for maximum load forecasting. Modelling the annual variation of the maximum load demand, population and Gross Domestic Product (GDP) were obtained. It was found that using the Neuro-Fuzzy method gave the most suitable and realistic results, followed by linear modelling (Khwaja, Zhang, Anpalaga, & Venkatesh, Citation2017).
In the present study, Adaptive Neuro-Fuzzy Inference System (ANFIS) and Multiple Linear Regression Method models were designed for estimating output as the Long Term Estimated Load of the GCC countries. Furthermore, another study involved the use of curve fitting and Neuro-Fuzzy to find the three models, where three techniques are used. The three techniques are the exponential, linear modelling and Neuro-Fuzzy (Santika, Mahmudy, & Naba, Citation2017). The models designed for output estimated Long Term Estimated Load of the GCC countries.
Three annual variation variables are used as inputs, which are Present Peak Load, Gross Domestic Product (GDP) and Population (Soliman & Al-Kandari, Citation2010). The estimated Peak Loads are calculated using the multi-linear regression and ANFIS. The MATLAB Simulink 7.10 package is used to obtain the estimated peak load for GCC countries. The models are obtained using the multi-linear regression and Neuro-Fuzzy techniques. GCC Population and GDP are used in the Multiple Linear Regression Model. A different GDP growth scenario based on development in the country was used and taken into consideration. The results used for estimating peak demand will be compared with actual peak data. The average percentage of error for each model is calculated based on data used to generate the model, where the lower average error model is presented and recommended for long-term load forecast for peak load demand (Moral-Carcedo & Perez-García, Citation2017).
For the electricity sector decision-makers, levels of energy trading and facility expansion are required. The electricity demand pattern is multifaceted due to the different types of loads, weather conditions, and socioeconomic factors (Soliman & Al-Kandari, Citation2010). Therefore, finding an appropriate peak load-forecasting model for GCC countries’ peak demand of the electricity network is an important task for a planning and power trading network, which is interconnected to another five national networks through the GCCIA grid (AFESD, Citation2012). This will be of great help in the planning of a reliable and economically operated network.
A pragmatic methodology was used in the present study, as a guide to constructing an Electric Power Peak Load Forecasting Model for the GCC (AFESD, Citation2012). There are many exogenous variables for long-term load forecasting (LTLF) – such as weather conditions, industrial development, population growth and social events in the country. For more simplicity, the model uses the main variables which have effect on the peak load demand and are selected for the proposed model. These were the GCC Population and Gross Domestic Product (GDP), i.e. the variable elements (Soliman & Al-Kandari, Citation2010).
Adaptive Neuro-Fuzzy Inference System (ANFIS) Models are designed for Long Term Estimated Load for the GCC countries. The fuzzy inference system (FIS) performs fuzzy reasoning (Santika et al., Citation2017). The MATLAB Simulink 7.10 package was used to obtain the estimated peak load for GCC countries.
Neurofuzzy systems allow incorporation of both numerical and linguistic data into the system (Santika et al., Citation2017). The neuro-fuzzy system is also capable of extracting fuzzy knowledge from numerical data. The neuro-fuzzy systems are divided into two main groups, the neural fuzzy inference systems and fuzzy neural networks. Various neural networks, e.g. Multilayer Perceptions (MLP) or Radial-Basis-Function Networks are capable of learning non-linear mappings and generalising over a set of methods very accurately. Rule-based neural networks implement the fuzzy logic system.
2. Review of electric power load forecasting
Electric Power Load Forecasting (EPLF) is an essential process in the planning of electrical utilities and the operation of their power systems. Perfect estimation for load forecasting will show the way to significant economic savings in operating and maintenance costs. A number of studies were carried out a long time ago, where (Santika et al., Citation2017) a model forecast the load for Indonesia by finding the results of short-term load forecasting using ANFIS for a period of 12 hours per day. These types of studies help with increasing the reliability of power supply and the delivery system and making the correct decisions for future development. The authors (Saravanan, Kannan, & Thangaraj, Citation2015) in their study aim to provide an accurate and realistic prediction model for electricity demand for India using data on population, imports, exports, per capita Gross Domestic Product (GDP) and per capita Gross National Income (GNI).
The authors (Papic et al., Citation2014) in their study highlight the practical outage data statistics collection in North America and parts of Europe. Their study helps in the development of methods and models. The study is particularly helping in identifying design variables which reduce the level of risk.
The authors (Moral-Carcedo & Perez-García, Citation2017) in their article proposed a new method of forecasting. This method helps in improving the previously developed approaches and they were able to combine the long- and short-term features. The authors’ proposed procedure is flexible enough to be applied to different scenarios based on alternative assumptions regarding both long term and short term. The developed method is applied to forecast electricity load for Spain and the model has been tested with historical data of the explanatory variables for Spain.
(Al-Muhawesh & Soltan, Citation2011) in their study used a pragmatic methodology as a guide to constructing Electric Power Load Forecasting models. The methodology used was based on decomposition and segmentation of the load time series. In their study, a real data for Kuwait was used. Finally, they obtained results which helped in predicting the forecast future load. The author (Qamber, Citation2012), in his study, derived a number of models for estimating the electricity demand for future load in the Kingdom of Bahrain. The models were using data on the electric power demand during the summer period.
The authors (Tawalbeh & El-Khazali, Citation2012), in their study, presented a non-linear method to estimate the consumed energy in distribution feeders. The proposed procedure uses the statistical solution algorithm to analyse the active energy monthly consumption, which enables the estimation of energy consumption during any period of the year. The effectiveness of the proposed method was demonstrated by comparing the simulated results with those of real measured data. The results were obtained using the curve fitting technique. Their study concentrated on the lower, average and maximum loads. Three scenarios were utilised and their models obtained.
(Ryu, Hong, & Youn-Kyu, Citation2014), carried out a study on the basis of Super Grade Hotels that have high-energy consumption per unit area, causing a massive amount of load. The study concentrates on analysing energy consumption by using electricity load data, which reflect a reduction in the amount of electricity and peak load through management and energy efficiency improvement of large hotels.
The authors (Koo, Lee, Kim, & Park, Citation2014) in their study performed short-term electric load forecasting using three methods and compared the results. They used two factors to eliminate error from a calendar-based classification before making a forecasting model. The authors compared three methods including the Artificial Neural Networks.
(Upshaw, Rhodes, & Webber, Citation2015) in their article discuss the development of a model for evaluating peak load reduction and change in the overall energy consumption for a residential air conditioning compressor with and without condenser-side thermal storage. The model used simulated cooling load data for a typical home in Austin (Texas) based on summer 2011. System performance varies depending on weather data.
The authors (Kot, Rolak, & Malinowski, Citation2013) in their paper review maximum power point tracking algorithms dedicated to small wind turbines. Three algorithms were used and discussed. Two of them were based on turbine static parameters, while the third iteratively searches for optimum operating point and it does not require prior knowledge of the turbine.
The authors (Barzin, Chen, Young, & Farid, Citation2015) in their article present an analysis of a price-based control system in conjunction with energy storage using phase change materials for two applications. Their results showed the importance of selecting a suitable price constraint to examine the benefits.
In simulation and control of power system dynamics, load modelling is one of the major issues (Jahromi & Ameli, Citation2018). The loads are usually considered as a constant impedance element. Due to the variation of the load, it would be difficult to provide a fixed model for electrical loads similar to those of other elements of the power system. The authors (Jahromi & Ameli, Citation2018) in their study used a method for modelling the power system loads via a genetic algorithm. The particular method of their study was that after obtaining the load model parameters, various values obtained for those parameters were averaged. Finally, and at the end of their study, the validity of the obtained parameters was tested with some other scenarios. The obtained results indicate that the existing load models satisfactorily describe the actual behaviour of the physical load.
The estimation and modelling of electricity consumption have a concern in Turkey. A study was carried out by (Kaynar, Ozekicioglu, & Demirkoparan, Citation2017) as a forecasting application. At the same time, the study was applied by using Turkey's electricity consumption, population, imports, exports, and GDP between the years 1975 and 2014. The application used regression methods, where the annual electricity consumption of Turkey was modelled.
The statistical testing theory applied through the study carried out by (Lv, Pawlak, Annakkage, & Bagen, Citation2018) to examine the validity of different load parametric models. Static load modelling has been performed based on a single parametric model. The main goal of the study of (Lv et al., Citation2018) was to provide a formal method for satisfying this claim by employing the theory of statistical testing for correct parametric model specification. The results obtained confirm the usefulness of the frequency component based models.
Dynamic load modelling is crucial for power system dynamic studies (Khwaja et al., Citation2017; Zhang, Citation2017; Zhang, Zhu, & Guo, Citation2017). However, the model non-linearity and performance degradation for the measurement-based load modelling approach uses the classical non-linear least-squares. The study first presented a general framework that can effectively analyse and visualize the parameter dependence of complex dynamic load models. The main objective of the proposed model was to improve the parameter estimation performance. The proposed procedures were used for composite load modelling in general.
3. Load forecasting data
Weather conditions are the most significant factor that is considered as a significant influence on the load forecasting during the year. Generally, the weather repeats its behaviour every year. The weather temperature varies during the period of the day, week, month and year, where the temperature is always in the range of 40oC during the peak time in Bahrain. The researchers (Soliman & Al-Kandari, Citation2010) mentioned that the same condition is implementable for humidity, wet bulb, wind direction, wind speed, and weather pressure. Therefore, these weather condition factors are usually used for STLF and MTLF.
The models and methods applied for the LTLF are different from the other two forecasting categories because they depend on different input data. The factors affecting load demand include numerous elements of weather conditions, seasonal effects, and socioeconomic factors. The peak load historical data becomes the available data, which can be used as selected data and used as input available at the forecast of the LTLF.
The LTLF technique was used to estimate the future expected peak load to avoid spending money on unnecessary generators and wasting national resources. In addition, the estimate was used to avoid an underestimate of the peak load which might lead to a shortage of energy availability.
A study (Soliman & Al-Kandari, Citation2010) proposed a number of elements as the main factors affecting peak load forecasting. These elements are gross domestic product (GDP), population (POP), GDP per capita (GDP/CAP), multiplication of electricity consumption by population (EP), power system losses (LOSS), load factor (LF), and cost of one kilowatt-hour.
Bahrain as a GCC member state was chosen as a first example to create the Load Demand Forecast Model. The shape of the peak load demand is a very important item for any type of load demand forecast. Therefore, it is necessary to explore the shape of the peak load demand for the Kingdom of Bahrain. All data used for LTLF was taken from the Bahrain Central Information Organization (BIeGA, Citation2015) and World Bank (WBD, Citation2015).
Generally, Bahrain’s peak load demand has continuously increased during recent years, where the average growth was found to be 6.3%. The growth in Bahrain’s peak load dropped to 0.3% in 2012, and it then increased in the following year to 1.3%. The growth in the peak load returned to its normal rate in the year 2014, where the growth recorded was 7.5% and the peak load reaching 3152 MW, where data was collected from Bahrain Central Information Organization (BIeGA, Citation2015).
3.1. Bahrain gross domestic product (GDP)
The GCC countries have almost similar Gross Domestic Product (GDP), which has a market value of all officially recognized final products and services produced by a country in defining period. Population growth rates in the GCC countries have increased sharply in the last (or recent) decades.
Bahrain’s GDP was obtained from the World Bank (WBD, 2015) for the recent years, where the recorded growth illustrates two periods of growth, but which faced a drop in growth in the year 2009. The average growth in GDP before 2009 was about 15.1%, but it dropped to 11.1% during the years 2010 and 2011. Further falls in the growth of GDP were recorded after 2011, where it was found to be 5.2% on average. Therefore, t GDP has a similar growth pattern to the peak load demand and is expected to have a major impact on peak load forecasting.
3.2. Bahrain population
The population of the Kingdom of Bahrain shows a continuity of population growth except in the years 2011 and 2012 (Trading Economics, Citation2015). The average growth in the Bahrain population before 2011 was 7% on average, but the population growth rate dropped to 3.1% after 2010. The population of the Kingdom of Bahrain shows the continuity of population growth even after the economic problems that the country faced. The average growth in Bahrain’s population before 2010 was about 7% annually, while it dropped to 3.2% after 2011. Therefore, the population has a similar growth pattern to the peak load demand and is expected to have a major impact on peak load forecasting.
The population of the Kingdom of Bahrain is shown in , where it has a high number of non-Bahraini nationality. The population of non-Bahraini nationally was 51.07% in 2011. The data shows an increase in the population of those Bahraini and non-Bahraini since 1992.
Table 1. Population/Type for the Kingdom of Bahrain (BIeGA, Citation2015).
3.3. Bahrain GDP per capita
The country’s gross domestic product adjusted by inflation and the total population, where Bahrain’s GDP per capita for the years 2006 through 2014 was collected from (Trading Economics, Citation2015). The GDP per capita was decreasing throughout the years 2006 to 2012. It started increasing rapidly after 2012. The behaviour of Bahrain GDP per capita is not similar to the behaviour of peak load demand. Therefore, this element will be ignored because of mismatching behaviour with peak load demand.
3.4. Electricity consumption by the population
The electricity consumption by the population is a neglected element when using the peak load forecast equation since the forecast peak load demand is directly related to electricity consumption. Therefore, it is the same element required to be identified in the forecast element. Furthermore, these elements are eliminated from the given equation, which will be able to identify the forecast peak load demand. The authors (Kavaklioglu, Citation2011), in proposed study models,predict Turkey’s electricity consumption. In the article, the author’s study predicts the electricity consumption that is considered as a function of population, Gross National Product, imports and exports. The prediction was carried out as far as 2026.
3.5. Peak load forecast model
The main elements can be used to identify the forecasted load demand. These elements are population and the GDP, which are formulated in EquationEquation (1)(1)
(1) as follows:
(1)
(1)
The authors (Khwaja et al., Citation2017) in their study boosted neural networks for short-term load forecasting. The final predicted result is the weighted sum of the output from all the trained models. In their study, they performed better in terms of lower error. In the study Boroojeni et al., Citation2017) presented a general technique for modelling historical load data in the form of time-series. The method they have proposed separates models as seasonal and non-seasonal cycles. Their technique was proposed as step-by-step. In the study (Dudek, Citation2016 highlights a common feature of several approaches. These approaches included multilayer perception, radial basis function neural network, generalized regression neural network, fuzzy counter propagation neural networks, and self-organizing maps. The author used a real power system data for forecasting the load. The forecasting results illustrate that the neural models learned using patterns and perform remarkably well.
4. Forecasting process methods and model
There are a number of methods that can be used to model the long-term peak load of the electricity network. Each method has advantages and disadvantages. The method chosen should be appropriate for the target and data used for the study. There are many methods that can be used for LTLF, where the best known methods used are the Least Squares Regression Method, simple linear regression, multiple linear regressions, quadratic regression, exponential regression, intelligent methods including fuzzy logic, Artificial Neural Network, and Artificial Neural-Fuzzy methods.
Reverting to the elements presented by (Soliman & Al-Kandari, Citation2010), which could be considered in the model for peak load forecasting, social behaviour can be presented by the first four factors. These factors may vary from country to country. The last three factors interlink with the electric power system characteristics, load demand and consumption.
4.1. The Rule-Based neural network
In the present study, the rule-based neural network uses a multi-layer network structure with transfer functions and links representing a fuzzy logic system (Santika et al., Citation2017; Saravanan et al., Citation2015). The new neuro-fuzzy weight update vector can be found by minimization of the firing strengths of the fuzzy rules which are normalized according to:
(2)
(2)
Newton algorithm is the popular truncated approach to find a step size and direction in weight space that drives a cost function towards its minimum. Using Taylor’s expansion the cost function JN(.) can be locally approximated by the quadratic function:
(3)
(3)
where Δw is the weight vector update.
Differentiating EquationEquation (3)(3)
(3) with respect to Δw, and setting the result to zero will minimize this equation:
(4)
(4)
where g and H represent the gradient and Hessian of JN(wk), respectively.
The solution of Newton's equation can be found by a truncated conjugate gradient algorithm, which is performed to ensure that the weight vector lies in a trust region, a hypersphere in weight space in which the quadratic approximation is assumed to be accurate. This algorithm can be summarized as follows:
k = 0.
Set initial weight vector, wk.
Calculate gradient g(wk) and Hessian H(wk).
If ǁg(wk)ǁ <
then terminate.
Solve H(wk) Δwk + g(wk) using a conjugate gradient, ensuring ǁ wk+1ǁ
Starting with λk=1, find λk where wk+1= wk + λkΔwk.
Adjust the trust region radius (Dk+1) with the following heuristic:
Go to step (iv).
In order to implement this algorithm, the gradient and Hessian of the cost function JN(wk) are required, where the weight vector w needs to be considered. These derivatives can be constructed as follows:
(6a)
(6a)
The gradient of the model output with respect to the weights represented is as follows:
(7)
(7)
(8)
(8)
where the dependency of
on the input vector xi has been dropped to reduce the notation.
4.2. LTLF using curve fitting techniques
Based on these annual loads, the model is made using the curve fitting technique through the use of the software package Graph 4.4.2 (Graph 4.4.2). Using this package, a number of models are made. Graph 4.4.2 is a programme designed to draw graphs of mathematical functions in a coordinate system and similar applications. It is a standard Windows programme with menus and dialogs. At the same time, it is capable of drawing standard functions, parametric functions, polar functions, tangents, point series, shadings, and relations. It is also possible to evaluate a function for a given point to trace a graph. Graph 4.4.2 is an open source application used to draw mathematical graphs in a coordinate system.
While it is important to determine the estimated peak load based on the actual values for the GCC through the years (2003–2014), it is necessary to find the suitable technique for that purpose which is Graph 4.4.2. The technique helps find the most suitable model for the available peak load data. The obtained model helps to find the estimated value through the period 2003 until 2024.
EquationEquation (9)(9)
(9) illustrates the variation of maximum load demand model (Exponential Model) for each country of the GCC through the years (2003–2014). The results from the derived estimate peak load value equation for the period 2003–2024 are shown in the present study.
(9)
(9)
Where MEL (x) is the Maximum Estimated Load, which means the maximum estimated load as a function of the year (x).
4.3. LTLF using multiple linear regression technique
The multiple linear regression technique used the given elements affecting the LTLF, which are presented in EquationEquation (10)(10)
(10) . This equation could be simplified by neglecting the last three factors because the losses and load factor could be considered as a fixed component. The peak-load demand can be formulated as a function of country dependency factors, which are the first four factors. The authors (Soliman & Al-Kandari, Citation2010) presented the formula which could be written as follows:
(10)
(10)
GDP: The gross domestic product,
POP: The population,
EP: The multiplication of electricity consumption by the population,
GDP/CAP: The GDP per capita.
To have more focus on the elements that may affect the forecasted peak load demand, it is necessary to look into the behaviour of each element,then focusing on the elements that have the same behaviour on the peak load growth.
4.4. Neuro-Fuzzy inference system technique
It is well known that the Neuro-Fuzzy consists of two components in one system. These components are the fuzzy system and a neural network. The fuzzy system can be either a fuzzy inference block or the neural network can drive the fuzzy inference block. The fuzzy inference block converts linguistic information for the neural network.
4.5. Fuzzy logic basics
Fuzzy logic is a logical system associated with human cognitive systems providing a mathematical framework to capture the uncertainties. The advantages of the fuzzy design are:
Reducing and simplifying development cycle,
The implementation is easy’
It has efficient performance and is user-friendly.
ANFIS MATLAB toolbox is used for the training to produce the output and forecast the peak load demand for the GCC.
5. Results and discussion of forecasted LTLF using the models
Electric load forecasts lead to significant savings in operation and maintenance costs. At the same time the reliability of the power supply and delivery system is increased. This will help to avoid incorrect decisions for future development. To obtain the forecasted LTLF for any system does not require a large number of sample data. The results will present the peak load forecasted, taking into consideration the different expected growth in the GDP and population of the country. This type of forecasting will give more visibility for the decision makers and energy traders to make the correct decision when planning the periodical operations, energy trading and facility expansion in the electricity sector.
Load forecasting is a topic of great interest for electricity utilities. The reason behind that is because it enables the utilities to make decisions on generation planning, the purchasing of electric power and future infrastructure development. The load forecasting is also very important for demand response actions. The electric load growth in the service area of an electric utility of the six GCC countries can be expected for two reasons: natural load growth of existing consumers and addition of new loads of new consumers.
This research deals with a novel method for load forecasting using artificial neural networks compared with MLR. This means that two different methods were used to obtain the results illustrated in the present study. The method used depend on conditions of the network, availability, and quality of the measurements. Moreover, results show that the ANFIS achieves the best performance for a specific period of time. This leads to the conclusion that a single electric load forecast method is able to provide the best accuracy for any condition of the network or for any selected coming year. As a solution to this issue, the ANFIS method is selected as a novel adaptive load forecasting methodology. The ANFIS has automatically selected the forecast method that fits better to the specific selected year of the running period of the GCC network, the type of network and condition of the distribution network providing a number of a years-ahead forecast with the lowest forecasting error. The implemented models are presented and tested with data from six real countries. The results illustrate that the proposed models provide an accurate and user-friendly technique to predict yearly residential electrical load in the GCC countries. Other important points regarding the novelty of the present study are to avoid an increase in-generation capacity of the mid-term and long-term plans, which help the GCC countries to avoid load shedding and to meet the energy demand in the different sector(s). These solutions will help the economic development of the GCC countries.
5.1. Results of multiple linear regression model
To find the coefficients of EquationEquation (1)(1)
(1) , the historical data of both GDP and population are needed for forecasting peak load demand. The curve fitting technique used to determine the coefficients is found in EquationEquation (1)
(1)
(1) .
The result of curve fitting in EquationEquation (1)(1)
(1) for the model is as follows:
Bahrain Model:
(11)
(11)
where P00 = -156.2, P01 = 35.27 and P10 = 0.001549
The forecast peak load demand is calculated for the future years based on the forecast population and forecast GDP of Bahrain. Mid-year Population Projections for the Kingdom of Bahrain (2012–2032) were collected from the Bahrain Central Information Organization (BIeGA, Citation2015).
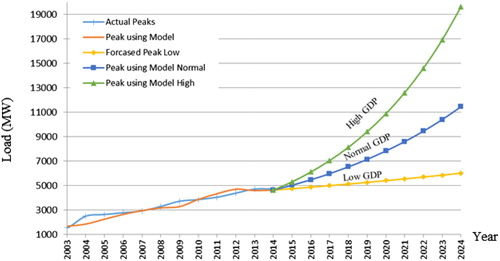
Three scenarios, which are high, normal and low growth, are considered for Bahrain’s GDP. It is intended to forecast the peak load demand for the future using these three scenarios. It is apparent that any mis-prediction regarding the future peak load would risk economic growth, which is not desired by the decision makers. The forecast peak load demand is illustrated in . Similar forecasts for the rest of the GCC member states are shown in . These graphs are produced by using EquationEquations (12)(12)
(12) to Equation(16)
(16)
(16) , respectively, of the forecast models proposed in this study.
Figure 1. Bahrain three scenarios of load forecasted (MW) for 2014 – 2024.
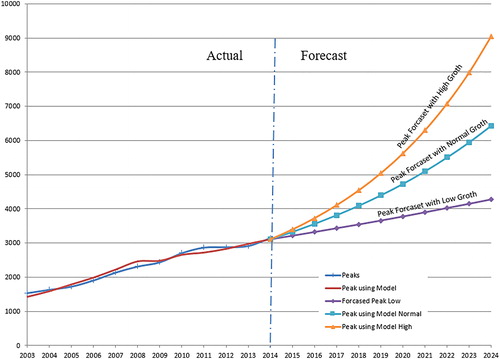
Figure 2. Kuwait three scenarios of the load forecast (MW) for 2014 – 2024.
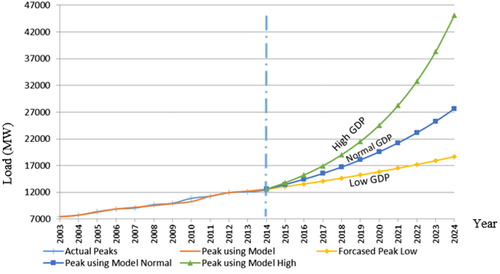
Figure 3. KSA three scenarios of the load forecast (MW) for 2014 – 2024.
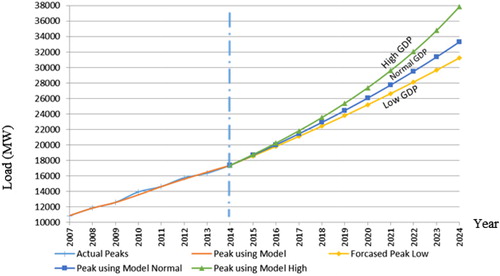
Figure 4. Qatar three scenarios of the load forecast (MW) for 2014 – 2024.
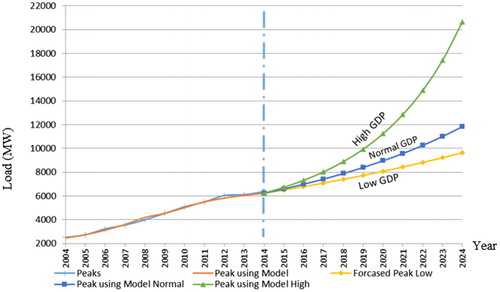
Figure 5. UAE three scenarios of the load forecast (MW) for 2014 – 2024.
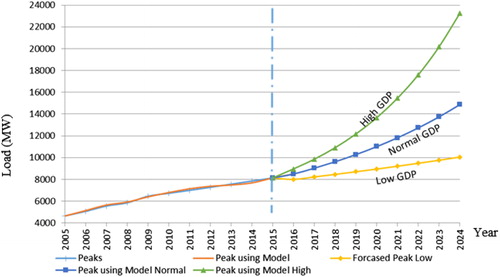
Figure 6. Oman three scenarios of load forecast (MW) for 2014 – 2024.
The models created for the LTLF for the GCC countries are as follows:
(12)
(12)
where P00 = 3044, P10 = 0.001665 and P01 =1.848*10−08
(13)
(13)
where P00 = -2.26*10+04, P10 = 0.001264 and P01 = 1.245*10−09
(14)
(14)
where P00 = 800.6, P10 = 0.002082 and P01 = 4.316*10−09
(15)
(15)
where P00 = 1917, P10 = 0.0003383, and P01=6.302*10−09
(16)
(16)
where P00 = 1688, P10 = -0.0007538, and P01= 7.605*10−08
shows the actual values of the peak loads in GCC countries. When compared with the calculated and obtained results, it was concluded that they are within the calculated values. shows the forecast cumulative growth rate by the GCC Member States that illustrate result presents slower Demand Growth Forecasts than expected. Member States' forecasts have lower demand growth due to lower growth in population and GDP. The data have been collected from (AFESD, Citation2012) and World Bank Data (WBD, Citation2015).
Table 2. Actual Peak Load for GCC Member States (MW).
Table 3. Forecasted Cumulative Growth Rate by GCC Member States.
The results shown in present the forecasted peak load with different expected growth rates of GDP in each member state. It is obvious that the growth rates of these states are not similar, because of differences in economic growth. The variation of the forecasted peak loads clearly indicates the opportunity of having electric power trade among the six member states, because there will be more electricity demand to be fulfilled.
Three scenarios for estimation were for member states’ GDP, which represents high growth, normal growth, and low growth. It is intended with these scenarios to forecast the peak load demand for the future. It is apparent that any mis-prediction regarding the future peak load would risk economic growth, which is not desired by the decision makers so as to avoid higher or lower investments due to wrong estimates for growth.
5.2. Results of ANFIS for estimated peak load demand
The four layers connection for three inputs and one output represent the Neuro-Fuzzy model, which is used to represent the developed estimated peak load model in this study. It is clear that the results have been obtained automatically through the training of data performed in ANFIS (Adaptive Neuro-Fuzzy Inference System).
The three inputs are year (Input 1), population (Input 2) and GDP (Input 3). The output is the peak load for the country.
The actual data collected and presented for member states’ peak demand is used to estimate peak load demand for the coming years generated by the Neuro-Fuzzy model. The output of the given model presents the Neuro-Fuzzy model average results error, which is equal to 0.53% and is less than the multi-regression method, which is almost 2%.
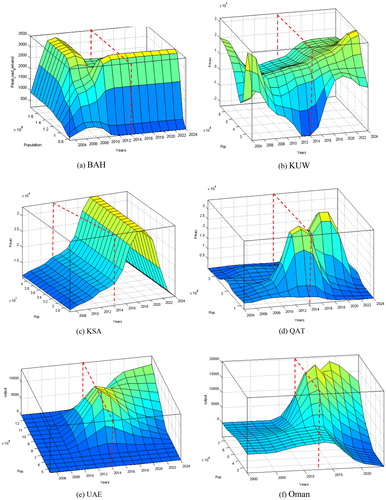
The input-output surface membership function of the maximum peak demand models is presented in . This means that the number of membership functions chosen as three inputs, where the surface view between the inputs and the output of the GCC countries are a non-linear surface and illustrates how the model will respond to varying values of the year.
Figure 7. GCC Surface Sketch for the Output of the Neuro-Fuzzy Models.
Sonika, Darshan, and Daljeet (Citation2015) highlight the artificial intelligence (AI) based methods. These are classified into Neural Networks (NN), Support Vector Machines (SVM), Genetic Algorithms (GA), Wavelet Networks (WN), Fuzzy Logic (FL) and Expert System (ES) methods. The (FL) is a very robust artificial intelligence technique and used in Long Term forecast research. The AI methods have greater accuracy compared to the various methods used in forecasting load. For the economic and secure operation of power systems, the long-term forecasting peak load for the future is very important (Aslan, Yavasca, & Yasar, Citation2011). Simple linear regression (LR) and ANN models were compared in the study and it has been found that the ANN approach has produced better results. The researchers (Vieirat, Dias, & Mota, Citation2003) conclude that the errors produced in their study show that ANFIS achieved fewer errors than in Fuzzy Neural Network (FNN). A study by (Kumari, Khurana, & Yadav, Citation2016) developed a model for load forecasting using two approaches. These approaches are based on the linear regression method (LRM) and the artificial neural network (ANN). The researchers found that the performance of ANN is better than (LRM). Sahin and Erol (Citation2017) conclude that ANFIS has an advantage over both Artificial Neural Network (ANN) and Fuzzy Inference Systems (FIS). In their study, a combination of both ANN and FIS (ANFIS) result in a better-developed method. Finally and based on the previous studies, the ANFIS was selected in the present study because the ANN can obtain results with relatively limited information. The ANFIS, which is applied in the present study, is a modification of the ANN. The ANFIS gives better results than the ANN and the ANFIS can be used as an alternative to MLR. In the present study, the average percentage error for the estimated electric load obtained is close to 0.53% using ANFIS.
The Neuro-Fuzzy has trained input data as well as the associated target values. The trained data can then make predictions of the load based on the relationships learned during training. A real data case study of the load in the GCC countries was used. After the Neuro-Fuzzy is trained using a set of input data, the new data then becomes its input, and the network provides a forecast of the load for future years.
In the present study, ANFIS application of a neuro-fuzzy technique is used for the long-term annual peak-load forecasting. The technique takes into account the uncertainties in the nature of the peak load. The proposed algorithm shows excellent performance.
It is well known that the forecasting of peak loads is one of the important tasks for decision makers since they need this information for the planning of periodic operations, energy trading and facility expansion. This is why forecasting of peak load demand constitutes the central and integral process in the electricity sector to take into consideration all generation planning for this purpose; otherwise, the planned generation capacity may end with over- or under-generation capacity. It should be noted that the GDP data is available in Trading Economics (Citation2015).
6. Conclusion
The developed models present electrical long-term peak load demand forecasting using Multiple Linear Regression and Artificial Neuro-Fuzzy Intelligent System (ANFIS) methods. Both techniques applied, where the average percentage error calculated from the results obtained, are found to be close to 2% and 0.53% in multi linear regression and Neuro-Fuzzy, respectively. The results demonstrate clearly that the obtained models effectively help in finding the estimated future loads and the Neuro-Fuzzy is the most accurate technique compared with Multi Linear Regression. In addition, the present study indicates the high reliability of Neuro-Fuzzy in modelling the maximum estimated load.
For the Population, the maximum percentage error is 5.9% using the linear model, but the exponential model shows 7.1% as a percentage error. For the Peak Load, the maximum percentage error is 4.7% using the linear model, while 6.6% is the error using the exponential model. For the GDP the maximum percentage error is 12.8% using the linear model, while it is 17.8% for the exponential model. The Neuro-Fuzzy results obtained have 1.15% error for the peak load versus years, 1.07% error for the GDP versus peak load and 0.91% error for population versus peak load. The present study discusses models for estimating peak loads and an efficient algorithm to calculate the model parameters of each case. Finally, the developed models of the GCC countries are close to the real values. In addition, the present study helps avoid the huge generation capacity in the long-term plan. This means that the GCC countries will avoid load shedding and meet the energy demand in the different sector(s). Moreover, the developed models help in the economic development of the GCC countries.
Disclosure statement
No potential conflict of interest was reported by the authors.
References
- Al-Muhawesh, T., & Soltan, H. (2011). A methodology for electric power load forecasting. Alexandria Engineering Journal, 50, 137–144. doi:10.1016/j.aej.2011.01.015
- Arab Fund for Economic and Social Development (AFESD). (2012). Feasibility Study of the Electrical Interconnection and Energy Trade between the Arab Countries (B4008314). Milano, Italy: CESI.
- Aslan, Y., Yavasca, S., & Yasar, C. (2011). Long term electric peak load forecasting of Kutahya using different approaches. International Journal on Technical and Physical Problems of Engineering (IJTPE), 3(2), 87–91.
- Bahrain Information and e-Government Authority (2015). Official website for Kingdom of Bahrain. Retrieved from http://www.iga.gov.bh & http://www.data.gov.bh/en/DataSearch/
- Barzin, R., Chen, J. J. J., Young, B. R., & Farid, M. M. (2015). Peak load shifting with energy storage and price-based control system. Energy, 92 (3), 505–514. doi:10.1016/j.energy.2015.05.144
- Boroojeni, K., Amini, M., Bahrami, S., Iyengar, S., Sarwat, A., & Karabasoglu, O. (2017). A novel multi-time-scale modeling for electric power demand forecasting: From short-term to medium-term horizon. Electric Power Systems Research, 142, 58–73. doi:10.1016/j.epsr.2016.08.031
- Dudek, G. (2016). Neural networks for pattern-based short-term load forecasting: A comparative study. Neurocomputing, 205, 64–74. doi:10.1016/j.neucom.2016.04.021
- Graph 4.4.2, Retrieved from http://graph.soft112.com/.
- Jahromi, M. E., & Ameli, M. T. (2018). Measurement-based modelling of composite load using genetic algorithm. Electric Power Systems Research, 158, 82–91. doi:10.1016/j.epsr.2017.12.023
- Kavaklioglu, K. (2011). Modeling and prediction of Turkey’s electricity consumption using support vector regression. Applied Energy, 88(1), 368–375. doi:10.1016/j.apenergy.2010.07.021
- Kaynar, O., Ozekicioglu, H., & Demirkoparan, F. (2017). Forecasting of Turkey’s electricity consumption with support vector regression and Chaotic Particle Swarm Algorithm. Journal of Administrative Sciences, 15(29), 211–224.
- Khwaja, A., Zhang, X., Anpalaga, A., & Venkatesh, B. (2017). Boosted neural networks for improved short-term electric load forecasting. Electric Power Systems Research, 143, 431–437. doi:10.1016/j.epsr.2016.10.067
- Koo, B-G., Lee, S-W., Kim, W., & Park, J. h. (2014). Comparative study of short-term electric load forecasting. In Fifth IEEE International Conference on Intelligent Systems: Modelling and Simulation, Langkawi, 27–29 Jan. 2014. Langkawi, Malaysia: IEEE.
- Kot, R., Rolak, M., & Malinowski, M. (2013). Comparison of maximum peak power tracking algorithms for a small wind turbine. Mathematics and Computers in Simulation, 91, 29–40. doi:10.1016/j.matcom.2013.03.010
- Kumari, M., Khurana, N., & Yadav, N. (2016). Long term load forecasting based on intelligent technique. International Journal of Engineering Applied Sciences and Technology, 1(8), 277–280.
- Lv, J., Pawlak, M., Annakkage, U. D., & Bagen, B. (2018). Statistical testing for load models using measured data. Electric Power Systems Research, 163 (A), 66–72. doi:10.1016/j.epsr.2018.05.026
- Moral-Carcedo, J., & Perez-García, J. (2017). Integrating long-term economic scenarios into peak load forecasting: An application to Spain. International Journal of Energy, 140(1), 682–695. doi:10.1016/j.energy.2017.08.113
- Papic, M., Chmn, Agarwal, S., Bian, J., Billinton, R., Dent, C., … Vadlamudi, V. V. (2014). Effects of Dependent and Common Mode Outages on Reliability of Bulk Electric System – Part II: Outage Data Analysis, presented at IEEE PES General Meeting, 27–31 July 2014. National Harbor, MD: IEEE.
- Qamber, I. S. (2012). Peak load modeling for Kingdom of Bahrain. Journal of Software Engineering and Applications, 05(12), 46–49. doi:10.4236/jsea.2012.512B010
- Ryu, J.-H., Hong, W.-H., & Youn-Kyu, S. (2014). A study of the analysis on the properties of electricity peak load of large hotel building in consideration of energy efficiency. Advanced Science and Technology Letters, 47, 6–10.
- Sahin, M., & Erol, R. (2017). A comparative study of neural networks and ANFIS for forecasting attendance rate of soccer games. Mathematical and Computational Applications, 43, 277–280. doi:10.3390/mca22040043
- Santika, G. D., Mahmudy, W. F., & Naba, A. (2017). Electrical load forecasting using adaptive neuro-fuzzy inference system. International Journal of Advances in Soft Computing and Its Applications, 9(1), 50–69.
- Saravanan, S., Kannan, S., & Thangaraj, C. (2015). Prediction of India’s electricity demand using ANFIS. ICTACT Journal on Soft Computing, 5(3), 985–990.
- Soliman, A. S., & Al-Kandari, A. M. (2010). Electrical load forecasting: Modeling and model construction. Burlington, Massachusetts: Butterworth–Heinemann. Retrieved form: http://www.nazarko.pl/public/data/resource/upload/00003/2531/file/fuzzy-regression-systems-and-fuzzy-linear-models-1.pdf.
- Sonika, D., Darshan, S., & Daljeet, K. (2015). Long term load forecasting using fuzzy logic methodology. International Journal of Advanced Research in Electrical, Electronics and Instrumentation Engineering, 4(6), 5578–5585.
- Tawalbeh, N., & El-Khazali, R. (2012). Peak Load Evaluation Based on the Accumulated Annual Energy. In Proceedings of the 16th IEEE Mediterranean Electro-technical Conference on MELECON 2012, 25–28 March 2012. Yasmine Hammamet Tunisia: IEEE.
- Trading Economics (2015). Bahrain gross domestic product (GDP) data. Retrieved from http://www.tradingeconomics.com/bahrain/gdp.
- Upshaw, C. R., Rhodes, J. D., & Webber, M. E. (2015). Modeling peak load reduction and energy consumption enabled by an integrated thermal energy and water storage system for residential air conditioning systems in Austin. Energy and Buildings, 97, 21–32. doi:10.1016/j.enbuild.2015.03.050
- Vieirat, J., Dias, F., & Mota, A. (2003). Comparison between artificial neural networks and neurofuzzy systems in modeling and control: A case study (pp. 249–255). Aveiro, Portugal: IFAC Intelligent Components and Instruments for Control Applications. doi:10.1016/S1474-6670(17)32543-0
- World Bank Data. (2015). The world Bank Group. World Bank Open Data. Retrieved from http://data.worldbank.org/.
- Zhang, D. (2017). A coefficient of determination for generalized linear models. The American Statistician, 71(4), 310–316. doi:10.1080/00031305.2016.1256839
- Zhang, K., Zhu, H., & Guo, S. (2017). Dependency analysis and improved parameter estimation for dynamic composite load modeling. IEEE Transactions on Power Systems, 32(4), 3287– 3297. doi:10.1109/TPWRS.2016.2623629