
Abstract
Soil contamination is a very relevant environmental problem, which is directly connected with both groundwater and air contamination. Petroleum products represent often a major source of soil contamination. In this sense, leakage of diesel fuel can cause important environmental problems due to the persistence of it in contaminated soils and to its toxicity at low concentrations. Photoionization detectors (PID) have the ability to evaluate the ampleness of contamination by detection and quantification in real time of diesel fuel vapours. Finally, this achievement can lead to a rapid evaluation (in minutes) of soil contamination and will facilitate the application of most suitable remediation technologies. The purpose of this study was to simulate an accidental spill of diesel on the ground, with the aim to monitor the degree of volatilization of chemical compounds during six weeks. Thus, the reasons behind the low volatility of diesel fuel in the investigated soil samples, based on the trend of volatilization and on soil characteristics as well.
1. Introduction
Soil represents the most fertile part of geosphere. It is simultaneously the field where food for living organisms is produced, and the environment for a continuous development of biological processes (Cuadros et al., Citation2013). All agricultural activities take place in the soil. In addition, the soil is the receptor of large amounts of pollutants; since it may act as a filter and place of storage for environmental pollutants which can contaminate water and air as well. Industrial and agricultural activities are most important sources of soil pollution. Oil extraction areas are significant pollution points containing waste oil and wastewater (Ratiu, Beldean-Galea, Bocos-Bintintan, & Costea, Citation2018). The crude oil has the potential to radically alter soil properties, both physical and chemical, as well as biological processes. Sometimes, the impact of oil pollution on ecosystems is far exceeding the intensity of other anthropogenic actions. Diesel fuel is a complex mixture of linear chain alkanes, branched chain alkanes, cycloalkanes and aromatics, mixture that presents a lower volatility compared with gasoline (Clayton & Joseph, Citation2003).
Various specific and nonspecific analytical methods were used for detection and quantification of petroleum hydrocarbons from soil. Gas-chromatography with flame ionization detector (GC-FID), gravimetric determination and infrared spectrometry (IR), thin layer chromatography with mass spectrometry (TLC-MS) and high performance liquid chromatography (HPLC) were used and modified for decades to minimize the interferences, to reduce the amount of solvents and to simplify analytical procedures. For example, it was demonstrated that GC-FID and IR were suitable for detection and quantification of petroleum hydrocarbons from soil samples containing different contamination levels (Clayton & Joseph, Citation2003; Paiga, Mendes, Albergaria, & Delerue-Matos, Citation2012).
However, the same researchers concluded in case of gasoline detection, that the performance of GC-FID was much better than IR, due to less interferences occurring. Moreover, in case of IR, the target component losses during volatilization were noticed. A method based on headspace chromatography together with photoionization detector and flame ionization detector (HS-GC-PID-FID) was for the first time developed for water samples in Brazil (Cavalcante, de Andrade, Marins, & Oliveira, Citation2010). The basic idea of this method was the rapid sampling process, plus no expensive materials or intense laboratory activity needed.
Most of the methods applied for soil contamination control are based on extraction of volatiles organic compounds (VOCs) from soil and further quantification using GC-MS. Head-space analysis, purge and trap analysis, thermal desorption or solvent extraction can be used in this step. In all cases, sampling step is the critical factor in VOCs analysis, because it can lead to the loss of components due to their vapourization during sampling, sample transport, or storage (Meney, Davidson, & Littlejohn, Citation1998). However, a good alternative is a direct, fast detection of the VOC vapours using PID detectors. Thus, the efficiency of a PID-GC-MS system was confirmed (Robbat, Considine, & Antle, Citation2010). PID detector was able to detect the presence or absence of pollutants in real time, while GC-MS quantified the target components from samples in about 5 min. It is worth mentioning that the present study describes direct analysis of pollutants retained inside the soil, without extraction.
PID devices combined with GC/MS were involved in the analysis of environmental pollutants as well. Thus, an integrated system for detecting pollutants on-line in real-time by PID followed by quantitation using GC/MS was described (Siegrist, Citation1992) for volatile coal tar and petroleum hydrocarbons. In another experiment, chronic exposure of the workers in shoe shops to volatile organic compounds contained by adhesives and leatherette was monitored by a PID detector (Bocos-Bintintan, Smolenschi, & Ratiu, Citation2016). Moreover, Ghira, Ratiu, and Bocoş-Binţinţan detected very low levels of pyridine vapours in controlled atmospheres from indoor air (2013), using both PID and IMS (Ion Mobility Spectrometry), which, as well as GC-MS are sensitive and powerful analytical techniques with multiple applications in trace detection (Buszewski, Rațiu, Milanowski, Pomastowski, & Ligor, Citation2018; Moll, Bocoş-Binţinţan, Raţiu, Ruszkiewicz, & Thomas, Citation2012; Ratiu, Bocoş-Binţinţan, Turner, Moll, & Thomas, Citation2014; Ratiu, Ligor, Bocos-Bintintan, & Buszewski, Citation2017; Ratiu, Ligor, Bocos-Bintintan, Al-Suod, et al., Citation2017; Ratiu, Bocos-Bintintan, et al., Citation2017; Ratiu et al., Citation2019). Clayton and Clark, developed a comparative study dedicated to the evaluation of the relationship between a FID and a PID (2003). To evaluate performances of both instruments, the analysis of two clay soil sites contaminated with diesel fuel were realized. The authors concluded that both instruments can be used in the diesel fuel contamination monitoring and that the results can be comparable based on a previously calculated correlation between the two instruments (Clayton & Clark, Citation2003). The difference between our work, and the previous one (Ratiu et al., Citation2019), is that in our study we monitored a trend decreasing profile of contaminated soil samples during 40 days of experimentally campaign, in order to verify the persistence of contamination, while they evaluated comparatively two different analytical instruments with potential to be used in the same field.
As discussed above, soil contamination caused by diesel fuel is of serious concern, for its strong connection to groundwater and air contamination. Moreover, persistence of diesel fuel in soil is higher than in case of gasoline. Because PID devices have the potential to evaluate the ampleness of a contamination with diesel fuel in real time (minutes), this makes it the perfect tool to be used for monitoring of accidental contaminations. In the present study, five different levels of contamination of soil caused by diesel fuel were investigated via simulation, with the aim to monitoring the volatilization process during six weeks. Thus, we succeeded to identify the reasons for the low volatility of diesel fuel in the contaminated soil samples, based on the trend of volatilization and on soil characteristics as well.
2. Materials and methods
The soil was collected from Cluj-Napoca, Romania, sampled from the top soil layer (0–20 cm) using a hand shovel and contaminated with diesel fuel bought from a gas station. Diesel volumes (hence amounts) were accurately measured (using a graduated cylinder) for each container with soil. Subsequently, the diesel fuel in each sample was well mixed to ensure homogeneity. The containers were kept open during the 40 days of experiment, except the time periods of closure for static headspace procedure. For this procedure, for only 30 min before PID analysis containers were sealed with aluminium foil and capped with a metallic lid to reach equilibrium inside the container.
The concentration of volatiles was measured for five different containers (glass jars with a volume of 740 cm3, having a screw metallic lid), with different levels of contamination, using the sensitive PID instrument ppbRAE Plus device model PGM-7620 (made by RAE Systems Inc., USA), during forty days (in May and June). The measurement time in each container was about 30 s, and the equilibration period was 30 min at room temperature.
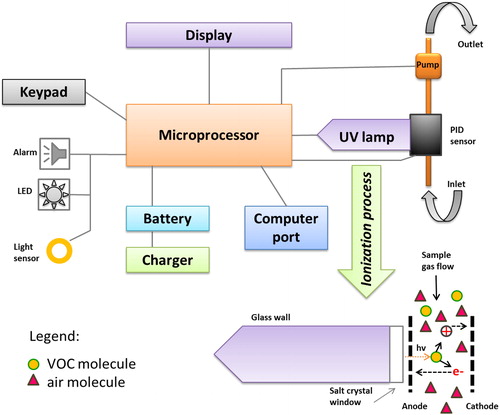
The used PID has a highly compact design (size 21.8 × 7.62 × 5.0 cm), is weighing only 553 g, and is equipped with a standard UV lamp with the photon energy of 10.6 eV. The lamp consists of a glass body, provided with a window transparent to UV radiation at the end; this body is filled with a noble gas (Kr) at reduced pressure. The PID sensor is positioned in the top of the UV lamp. PID uses a pump with a flow rate of 450–550 cm3 min−1. Once the vapours of organic compounds are passing through the sensor and are exposed to the UV photons from the lamp, they are ionized quickly if the energy of the UV photons exceeds the ionization energy of the molecules M; the electrons e- and positive molecular ions M+ generate an ion current, which is then amplified and displayed on the device’s display directly in concentration units (ppbv). The air drawn by the pump is then evacuated through an outlet after passing through the PID sensor (RAE Systems Inc., Citation2003). is a diagram that illustrates both PID detector structure and the occurrence of photoionization process.
Figure 1. Schematic of the photoionization detector PID. The UV lamp, filled with Kr gas at low pressure, generates photons with the energy of 10.6 eV using a RF field that induces and sustains a glow discharge when applied onto a set of two opposite metallic plates placed externally to the lamp body. The lamp is a glass body (1/2” o.d. and ca. 4 cm length) with a soldered disc of material transparent to ultraviolet radiation (MgF2 for 10.6 eV lamps).
Prior to the measurements the PID instrument was calibrated using a standard atmosphere containing 10 ppmv of isobutene in purified air (from a pressure gas cylinder, provided by the manufacturer RAE Systems). PID sensor was cleaned two times during experimental campaign, using anhydrous methanol and an ultrasonic bath. All data, initially stored in the internal memory of the instrument, were transferred to a PC computer using a RS-232 interface and the appropriate software.
3. Results and discussions
PID is a very sensitive, non-expensive, compact and robust instrument, extremely useful for real time detection of volatile organic compounds. However, the major drawback of PID devices is that in case of mixture of components we cannot predict which components are providing the answer displayed on the screen. In fact, in case of mixtures what is measured by a PID instrument is the total amount of photo-ionizable components, and therefore the correction factors in order to obtain the real recorded concentration cannot be used as in the case of a single, known analyte. However, in our experiment we have realized a simulation of controlled contamination with diesel fuel. Knowing the identity of pollutant, the appropriate correction factor (for diesel fuel) was used and consequently the quantities of diesel vapours expressed in ppmv were calculated.
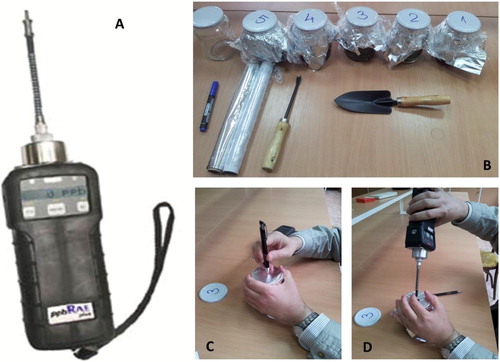
When the containers were filled with the soil sample, about half of the container was kept empty, in order to allow static headspace procedure. Headspace technique was used for sampling vapours of diesel fuel, by covering the container (glass jar) with aluminium foils (0.1 mm thick, in double layer) and then closed with the original metallic lid. Equilibration time of 30 min was given, to allow vapours of diesel fuel to pass from soil matrix into the headspace air (). Finally, the metallic lid was removed, the aluminium foil was carefully to open an orifice of about 8 mm diameter (), through which the PID’s sampling probe was introduced into the container directly, recording the VOCs concentrations in ppmv for about 30 s (). In , PID instrument (A), sealed containers ready for analysis together with the tools used for sample collection (B) and head-space sample sniffing (C and D) can be observed.
Figure 2. PID instrument ppbRAE Plus (A), sealed containers ready for analysis (B) and sample collection using head-space technique (C and D).
The highest concentration of diesel fuel vapours was recorded after about 30 s of air sampling. As described in the materials and methods part, the containers were kept open to air during the six weeks of experiments and covered just before sample collection. The ambient storage temperature was between 18 and 22 °C. The mass of each empty container was 330 g.
Granulometric analysis and soil classification were realized in order to obtain information about soil properties, which can influence persistence of diesel fuel. For example, the density will influence some physical properties such as: water retention capacity, porosity, soil aeration, permeability. Based on the standard procedure SR EN ISO 14688-2/2005, soil samples were classified using an automatic Excel Program (2010). The values of investigated parameters are presented in .
Table 1. Characterization of analyzed soil sample.
According to the granulometric analysis the investigated soil samples were classified into the group of clay with powdery sand. Based on i and p it is soft clay characterized by an average absorption capacity (85%). The degree of humidity indicates a dry ground.
In and , the obtained experimental results from PID are presented. For each sampling day, temperature and the date of sample collection were presented as well. By direct observations it was noticed that both the quantity of diesel fuel added and ambient temperature may have influences on the vapour concentrations recorded. Consequently, using IBM SPSS statistical software package (version 21), a Pearson product-moment correlation analyses was conducted to examine the relationships between quantity of fuel initially added, ambient temperature and concentration of vapours detected. Correlation test highlighted that the quantity of fuel initially added to the samples was strongly positively related to vapour concentration detected: r(17) = 0.955, p = .01, and strongly negatively correlated with ambient temperature r(17) = 0.848, p = .01. These findings indicated that in case of investigated soil samples, the quantity of fuel added explains more variability that does the temperature.
Figure 3. The temporal evolution of diesel fuel vapours profile.
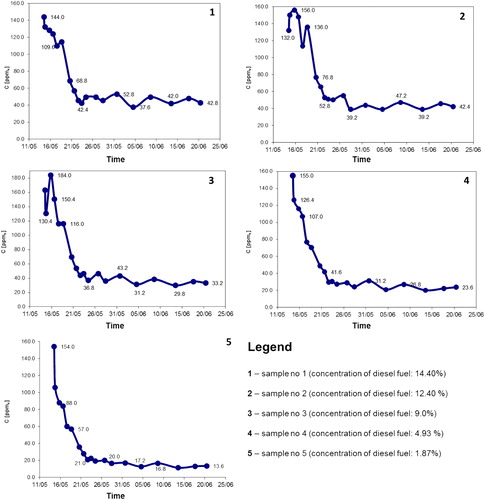
Table 2. Concentrations of diesel fuel recorded during experimental champagne.
In decreasing trend of vapour concentration may be observed for each container, independent by the amount of diesel fuel initially added. In the first part of the experiment a sharp decline with small fluctuations was observed, followed by a slight and continuous decreasing trend in the second period of the experiment. The recorded fluctuations may be caused by the temperature variations in the room where the containers with contaminated soil were kept, which certainly will increase or decrease the volatilization process, or by headspace sample collection process.
After 40 days of experimental campaign, we noticed that fuel vapours still could have been detected in the contaminated soil (from ca. 40 ppmv for the highest initial concentration of diesel fuel, to ca. 10 ppmv for the lowest initial concentration of diesel fuel in soil). This denotes a relatively high persistence of diesel fuel in this specific type of soil (clay with powdery sand) in case of an accidental contamination. This persistence is given by both low volatility of diesel and soil type, which present a high absorption capacity: about 85%. It was found that the soil used as sample (clay with powdery sand) is composed by fine fractions that may retain most of the toxic VOCs. The coexistence of the sandy fraction together with the fine fraction results in an average absorption capacity by 85%. Without the sandy fraction, the volatilization would have taken longer time. However, following the decreasing trend of vapour concentration we can estimate that null values may be obtain in more than several years postcontamination.
4. Conclusions
Soil, defined as a complex physical and biological system, cannot cope with a contamination that exceeds its ability to restore its ecological balance. The experiment presented in this study is a simulation which offers a general view of diesel fuel volatilization in time, without any intervention, conducted under laboratory conditions at a relatively stable temperature. The fast screening method used (PID detection) may offer valuable information about the presence or absence of contamination in real life scenarios, as well as an assessment of pollution amplitude in case of an accidental contamination. In case of facing this situation, a real time response of the order of minutes can be achieved.
Disclosure statement
No potential conflict of interest was reported by the authors.
References
- Bocos-Bintintan, V., Smolenschi, A., & Ratiu, I. A. (2016). Rapid determination of indoor air contaminants in shoe shops using photoionization detectors. Studia UBB Chemia, LXI, 203–212.
- Buszewski, B., Rațiu, I. A., Milanowski, M., Pomastowski, P., & Ligor, T. (2018). The effect of biosilver nanoparticles on different bacterial strains' metabolism reflected in their VOCs profiles. Journal of Breath Research, 12, 027105. doi:10.1088/1752-7163/aa820f
- Cavalcante, R. M., de Andrade, M., Marins, R. V., & Oliveira, L. (2010). Development of a headspace-gas chromatography (HS-GC-PID-FID) method for the determination of VOCs in environmental aqueous matrices: Optimization, verification and elimination of matrix effect and VOC distribution on the Fortaleza Coast, Brazil. Microchemical Journal, 96, 337–343. doi:10.1016/j.microc.2010.05.014
- Clayton, J., & Clark, I. I. (2003). Field detector evaluation of organic clay soils contaminated with diesel fuel. Environmental Forensics, 4, 167–173.
- Clayton, J. C., & Joseph, J. D. (2003). Correlations between PID and FID field analytical instruments in the analysis of soil contaminated with diesel fuel. Soil and Sediment Contamination: An International Journal, 12, 151–164.
- Cuadros, J., Afsin, B., Jadubansa, P., Ardakani, M., Ascaso, C., & Wierzchos, J. (2013). Pathways of volcanic glass alteration in laboratory experiments through inorganic and microbially-mediated processes. Clay Minerals, 48, 423–445. doi:10.1180/claymin.2013.048.3.01
- Ghira, G. B., Ratiu, I. A., & Bocoş-Binţinţan, V. (2013). Fast characterization of pyridine using ion mobility spectrometry and photoionization detection. Environmental Engineering and Management Journal, 12, 251–256. doi:10.30638/eemj.2013.029
- Meney, K. M., Davidson, C. M., & Littlejohn, D. (1998). Use of solid-phase extraction in the determination of benzene, toluene, ethylbenzene, xylene and cumene in spiked soil and investigation of soil spiking methods. The Analyst, 123, 195–200. doi:10.1039/a706258c
- Moll, V. H., Bocoş-Binţinţan, V., Raţiu, I. A., Ruszkiewicz, D., & Thomas, C. (2012). Control of dopants/modifiers in differential mobility spectrometry using a piezoelectric injector. The Analyst, 137, 1458–1465. doi:10.1039/c2an16109e
- Paiga, P., Mendes, L., Albergaria, J. T., & Delerue-Matos, C. M. (2012). Chemical Papers, 8, 711–721.
- RAE Systems Inc. (2003). Operation and maintenance manual. Parts per Billion VOC Monitor PMG-7240 (pp. 8–20).
- Ratiu, I. A., Beldean-Galea, M. S., Bocos-Bintintan, V., & Costea, D. D. (2018). Priority pollutants present in the Tisza river hydrographic basin and their effects on living organisms. Jordan Journal of Chemistry, 13, 15–33.
- Ratiu, I. A., Bocos-Bintintan, V., Patrut, A., Moll, V. H., Turner, M., & Thomas, C. (2017). Discrimination of bacteria by rapid sensing their metabolic volatiles using an aspiration-type ion mobility spectrometer (a-IMS) and gas chromatography-mass spectrometry GC-MS. Analytica Chimica Acta, 982, 209–217. doi:10.1016/j.aca.2017.06.031
- Ratiu, I. A., Bocoş-Binţinţan, V., Turner, M., Moll, V.-H., & Thomas, C. L. P. (2014). Discrimination of chemical profiles of some bacterial species by analyzing culture headspace air samples using TD-GC/MS. Current Analytical Chemistry, 10, 488–497. doi:10.2174/157341101004140701105219
- Ratiu, I. A., Ligor, T., Bocos-Bintintan, V., Al-Suod, H., Kowalkowski, T., Rafińska, K., & Buszewski, B. (2017). The effect of growth medium on an Escherichia coli pathway mirrored into GC/MS profiles. Journal of Breath Research, 11, 036012. doi:10.1088/1752-7163/aa7ba2
- Ratiu, I. A., Ligor, T., Bocos-Bintintan, V., & Buszewski, B. (2017). Mass spectrometric techniques for the analysis of volatile organic compounds emitted from bacteria. Bioanalysis, 9, 1069–1092. doi:10.4155/bio-2017-0051
- Ratiu, I. A., Ligor, T., Bocos-Bintintan, V., Szeliga, J., Machała, K., Jackowski, M., & Buszewski, B. (2019). GC-MS application in determination of volatile profiles emitted by infected and uninfected human tissue. Journal of Breath Research, 13, 026003. doi:10.1088/1752-7163/aaf708
- Robbat, R. Jr., Considine, T., & Antle, P. M. (2010). Subsurface detection of fossil fuel pollutants by photoionization and gas chromatography/mass spectrometry. Chemosphere, 80, 1370–1376. doi:10.1016/j.chemosphere.2010.06.005
- Siegrist, R. L. (1992). Volatile organic compounds in contaminated soils: The nature and validity of the measurement process. Journal of Hazardous Materials, 29, 3–15.