
 ?Mathematical formulae have been encoded as MathML and are displayed in this HTML version using MathJax in order to improve their display. Uncheck the box to turn MathJax off. This feature requires Javascript. Click on a formula to zoom.
Abstract
In the course of this project we were able to develop a wastewater treatment method, column filtration, which turned out to be effective, affordable, and easily implementable. We tested filtration/adsorption process on a mixture of three dyes, methylene blue (MB), crystal violet (CV), and methyl orange (MO) on a column 50 cm of height and 5 cm in diameter. The column material consisted of equal amounts of walnut shells powder (WSP), corn cob powder calcined (CCPC), and pyrophyllite (PY) was proved to be more efficient. The aim of the present study was to optimize and standardize the operational and experimental parameters of the column. A number of tests were carried out to do this by changing the particle size of the adsorbent materials, the percolation debit of the filtrate and the height of the filter bed. The examination by UV-visible spectrometry shows that the removal percentage by 99% was carried out by the diameter of 120 μm predominantly with percolation debit of the filtrate of 50 mL min−1 and the height of column bed of 4.5 cm. When the materials having macroscopic porous structure with a very small grain diameter were used, of small-sized dyes into the filtering medium without being trapped. On the other hand, it is noticed that the efficiency of the adsorption by filtration increases with the increase in the height of the filter bed and decreases with the increase of both the percolation debit and particle size of the adsorbents.
1. Introduction
Nowadays, most of our rivers, lakes, and groundwater are increasingly polluted (Jiang, Zhao, & Zhang, Citation2018). The increasing in agroindustrial activities is putting up an immense pressure on the world’s freshwater reserves (Syahidah, Herlina, & Woei-Jye, Citation2018). The activities in the textile bring about enormous risks; the quantity and the heavy load of the effluents resulting from these activities impose a real problem which influences the environment directly (Gupta, Arunima, & Shilpi, Citation2015; Rossi et al., Citation2017). The release of important quantities of synthetic dyes into wastewater is another serious source of pollution, eutrophication, and nonaesthetic disturbance in aquatic life and; therefore, it becomes a potential bioaccumulation hazard affecting human being severely by transport through the food chain (Flavia, Amadeu, Soares, & Carlos, Citation2018; Roberta et al., Citation2017). This situation causes public concern, legislative problems and it is a remarkable challenge for environmental scientists (Jolanta et al., Citation2016). In addition, dyes, biotransformation products are considered as toxic pollutants via oral ingestion and by inhalation or irritation of the skin and eyes (Ellouze, Tahri, & Ben Amar, Citation2012). They are reckoned both carcinogenic and mutagenic in some cases; this could have an impact on the direct destruction of aquatic living organisms (Hemant, Garima, Arinjay, & Sharma, Citation2017; Saima, Haq Nawaz, Mohammad, Muhammad, & Muhammad, Citation2017). Therefore, it has been of interest to develop low cost methods and materials to remove these colored effluents prior to significant contamination (Mustafa, Tushar, Sharmeen, & Ang, Citation2014). To overcome the environmental problems caused by textile dye, the methods applicable for dye removal in particular may be listed as follows: coagulation/flocculation, oxidation, reverse osmosis, ion exchange, membrane filtration, irradiation and adsorption (Alok, Jyoti, Arti, & Gupta, Citation2010; Ghaedi et al., Citation2015; Gupta, Rajeev, Arunima, Shilpi, & Meenakshi, Citation2011; Gupta, Citation2009; Idrissi et al., Citation2014; Saravanan et al., Citation2016; Tawfik & Gupta, Citation2012). In this respect, each method has its own advantages and disadvantages, but column filtration has been found to be superior to other techniques in terms of simplicity of design and ease of use (Giraudet & Le Cloirec, Citation2017). Large number of waste byproducts: the clays, wood, cotton waste, activated carbon, carob, etc. are used as filter material recently (Güzel, Sayğılı, Gülbahar, & Filiz, Citation2015; Kayode & Olugbenga, Citation2015; Miyah, Idrissi, & Zerrouq, Citation2015; Sabino, Giusy, Mariangela, & Michele, Citation2016).
The main aim of the present study is to optimize the parameters of column filtration for the elimination of three dyes mixture (MB, CV, and MO) by varying the particle size of the materials (120–200 μm), the filter bed height (1.5–4.5 cm), the percolation debit of the filtrate (50–150 mL min−1), pH of the solution (2–12), and ionic strength (0.1–0.5 M of different salts: KCl, CaCl2, and NaCl). The column materials (WSP, CCPC, and PY) have been characterized by zero point charge measurement (pHzpc), scanning electron microscopy (SEM) coupled with energy dispersive X-ray (EDX), and Fourier transform infrared (FTIR) spectroscopies. In addition, the regeneration studies of the materials used were also carried out in order to reuse the materials and not to transfer liquid pollution to the solid one.
2. Materials and methods
2.1. Filtrate used
The filtrate used consists of the mixture of methylene blue (MB), crystal violet (CV), and methyl orange (MO) which were purchased from Ciba Specialty Chemicals Inc. (purity = 99%). These dyes were used without further purification. The molecular structures of the dyes are shown in .
Table 1. Structural formulas of dyes used.
2.2. Used filtered materials
2.2.1. Pyrophillite
The raw Pyrophillite sample used in this study is taken from a natural basin in the southern region of Morocco. The sample was subjected to various hot washes with ultrapure water on a magnetic stirrer (Stuart) to remove nonclay fractions. Afterwards, it was crushed, sieved, and finally dried at 105 °C for 24 hours to obtain the Pyrophillite (PY) sample finally.
2.2.2. Corn cob powder
Corn cob powder derived from corn seed was washed with tap water, crushed, and sieved to obtain fractions of different sizes (120, 150, 200 μm). The powder sample thus obtained was washed several times with ultrapure water and then it was dried in an oven at 100 °C for 48 h, and finally calcined at 300 °C for 2 h to get a corn cob powder calcined (CCPC).
2.2.3. Walnut shells powder
A sufficient quantity of the nuts bark has been collected after the nuts harvest in Moulay Yacoub district, Fez, Morocco. These shells were washed repeatedly with ultrapure water until disappearance of odor, obtaining clear rinsing water and then dried for 24 hours. The shells were ground using a grinder (IKA M20) and sieved to take out the fractions of different sizes to acquire a walnut shells powder (WSP).
2.3. Filtration procedure
The materials used in the present study were characterized by Fourier transform infrared spectroscopy (FTIR) technique in the wavelength range 400–7500 cm−1 (Bruker Vertex70) and scanning electron microscopy (SEM) coupled by energy dispersive X-ray spectroscopy (EDX) for microanalysis of surfaces (Quanta 200 FEI).
The pHzpc has been determined by adding 20 mL of NaCl (5 × 10⁻² mol/L) to 50 mL beaker solutions. The pHi of the solution in each flask was adjusted from 2 to 12 by adding HCl and NaOH (0.1 mol/L) drop wise. Then, 0.2 g of sample was added to each flask. Suspensions were shaken at room temperature for 48 h to attain the equilibrium. Suspensions were filtered using a syringe filter of 0.45 µm and the final pH (pHf) values of the supernatant liquid were recorded (Miyah et al., Citation2015; El Haddad, Slimani, Mamouni, ElAntri, & Lazar, Citation2013).
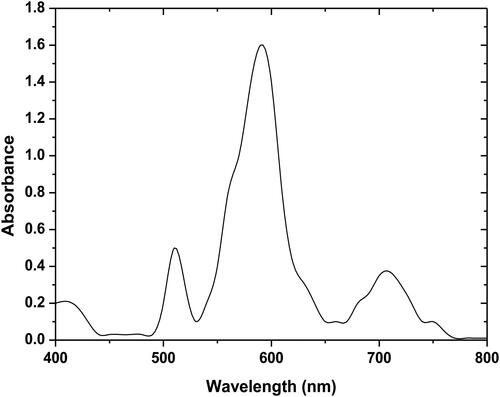
The purpose of the filtration/adsorption is to separate the constituents of a liquid-solid mixture by passing through a filter medium. This operation is much faster than the batch system; it is, therefore, more favored. Moreover, the filtration/adsorption process was tested on a mixture of three dyes (MB, CV, and MO) with a column of 50 cm height and a diameter of 5 cm composing a mixture of supports of equal quantity which was proved to be effective in continuous adsorption when walnut shells powder (WSP), corn cob powder calcined (CCPC), and Pyrophillite (PY) were used in particular. displays that the absorption maximum of the mixture of three dyes was observed at 590 nm using a UV-visible spectrophotometer (Jasco V530). All experiments were repeated twice. The dye removal percentage was calculated using the equation below:
(1)
(1)
where C0 and Ce are the initial and final concentrations (mg/L) of the dye mixture, respectively.
Figure 1. Absorbance spectrum as a function of wavelength.
3. Results and discussion
3.1. Characterization of filtered materials
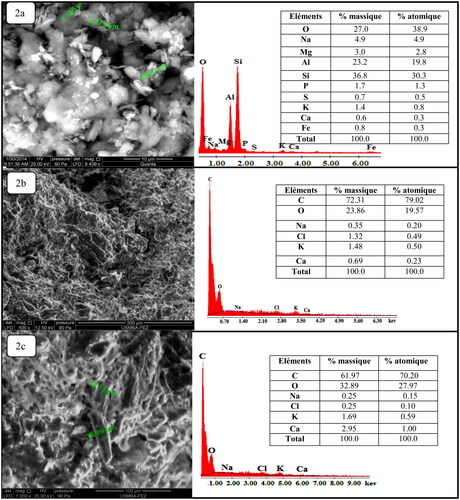
SEM is a technique based on the principle of electron-matter interactions, capable of producing high-resolution images of the sample surface (Abd Mutalib, Rahman, Othman, Ismail, & Jaafar, Citation2017).
The image given in shows that the pyrophillite has a lamellar structure of laminated form and it is also seen that each sheet consists of an octahedral layer of aluminum positioned between two tetrahedral layers of silica (Caglar, Afsin, Tabak, & Eren, Citation2009; Miyah et al., Citation2017). The EDX spectrum corresponding to this image demonstrates the presence of major crystalline elements: Al, Si, Na, Mg, Fe, and Ca. In addition, the images in show that the two materials (CCPC and WSP) have both a similar appearance, an amorphous structure, and a heterogeneous morphology with cellulosic fibers of different sizes which proves the fact that the porous nature of these materials facilitates the adsorption of the dyes. Similar images of an adsorbent material were found by Miyah, Lahrichi, and Idrissi (Citation2016). The EDX spectra corresponding to these images confirm the presence of large amounts of carbon and oxygen and organic nature of the adsorbent materials.
Figure 2. Scanning electron microscopy (SEM) images coupled by EDX of each filter material. (a) Pyrophyllite (PY); (b) corn cob powder calcined (CCPC); (c) walnut shells powder (WSP).
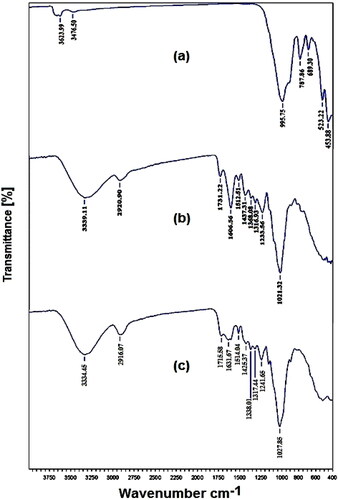
The FTIR spectroscopy allowed the determination of the presence of the specific groups referring to of the characteristic absorption bands of the three filtering materials. presents the infrared spectrum of Pyrophyllite (PY) confirming the presence of specific pyrophyllite bands. The bands located at 3623.99 and 3476.50 cm−1 correspond to the -OH stretching vibration group of the structural water, the 995.75 cm−1 band matches with the valence vibration of the Si-O, the band at 689.30 cm−1 characterizes the Al-O and Si-O vibrational stretches (Koksal, Afsin, Tabak, & Caglar, Citation2011). The last two bands at 523.22 and 453.88 cm−1 correspond to deformation vibrations of O-Si-Al (Janek, Zich, & Naftaly, Citation2014; Miyah et al., Citation2015; Zhang, Yan, & Sheng, Citation2015). The spectrum shown in asserts the presence of characteristic bands of the corn cob powder calcined (CCPC). The band situated at 3334 cm−1 coincides with the stretching vibrations of the hydroxyl groups; the band at 2916 cm−1 is attributed to the stretching vibration of the CH aliphatic molecules and the 1715 cm−1 band may be described as the stretching of the C=O attributed to aldehydes or acid. In addition, the sharp band of 1631 cm−1 is due to the C=C linkage stretching vibration of the olefin structure; the two bands appearing at about 1425 and 1369 cm−1 correspond to the CH end in the bending vibrations in methyl and methylene groups and the bands 1317, 1241, and 1027 cm−1 are assigned to C-O bonding vibrations (Çelekli, Birecikligil, Geyik, & Bozkurt, Citation2012; Durán-Valle, Gómez-Corzo, Pastor-Villegas, & Gómez–Serrano, Citation2005; Ferrero, Citation2007). shows the infrared spectrum of walnut shells powder (WSP). In this case, the band located at 3339 cm−1 corresponds to the stretching vibration of the carboxylic hydroxyl group, the band at 2920 cm−1 is attributed to the stretching vibration of the CH aliphatic molecules, whereas the 1731 cm−1 band corresponds to the stretching of the C=O bond of aldehydes or saturated acid; the two bands at 1613 and 1512 cm−1 are given to the extensional vibration of the C=C bond of the olefin structure, the two bands at about 1368 and 1437 cm−1 corresponds to the C–H in the bending plane of the vibrations in methyl and methylene groups. Finally, the bands located at 1316, 1233, and 1021 cm−1 are assigned to the vibrations of the C–O group (Cao, Lin, Fang, Zhang, & Hu, Citation2014; Dahri et al., Citation2014; Güzel et al., Citation2015; Yang & Qiu, Citation2010).
Figure 3. Fourier transform infrared spectra of tree materials. (a) Pyrophyllite (PY); (b) corn cob powder calcined (CCPC); (c) walnut shells powder (WSP).
3.2. Optimization parameters of the column filtration
Filtration/adsorption has been the subject of several research projects in the field of colored water treatment. Furthermore, shows the efficiency of the adsorbent materials for these dyes removal (MB, CV, and MO).
Table 2. Performance of several adsorbents for removing dyes.
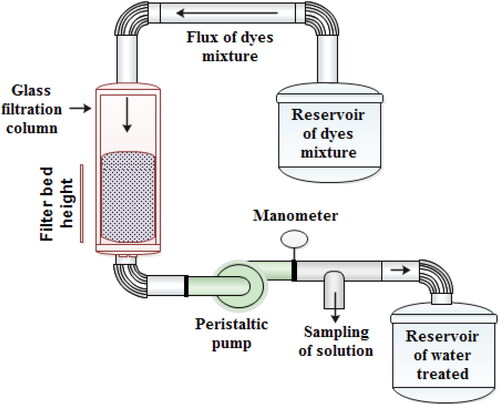
To optimize the operation of the column and to standardize the experimental parameters, a number of tests were carried out when the three paramount parameters were changed ():
Figure 4. Scheme of pilot plant used for column filtration.
The particle size of the adsorbent materials.
The percolation debit of the filtrate.
The filter bed’s height of the adsorbent materials mixture.
The optimum parameters were selected based on the kinetics study by UV-Vis spectrometry.
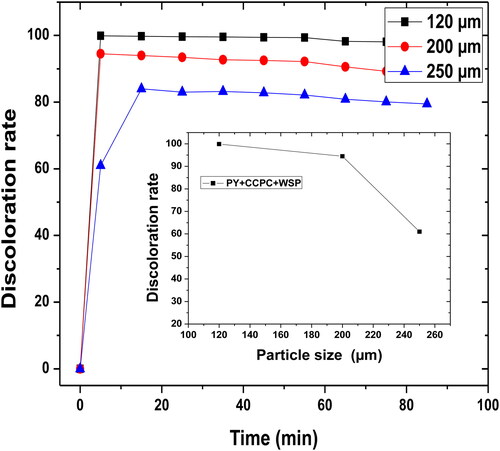
3.3. The effect of the particle size of the adsorbents on the discoloration rate
The best particle size fraction for performing the different dye filtration tests was chosen according to the following operating conditions ():
Figure 5. Particle size effect of the filter materials (PY, WSP, and CCPC) on the discoloration rate. Interval of different size (Ø = 120–200 μm), H = 4.5 cm, D = 50 mL min−1, pH = 6.91 and T = 25 °C.
Mixture of three fractions with a different size: Ø = 120; 150; 200 μm.
Height of the filter bed: H = 4.5 cm.
Percolation debit of the filtrate by the pump: D = 50 mL min−1.
Weight of the various fractions of adsorbent mixtures: W = 43.71 g.
Volume of the mixture of dyes to be treated: V = 10 L.
Dye concentration: [MB] = [CV] = [MO] = 1 g.L−1.
Dose of the filter: [PY] = [WSP] = [CCPC].
pH of the effluent to be treated: pH = 6.91.
Ambient temperature: T = 25 °C.
The particle size effect of the adsorbent mixture (WSP, CCPC, and PY) on the discoloration percentage is shown in . The particle size of the adsorbent materials influences the elimination of the dyes considerably. Indeed, the percentage of dye removal increases with the decrease in particle size.
The following of the dye adsorption by UV-Vis spectrometry shows that the highest elimination percentage is performed in the presence of the particle with the diameter of 120 μm. This optimal percentage by 99.91% was reached at a rigorous surface having many pores and thus, a large specific surface area which allows the adsorption of high amount of dyes. On the other hand, the materials used in the present study possess a macroscopic porous structure with a very small grain diameter at which active sites facilitates the passage of a very large number of small dyes in the filter medium without being trapped. The same conclusion has been reported by some researchers who found that the particle size of the materials which may have considerable amount of the pores in the range of small and medium mesopores plays an important role on the performance of the filtration/adsorption reaction (Caglar et al., Citation2009; Lahoussine-Turcaud, Wiesner, Bottero, & Mallevialle, Citation1992; Mahdi & Sevinç, Citation2016).
3.4. Effect of filtrate percolation debit
After having set the optimum particle size fraction, the second part of the work was to see the effect of the filtrate percolation debit on the discoloration percentage and to determine the one which ensures the best operating conditions. Therefore, the studies were carried out under the conditions given below:
Mixture of three fractions with a different size: Ø = 120 µm.
Height of the filter bed: H = 4.5 cm.
Percolation debit of the filtrate by the pump: D = 50; 100; 150 mL min−1.
Weight of the various fractions of adsorbent mixtures: W = 43.71 g.
Volume of the mixture of dyes to be treated: V = 10 L.
Dye concentration: [BM] = [CV] = [MO] = 1 g.L−1.
Dose of the filter: [PY] = [WSP] = [CCPC].
pH of the effluent to be treated: pH = 6.91.
Ambient temperature: T = 25 °C.
The data shown in indicate that the percentage of dye removal by the filter material (PY + WSP + CCPC) is inversely proportional to the percolation debit of the filtrate by the pump. The discoloration percentage reaches the maximum at the percolation debit of 50 mL min−1 and becomes minimum at the percolation debit of 150 mL min−1.
Figure 6. The effect of filtrate percolation debit by the pump on the discoloration rate. Interval of filtrate percolation debit (D = 50–150 mL min−1), Ø = 120 μm, H = 4.5 cm, pH = 6.91 and T = 25 °C.
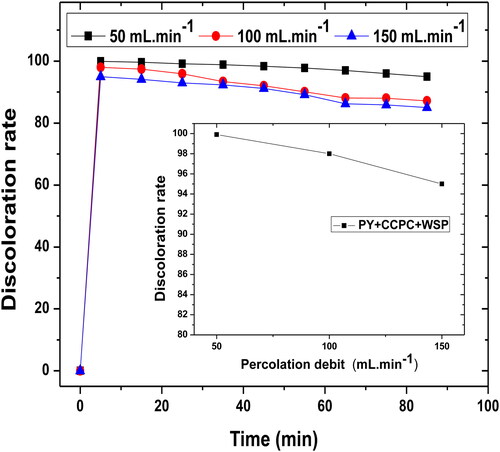
It can be deduced from these results that higher the filtrate percolation lower the residence time of the dyes molecules in the column. Hence, the decrease in the exchange rate results in a loss of filtration efficiency. Increasing the filtrate percolation debit gives rise to a fast saturation of the filter bed which is due to the increase of the exchange rate (Russo, Masiello, Trifuoggi, Di Serio, & Tesser, Citation2016).
3.5. Effect of the filter bed height on the discoloration rate
After the determination of the two parameters (particle size and filtrate percolation debit), the effect of the filter bed height on the discoloration percentage was investigated and the following operating conditions were drawn:
Mixture of three fractions with a different size: Ø = 120 µm.
Height of the filter bed: H = 1.5; 3; 4.5 cm.
Percolation debit of the filtrate: D = 50 mL min−1.
Weight of the various fractions of adsorbent mixtures: W = 20.2; 36; 43.71 g.
Volume of the mixture of dyes to be treated: V = 10 L.
Dye concentration: [BM] = [CV] = [MO] = 1 g.L−1.
Dose of the filter: [PY] = [WSP] = [CCPC].
pH of the effluent to be treated: pH = 6.91.
Ambient temperature: T = 25 °C.
shows that the discoloration rate increases rapidly initially reaching the value of 99.91% and then decreases gradually to the constant value indicating the saturation of filter bed. The discoloration percentage increases with the height of the filter bed. This can be explained by the increase in the number of filtration sites. This situation is in favor of the retention time of the molecules by the coloring matrix.
Figure 7. The effect of filter bed height on discoloration rate. Interval of filter bed height (H = 1.5–4.5 cm), Ø = 120 μm, H = 4.5 cm, D = 50 mL min−1, pH = 6.91 and T = 25 °C.
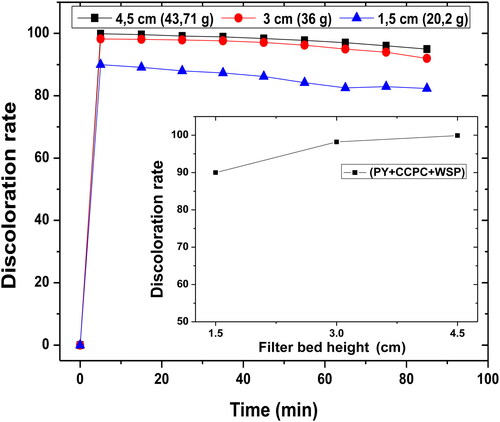
The percentages of dye removal were determined as 90, 98.2, and 99.91% at a filter height of 1.5, 3, and 4.5 cm, respectively. These results demonstrate that higher height of the supports increases the retention rate of the dissolved dyes significantly and reaching a maximum value ultimately. The maximum uptake corresponds to the optimum adsorption capacity of the surface of the adsorbent materials (Johir, Pradhan, Loganathan, Kandasamy, & Vigneswaran, Citation2016).
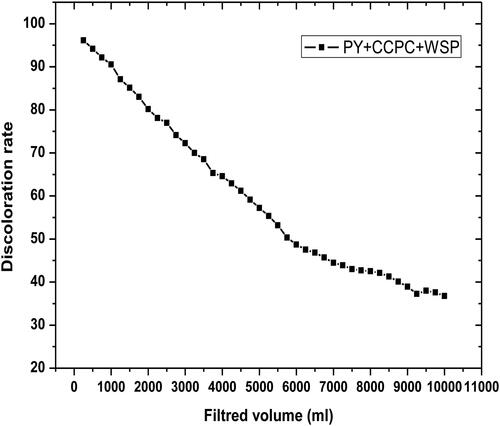
3.6. Effect of filtered volume on the discoloration rate
shows that the discoloration rate decreases with the increase in volume filtered due to filter bed saturation by the dye molecules. Generally, the water contaminated by textile dyes can penetrate into a column filtration system via filter bed while observing a diminution in decolorization rate as a function of filtered volume seeing that the pores saturation of the materials.
Figure 8. The effect of filtered volume on the discoloration rate. Interval of filtered volume (V = 0.05–10 L), pH = 6.91, Ø = 120 μm, H = 4.5 cm, D = 50 mL min−1 and T = 25 °C.
3.7. Effect of the solution pH on the discoloration rate
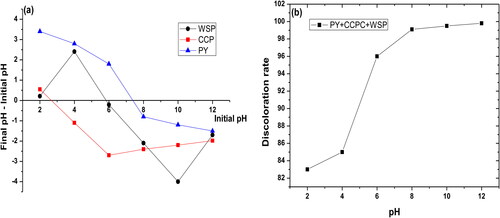
pH is an important parameter affecting not only the protonation and deprotonation of the filter bed surface but also the functional groups of the dye mixture. Additionally, the filtration process of the dye mixture is strongly influenced by the pH of the colored solution which is due to dependence of the mechanisms of ion exchange, complexation or retention by electrostatic forces on pH (Shakoor & Abu, Citation2017). The filtration process of the dye mixture has been studied over a wide range of pH (2–12) under the following conditions: dye concentration ([BM] = [CV] = [MO] = 1 g L−1), percolation debit of the filtrate (D = 50 mL min−1), mixture of three fractions with a different size (Ø = 120 µm) and height of the filter bed (H = 4.5 cm). represents the zero load points of each material that forms the filter bed. In this case, the values in the order of 2.3, 5.8, and 7.3 are obtained for CCP, WSP, and PY, respectively. shows a slight increase in the percentage of the dye mixture removal by the filter bed with the increase of pH. Indeed, for acidic pH values, the cationic dyes (MB and CV), which are in competition with the H+ ions, are present at high concentration in the solution. Consequently, hydronium ions and anionic dye (MO) are, therefore, adsorbed better than the cationic dyes due to the high mobility. Cationic dyes (MB and CV) are eliminated by the OH– ions at basic pH values in parallel with the decrease in the number of H+ ions.
Figure 9. Determination of zero point charge pH (a) (interval of pHi (2–12), mass of the material: W = 0.2 g, particle size: 80 μm, volume of NaCl solution: 20 mL, concentration of NaCl: 5 × 10⁻² mol/L and agitation time 48 h) and the effect of the solution pH on the discoloration rate (b) (interval of pH (2–12), Ø = 120 μm, H = 4.5 cm, D = 50 mL min−1 and T = 25 °C).
3.8. Effect of ionic strength on the column filtration
Textile dyes which contaminate water contain various concentrations of both organic and inorganic ions and usually cations. Therefore, elimination of these dyes by the column filtration method can be performed efficiently by varying the ionic strength of the solution (Miyah, Lahrichi, Idrissi, Khalil, & Zerrouq, Citation2018).
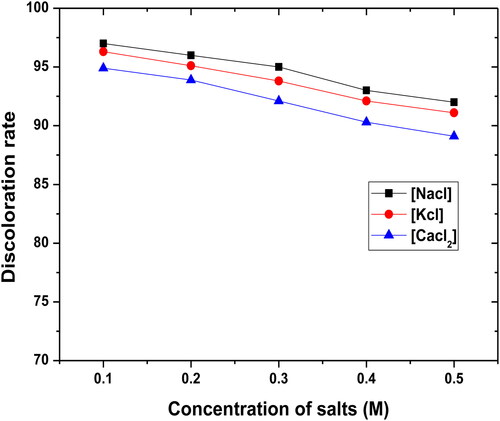
Cations such as Na+, K+, Ca2+, Cu2+, and Mg2+ and anions are found in the form of nitrates, chlorides, sulfates, carbonates, and hydrogen carbonates. To understand the impact of these ions on the process of the dye mixtures by the filter bed consisting of three materials (WSP, CCPC, and PY), different concentrations of KCl, CaCl2, and NaCl (0.1–0.5 M) were added the colored solutions of constant concentration: dye concentration ([BM] = [CV] = [MO] = 1 g.L−1), percolation debit of the filtrate by the pump (D = 50 mL min−1), mixture of three fractions with a different size (Ø = 120µm) and height of the filter bed (H = 4.5 cm).
shows the discoloration rate of the dye mixture as a function of the concentration of each cation. It may be seen that the ionic strength of the electrolyte affects the filtration process of the dye mixture by the filter bed slightly because of the counter effect of the metal ions and the dye molecules in the solution.
Figure 10. Effect of ionic strength. Interval of salts concentration (0.1–0.5 M), initial concentration of mixture dyes: 1 g/L, mass of the material: W = 0.5 g/L, particle size: 80 μm, T = 20 °C and agitation time: 100 min.
3.9. Regeneration of the filter bed
Regeneration process which has both economical and environmental aspects removes dyes from the pores of the adsorbents without destroying the textural structure of the filter bed (Miyah et al., Citation2018). Regeneration costs should be lower than that of producing the original materials. In addition, regenerating the material rather than leaving it as solid waste is an environmentally friendly option since the disposal of the used material can lead to the formation of toxic (El Gamal, Hussein, El-Naas, Renju, & Judd, Citation2018).
The effect of the regeneration on the discoloration rate of the spent dye mixture has been studied under heating the filter bed at 500 °C for 2 h after the filtration. During the filtration tests, under the same operating conditions described previously, new percentage of elimination has been obtained (Miyah et al., Citation2017). Thus, these elimination percentages seem relatively important comparing with the initial adsorption process ().
Figure 11. Effect of regeneration cycle on the discoloration rate of mixture dye. Interval of recycle number: 1–10th cycle, initial of mixture dye concentration: 1 g/L, mass of material: 0.5 g/L, particle size: 80 μm, pH = 6.8, T = 20 °C and agitation time: 100 min.
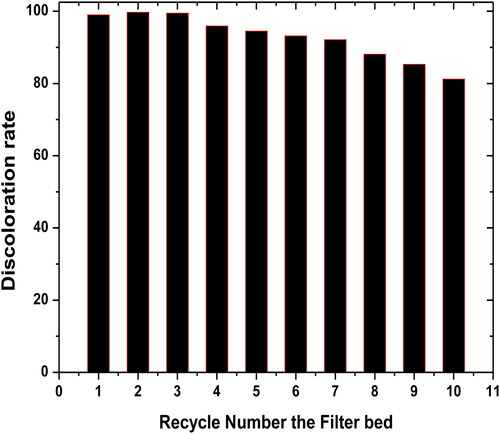
The difference in elimination percentage of the dye mixture from the first regeneration cycle may be attributed to the activation of filter bed during the heat treatment. However, a reduction of elimination percentage has been achieved after the third regeneration cycle of the materials which is the result of the reduction of specific surface area under the effect of successive heating cycles.
4. Conclusion
The best discoloration rate of the mixture of the dyes was determined around the order of 99% by using low cost materials of the diameter of 120 µm with the percolation debit of the filtrate of 50 mL min−1 and a column bed height of 4.5 cm under ecofriendly conditions. On the other hand, the significant surface areas of the column materials offer them a remarkable filtration capacity. Furthermore, the decrease of percolation debit and the increase of the filter bed height lead to the longer residence time which proves that the column filtration is highly important for the removal of the dye mixture. The regeneration of filter bed taking place in the two first cycles leads to an increase of the percentage of elimination by the adsorbent materials. A decrease in the discoloration rate is observed until to the 10th cycle because of the specific surface reduction by the thermal effect.
Acknowledgements
Authors of this work express their sincere thanks to all those who participated in the realization of this present article; especially the technicians of the University Regional Interface Center (URIC) at the High School of Technology of Fez-Morocco, for all analyzes and also to the technicians of the National Center for Scientific and Technical Research (NCSR), Rabat-Morocco.
Disclosure statement
No potential conflict of interest was reported by the author(s).
References
- Abd Mutalib, M., Rahman, M. A., Othman, M. H. D., Ismail, A. F., & Jaafar, J. (2017). Scanning electron microscopy (SEM) and energy-dispersive X-ray (EDX) spectroscopy. In Membrane characterization (pp. 161–179, Chapter 9).
- Ait Ahsaine, H., Zbair, M., Anfar, Z., Naciri, Y., El Haouti, R., El Alem, N., & Ezahri, M. (2018). Cationic dyes adsorption onto high surface area ‘almond shell’ activated carbon: Kinetics, equilibrium isotherms and surface statistical modeling. Materials Today Chemistry, 8, 121–132. doi:10.1016/j.mtchem.2018.03.004
- Alok, M., Jyoti, M., Arti, M., & Gupta, V. K. (2010). Removal and recovery of Chrysoidine Y from aqueous solutions by waste materials. Journal of Colloid and Interface Science, 344(2), 497–507. doi:10.1016/j.jcis.2010.01.007
- Caglar, B., Afsin, B., Tabak, A., & Eren, E. (2009). Characterization of the cation-exchanged bentonite by XRPD, ATR, DTA/TG analyses and BET measurement. Chemical Engineering Journal, 149(1–3), 242–248. doi:10.1016/j.cej.2008.10.028
- Cao, J. S., Lin, J. X., Fang, F., Zhang, M. T., & Hu, Z. R. (2014). A new absorbent by modifying walnut shell for the removal of anionic dye: Kinetic and thermodynamic studies. Bioresource Technology, 163, 199–205. doi:10.1016/j.biortech.2014.04.046
- Çelekli, A., Birecikligil, S. S., Geyik, F., & Bozkurt, H. (2012). Prediction of removal efficiency of Lanaset Red G on walnut husk using artificial neural network model. Bioresource Technology, 103(1), 64–70. doi:10.1016/j.biortech.2011.09.106
- Dahri, M. K., Kooh, M. R. R., & Lim, L. B. L. (2014). Water remediation using low cost adsorbent walnut shell for removal of malachite green: Equilibrium, kinetics, thermodynamic and regeneration studies. Journal of Environmental Chemical Engineering, 2(3), 1434–1444. doi:10.1016/j.jece.2014.07.008
- Durán-Valle, C. J., Gómez-Corzo, M., Pastor-Villegas, J., & Gómez–Serrano, V. (2005). Study of cherry stones as raw material in preparation of carbonaceous adsorbents. Journal of Analytical and Applied Pyrolysis, 73(1), 59–67. doi:10.1016/j.jaap.2004.10.004
- El Gamal, M., Hussein, A. M., El-Naas, M. H., Renju, Z., & Judd, S. (2018). Bio-regeneration of activated carbon: A comprehensive review. Separation and Purification Technology, 197, 345–359. doi:10.1016/j.seppur.2018.01.015
- El Haddad, M., Slimani, R., Mamouni, R., ElAntri, S., & Lazar, S. (2013). Removal of two textile dyes from aqueous solutions onto calcined bones. Journal of the Association of Arab Universities for Basic and Applied Sciences, 14(1), 51–59. doi:10.1016/j.jaubas.2013.03.002
- Ellouze, E., Tahri, N., & Ben Amar, R. (2012). Enhancement of textile wastewater treatment process using nanofiltration. Desalination, 286, 16–23. doi:10.1016/j.desal.2011.09.025
- Ferrero, F. (2007). Dye removal by low cost adsorbents: Hazelnut shells in comparison with wood sawdust. Journal of Hazardous Materials, 142(1–2), 144–152. doi:10.1016/j.jhazmat.2006.07.072
- Flavia, R. A., Amadeu, M. V. M., Soares, D. P. O., & Carlos, G. (2018). Toxicity of dyes to zebrafish at the biochemical level: Cellular energy allocation and neurotoxicity. Environmental Pollution (Barking, Essex 1987), 235, 255–262. doi:10.1016/j.envpol.2017.12.020
- Ghaedi, M., Hajjati, S., Mahmudi, Z., Tyagi, I., Agarwal, S., Maity, A., & Gupta, V. K. (2015). Modeling of competitive ultrasonic assisted removal of the dyes – Methylene blue and Safranin-O using Fe3O4 nanoparticles. Chemical Engineering Journal, 268, 28–37. doi:10.1016/j.cej.2014.12.090
- Giraudet, S., & Le Cloirec, P. (2017). Activated carbon filters for filtration–adsorption. In Activated carbon fiber and textiles (pp. 211–243, Chapter 9).
- Gupta, V. K. (2009). Application of low-cost adsorbents for dye removal – A review. Journal of Environmental Economics and Management, 90, 2313–2342. doi:10.1016/j.jenvman.2008.11.017
- Gupta, V. K., Arunima, N., & Shilpi, A. (2015). Bioadsorbents for remediation of heavy metals: Current status and their future prospects. Environmental Engineering Research, 20 (1), 1–18. doi:10.4491/eer.2015.018
- Gupta, V. K., Rajeev, J., Arunima, N., Shilpi, A., & Meenakshi, S. (2011). Removal of the hazardous dye-Tartrazine by photodegradation on titanium dioxide surface. Materials Science and Engineering: C, 31(5), 1062–1067. doi:10.1016/j.msec.2011.03.006
- Güzel, F., Sayğılı, H., Gülbahar, A. S., & Filiz, K. (2015). New low-cost nanoporous carbonaceous adsorbent developed from carob (Ceratonia siliqua) processing industry waste for the adsorption of anionic textile dye: Characterization, equilibrium and kinetic modeling. Journal of Molecular Liquids, 206, 244–255. doi:10.1016/j.molliq.2015.02.037
- Hemant, S., Garima, C., Arinjay, K. J., & Sharma, S. K. (2017). Adsorptive potential of agricultural wastes for removal of dyes from aqueous solutions. Journal of Environmental Chemical Engineering, 5(1), 122–135. doi:10.1016/j.jece.2016.11.030
- Idrissi, M., Miyah, Y., Chaouch, M., El Ouali Lalami, A., Lairini, S., Nenov, V., & Zerrouq, F. (2014). CWPO of phenol using manganese-based catalysts. Journal of Materials and Environmental Science, 5 (S1), 2309–2313.
- Janek, M., Zich, D., & Naftaly, M. (2014). Terahertz time-domain spectroscopy response of amines and amino acids intercalated smectites in far-infrared region. Materials Chemistry and Physics, 145(3), 278–287. doi:10.1016/j.matchemphys.2014.02.004
- Jiang, Z., Zhao, L., & Zhang, D. X. (2018). Study of adsorption behavior in shale reservoirs under high pressure. Journal of Natural Gas Science and Engineering., 49, 275–285. doi:10.1016/j.jngse.2017.11.009
- Johir, M. A. H., Pradhan, M., Loganathan, P., Kandasamy, J., & Vigneswaran, S. (2016). Phosphate adsorption from wastewater using zirconium (IV) hydroxide: Kinetics, thermodynamics and membrane filtration adsorption hybrid system studies. Journal of Environmental Management, 167, 167–174. doi:10.1016/j.jenvman.2015.11.048
- Jolanta, P., Anna, J. W., Agnieszka, S. C., Kamila, W., Magdalena, K., Jadwiga, S. L., & Joanna, L. O. (2016). Toxicity and dyeing properties of dyes obtained through laccase-mediated synthesis. Journal of Cleaner Production, 112, 4265–4272.
- Kayode, A. A., & Olugbenga, S. B. (2015). Dye sequestration using agricultural wastes as adsorbents. Water Resources and Industry, 12, 8–24.
- Koksal, E., Afsin, B., Tabak, A., & Caglar, B. (2011). Structural characterization of aniline-bentonite composite by FTIR, DTA, TG, and PXRD analyses and BET measurement. Spectroscopy Letters, 44(2), 77–82. doi:10.1080/00387010903555953
- Lahoussine-Turcaud, I. V., Wiesner, M., Bottero, J. Y., & Mallevialle, J. (1992). Coagulation-flocculation with aluminium salts: Influence on the filtration efficacy with microporous membranes. Water Research, 26(5), 695–702. doi:10.1016/0043-1354(92)90247-2
- Mahdi, H., & Sevinç, Ş. S. (2016). Synthesis of graphene oxide/magnesium oxide nanocomposites with high-rate adsorption of methylene blue. Journal of Molecular Liquids, 224, 607–617.
- Mashkoor, F., & Abu, N. (2019). Polyaniline/Tectona grandis sawdust: A novel composite for efficient decontamination of synthetically polluted water containing crystal violet dye. Groundwater for Sustainable Development, 8, 390–401. doi:10.1016/j.gsd.2018.12.008
- Miyah, Y., Idrissi, M., & Zerrouq, F. (2015). Study and modeling of the kinetics methylene blue adsorption on the clay adsorbents (pyrophillite, calcite). Journal of Materials and Environmental Science., 6 (3), 699–712.
- Miyah, Y., Lahrichi, A., & Idrissi, M. (2016). Removal of cationic dye – Methylene blue – From aqueous solution by adsorption onto corn cob powder calcined. Journal of Materials and Environmental Science, 7 (1), 96–104.
- Miyah, Y., Lahrichi, A., Idrissi, M., Boujraf, S., Taouda, H., & Zerrouq, F. (2017). Assessment of adsorption kinetics for removal potential of Crystal Violet dye from aqueous solutions using Moroccan pyrophyllite. Journal of the Association of Arab Universities for Basic and Applied Sciences, 23(1), 20–28. doi:10.1016/j.jaubas.2016.06.001
- Miyah, Y., Lahrichi, A., Idrissi, M., Khalil, A., & Zerrouq, F. (2018). Adsorption of methylene blue dye from aqueous solutions onto walnut shells powder: Equilibrium and kinetic studies. Surfaces and Interfaces, 11, 74–81. doi:10.1016/j.surfin.2018.03.006
- Mustafa, T. Y., Tushar, K. S., Sharmeen, A., & Ang, H. M. (2014). Dye and its removal from aqueous solution by adsorption: A review. Advances in Colloid and Interface Science, 209, 172–184. doi:10.1016/j.cis.2014.04.002
- Roberta, C., Filippo, C., Anna, L., Gregory, C., Claudia, I. C., Matteo, V., … Diego, B. (2017). Aquatic toxicity of several textile dye formulations: Acute and chronic assays with Daphnia magna and Raphidocelis subcapitata. Ecotoxicology and Environmental Safety, 144, 79–87.
- Rossi, T., Silva, P. M. S., Moura, L. F. D., Araújo, M. C., Brito, J. O., & Freeman, H. S. (2017). Waste from eucalyptus wood steaming as a natural dye source for textile fibers. Journal of Cleaner Production, 143, 303–310. doi:10.1016/j.jclepro.2016.12.109
- Russo, V., Masiello, D., Trifuoggi, M., Di Serio, M., & Tesser, R. (2016). Design of an adsorption column for methylene blue abatement over silica: From batch to continuous modeling. Chemical Engineering Journal, 302, 287–295. doi:10.1016/j.cej.2016.05.020
- Sabino, D. G., Giusy, L., Mariangela, G., & Michele, N. (2016). Characteristics and adsorption capacities of low-cost sorbents for wastewater treatment: A review. Sustainable Materials and Technologies, 9, 10–40.
- Saima, N., Haq Nawaz, B., Mohammad, Z., Muhammad, Z., & Muhammad, A. (2017). Removal of actacid orange-RL dye using biocomposites: Modeling studies. Polish Journal of Environmental Studies, 26 (5), 2125–2134.
- Saravanan, R., Elisban, S., Gracia, F., Khan, M. M., Mosquera, E., & Gupta, V. K. (2016). Conducting PANI stimulated ZnO system for visible light photocatalytic degradation of coloured dyes. Journal of Molecular Liquids, 221, 1029–1033. doi:10.1016/j.molliq.2016.06.074
- Shakoor, S., & Abu, N. (2016). Removal of methylene blue dye from artificially contaminated water using citrus limetta peel waste as a very low cost adsorbent. Journal of the Taiwan Institute of Chemical Engineers, 66, 154–163. doi:10.1016/j.jtice.2016.06.009
- Shakoor, S., & Abu, N. (2017). Adsorptive treatment of hazardous methylene blue dye from artificially contaminated water using cucumis sativus peel waste as a low-cost adsorbent. Groundwater for Sustainable Development, 5, 152–159. doi:10.1016/j.gsd.2017.06.005
- Shakoor, S., & Abu, N. (2018a). Adsorptive decontamination of synthetic wastewater containing crystal violet dye by employing Terminalia arjuna sawdust waste. Groundwater for Sustainable Development, 7, 30–38. doi:10.1016/j.gsd.2018.03.004
- Shakoor, S., & Abu, N. (2018b). Utilization of Punica granatum peel as an eco-friendly biosorbent for the removal of methylene blue dye from aqueous solution. Journal of Applied Biotechnology & Bioengineering, 5(4), 242–249. doi:10.15406/jabb.2018.05.00145
- Shakoor, S., & Abu, N. (2019). Utilization of Cucumis sativus peel as an eco-friendly biosorbent for the confiscation of crystal violet dye from artificially contaminated wastewater. Analytical Chemistry Letters, 9(1), 1–19. doi:10.1080/22297928.2019.1588162
- Smitha, T., Santhi, T., Prasad, A. L., & Manonmani, S. (2017). Cucumis sativus used as adsorbent for the removal of dyes from aqueous solution. Arabian Journal of Chemistry, 10 (1), S244–S251. doi:10.1016/j.arabjc.2012.07.030
- Syahidah, N. Z., Herlina, A. R., & Woei-Jye, L. (2018). Detection of contaminants in water supply: A review on state-of-the-art monitoring technologies and their applications. Sensors and Actuators B: Chemical, 255, 2657–2689.
- Tawfik, A. S., & Gupta, V. K. (2012). Photo-catalyzed degradation of hazardous dye methyl orange by use of a composite catalyst consisting of multi-walled carbon nanotubes and titanium dioxide. Journal of Colloid and Interface Science, 371(1), 101–106. doi:10.1016/j.jcis.2011.12.038
- Wu, Y., Su, M., Chen, J., Xu, Z., Tang, J., Chang, X., & Chen, D. (2019). Superior adsorption of methyl orange by h-MoS2 microspheres: Isotherm, kinetics, and thermodynamic studies. Dyes and Pigments, 170, 107591. doi:10.1016/j.dyepig.2019.107591
- Yang, J., & Qiu, K. (2010). Preparation of activated carbons from walnut shells via vacuum chemical activation and their application for methylene blue removal. Chemical Engineering Journal and the Biochemical Engineering Journal, 165(1), 209–217. doi:10.1016/j.cej.2010.09.019
- Zayed, A. M., Abdel Wahed, M. S. M., Essam, A. M., & Mika, S. (2018). Insights on the role of organic matters of some Egyptian clays in methyl orange adsorption: Isotherm and kinetic studies. Applied Clay Science, 166, 49–60. doi:10.1016/j.clay.2018.09.013
- Zhai, L., Bai, Z., Zhu, Y., Wang, B., & Luo, W. (2018). Fabrication of chitosan microspheres for efficient adsorption of methyl orange. Chinese Journal of Chemical Engineering, 26(3), 657–666. doi:10.1016/j.cjche.2017.08.015
- Zhang, J., Yan, J., & Sheng, J. (2015). Dry grinding effect on pyrophyllite-quartz natural mixture and its influence on the structural alternation of pyrophyllite. Micron (Oxford, England: 1993), 71, 1–6. doi:10.1016/j.micron.2014.12.005