
Abstract
Fiber conduction velocity (CV) is a parameter correlated to the physiological membrane properties of the skeletal muscle fibers. Changes in muscle fiber CV are correlated to the gradation of force and fatigue, and can be measured by means of surface electromyography EMG (sEMG). sEMG measurement of CV during muscle contractions requires the correct identification of the skeletal muscle innervation zone (IZ). In superficial muscles, IZ location can be detected using linear electrode arrays and visually identified as the point of inversion of the detected motor unit action potential (MUAP) propagation. In the present work, we present a method for the effective and fast detection of the IZ location, through the following procedures: (1) identification of the target superficial muscle considering the muscle fiber architecture; (2) electrode array selection based on interelectrode distance and number of electrodes; (3) subject training to perform submaximal isometric contractions of the target muscle/s; (4) electrode array positioning along the muscle surface to investigate the IZ position during the contractions by visual identification of MUAP patterns.
1. Introduction
Muscle fatigue is the failure to maintain a certain degree of force under maximal or submaximal sustained contractions (Vollestad, Citation1997). Fatigue arises at the skeletal muscle level but its origin is not exclusively muscular (i.e. peripheral) but also neural (i.e. central) (Bigland-Ritchie et al., Citation1978). In fact, central aspects of fatigue derives from physiological properties of the motor neurons, and insufficient drive from supraspinal sites, resulting in a decrease in motor unit (MU) discharge rate, recruitment and tension development.
Peripheral contributions to muscle fatigue reflect changes that occur locally within the muscle fiber itself (e.g. altered calcium handling at the sarcoplasmic reticulum, increased inorganic phosphate and ADP concentration) and results in the hampered execution of the descending central commands (Allen, Lamb, & Westerblad, Citation2008).
During sustained voluntary contractions, muscle fatigue occurs with changes in the skeletal muscle myoelectric properties that can be recorded. To this aim, the definition of indices associated to the electromyographic (EMG) signal that can be recorded from inside the muscle or applying electrodes on the skin above the selected muscle (sEMG). In particular, sEMG recordings may reflect both central and peripheral neuromuscular properties as the amplitude and the power spectrum of the sEMG signal depends on both muscle fiber membrane properties and on the timing of MU action potential (Farina, Zagari, Gazzoni, & Merletti, Citation2004). In particular, during an isometric constant force contraction, biochemical and physiological changes, mainly due to reduction in intracellular pH, are reflected by a decay in muscle fibers conduction velocity (CV), as demonstrated by several studies in health and disease (Beretta-Piccoli et al., Citation2015, Citation2017; Meduri et al., Citation2016).
Based on the above, an estimation of the rate of change of CV mainly describes muscular fatigue in isometric contractions (Merletti & Farina, Citation2016).
CV can be measured from the time interval between signals detected at least in two sites by multichannel sEMG (Merletti & Farina, Citation2016). In ideal conditions, the delay between analog signals of identical shapes can be estimated from any reference point along the recorded trace. However, these conditions are never verified in practice (Merletti & Parker, Citation2004). In fact, the two detected signals are never identical due to the distribution of conduction velocities of the active MUs. How the action potentials generate and extinct, the fibers orientation with respect to the recording electrode, and/or the heterogeneity of subcutaneous fat layer also contribute to shape changes of the signals during propagation (Merletti & Parker, Citation2004). In particular, an overestimation of CV occurs when the signal approaches the innervation zone (IZ) and the tendon region of the muscle due to non-travelling components (end of fibers effect). Therefore, to minimize these biases, detection of the signal should be obtained between the tendon region and the IZ. Therefore, the correct identification of the anatomical localization of the IZ in the muscle of interest is of crucial importance to correctly proceed with sEMG estimation of CV and its changes due to contractions and fatigue.
An IZ is a portion of the skeletal muscle with bandlike shape in which neuromuscular junctions (NMJ) thicken (Nishimune & Shigemoto, Citation2018).
Different techniques have been used to detect the skeletal muscles IZ. Some of them identifies the neuromuscular structures including the Ach receptors on the post synaptic elements, and others exploit the electrophysiological properties of the neuromuscular innervations (sEMG).
Anatomical localization of NMJ allows the identification of clustered IZs of the fascicles that form the IZ in a band-like area (Kaymak, Kara, Yağiz On, Soylu, & Özçakar, Citation2018). The shape of this area depends from the 3 D architecture of the fibers. For example, the biceps brachii muscle, frequently investigated by using sEMG (Beretta-Piccoli et al., Citation2017; Meduri et al., Citation2016; Negro et al., Citation2018, 2019), contains curvilinear fibers and the IZ appears as a reverse V-shaped band (5–10 mm × 4–6 cm) and the structure is located in the middle between proximal and distal myotendinous junctions. When the muscle has fascicles formed by serially connected fibers a band-like IZ is not found, but NMJ appear scattered (i.e. gracilis or sartorius muscle). When the skeletal muscle displays compartments with different structural features, each of them shows distinct band-like IZ if the fascicles are composed by fibers spanning through (i.e. semitendinosus muscle) (Kaymak et al., Citation2018).
When skeletal muscles are superficial, IZ location can be studied by using multichannel sEMG (Beretta Piccoli et al., Citation2014). Electrode array (linear or two-dimensional) is placed over the skin over the muscle of interest. Instead, IZs of the deep compartments cannot be studied by using this technique. sEMG detection can be done with monopolar electrodes which detect electrical signals generated in the end plate regions and spread towards the ends of the fibers in opposite directions. The amplified difference of two monopolar signals detected by a pair of electrodes is called as differential EMG signal. When IZ is in the bulk muscle between two consecutive electrodes, even when correctly placed along the direction of the muscle, the amplitude of signal generated becomes significantly smaller due to the cancellation of the action potentials spreading in opposite directions. Therefore, due to these constraints, perfect positioning of surface electrodes is mandatory to identify IZs location.
In the present work we present a method to correctly detect IZs in superficial muscles in order to facilitate subsequent measurement of CV and contraction induced changes both in healthy and diseased states.
1.1. Muscle selection
Three aspects are fundamental in selecting the muscles for the IZ identification: muscle depth, muscle architecture, and subcutaneous tissue layers’ thickness. The muscles suitable are superficial as the electrical function of deep muscles is not detectable by sEMG, since the detection volume of a pair of electrodes in bipolar configuration is approximately 10–20 mm (Farina, Cescon, & Merletti, Citation2002)
In addition, fusiform muscles with fibers running parallel to the skin (biceps brachii and trapezius), are suitable for motor unit action potentials (MUAPs) identification and thus identification of the IZ. On the other hand, pinnate muscles with fibers inclined with respect to the skin (gastrocnemius and biceps femoris) produce sEMG that are more difficult to interpret, with no propagation of the signals along the electrodes and no visible IZ. Lastly, the subcutaneous tissue layer thickness can affect the quality of sEMG of superficial muscles because it acts like a band pass filter that dramatically reduces the amplitude of MUAPs with respect to the background noise or power line interference.
1.2. Electrode selection
A proper electrode array should be selected considering the muscle size. Two parameters have to be selected: the number of electrodes and the inter-electrode distance (IED).
The number of electrodes should be large enough in order to have the possibility to observe MUAPs propagation in both directions of the fibers with respect to the innervation zone, thus at least eight electrodes are necessary in the array.
Commercially available electrode arrays have usually 16 electrodes, because the original acquisition boards had 16 channels.
The IED depends on the subcutaneous tissue thickness: in case of muscle with thick subcutaneous layers (e.g. 5–10 mm as in biceps brachii or upper trapezius muscles) it is better to have 10 mm IED, while in case of thin subcutaneous tissues (e.g. 1–2 mm as in abductor pollicis brevis or first dorsal interosseous muscles) it is suggested to use higher spatial resolution (2.5 mm).
It is important to consider that the spatial resolution correspond to half of the IED, thus the operator should decide the optimal IED according to the specific aim of the investigation.
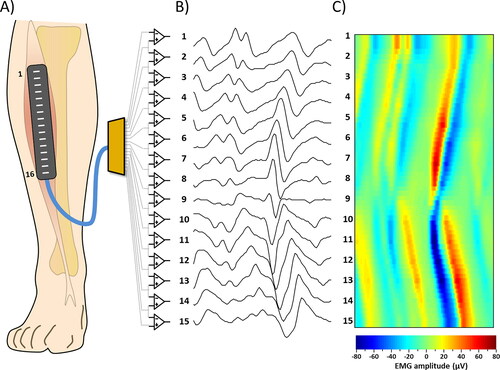
In our study we used a linear array of 16 electrodes in single differential configuration (). The array had an IED of 10 or 5 mm (silver bars, 5 mm long, 1 mm diameter), or 2.5 mm (silver pins, 1 mm long, 1 mm diameter) (OT-Bioelettronica, Turin, Italy).
Figure 1. Examples of sEMG signal detection. (A) Representation of the array of 16 electrodes positioned on the Tibialis Anterior muscle (B) 15 single differential signals obtained by the corresponding instrumentation amplifiers. (C) sEMG signals or the same epoch of panel B represented as an interpolated color map.
Operator and subject were electrically grounded using reference electrodes applied to wrist or ankle.
1.3. Instructions to the subject
To perform EMG acquisition it is suggested to position the subject in order to facilitate the contraction of the selected muscle and place the array over the muscle belly with the electrode array aligned to the muscle fibers. Then, the subject should be instructed to activate the target muscle reducing the activation of adjacent muscles. During recording a constant force isometric contraction is necessary.
1.4. Signals detection and visualization
An array of instrumentation amplifiers with high common mode rejection ratio (CMRR >80dB), which describes the amplifier capability to reject common mode voltages, and low input noise (<1µV RMS) has to be used to amplify the EMG signals. The signals have to be displayed on the screen of a PC in a bi-dimensional representation with time on the x axis and channels on the y-axis. The suggested time scale to see proper MUAP shapes during a contraction is to show epochs of 50 or 100 ms, with a refresh rate of 1 s (thus in real time only 1/10 or 1/20 of the signals is observed) with EMG amplitude normalized with respect to the maximum value of the signals during the epoch (). The signals have to be separated with an offset in the vertical direction in order to avoid superposition of signals from adjacent channels. A color-scale image of the signal (15 rows corresponding to the channels and 2048 columns per seconds) was superimposed to the signals. The image was interpolated of a factor 3 in the vertical direction (resulting in 15*8 = 120 rows) for graphical reasons (). The color image superimposed to the signals allowed to identify the MUAPs as pairs of red and blue diagonal stripes ().
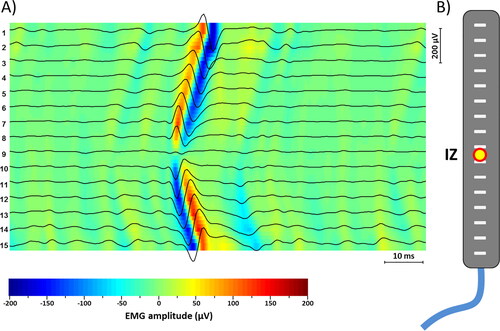
Figure 2. (A) Example of sEMG signal detection with a clearly visible MUAP. The color map. Superimposed to the signals allows an immediate identification of the propagation of the signals (V-shape) and consequent identification of the innervation zone. (B) Representation of the array of 16 electrodes and the location of the innervation zone as a yellow and red circle.
We used a commercially available amplifier (EMG-USB2, OT Bioelettronica, Turin, Italy) with a bandwidth of 10–750 Hz and a gain of 2,000, 5,000, or 10,000 depending on the isometric contraction level. Signals were sampled at 2048 Hz and converted using a 12 bit A/D converter. Samples were visualized during acquisition and then stored in a personal computer using customized software developed at OT Bioelettronica (OTBiolab v2.0).
Prior to electrode placement, the skin was prepared by gentle local abrasion using medical abrasive paste (Everi, Spes Medica, Genova, Italy) and cleaned with water, according to the recommendations for skin preparation (Hermens, Freriks, Disselhorst-Klug, & Rau, Citation2000).
Positioning of the electrode arrays was performed respecting, as much as possible, the muscle fiber direction. The aim was to allow a correct visualization of MUAPs propagation during sEMG recording.
1.5. Submaximal isometric contraction
During the contraction, the array has to be hold in place with Velcro straps or with the hand by the operator or the subject. After each contraction (5–10 s duration) the array is moved transversally and longitudinally along the muscle. In case the signals do not allow clear visualization of the IZ the array has to be slightly rotated in order to align it to the muscle fibers.
1.6. Visual analysis
In our study, detection of IZ was obtained by visual search for a minimal amplitude channel and phase reversal in the single differential signal (Merletti, Farina, & Granata, Citation1999).
Overall, a narrow IZ between two electrodes corresponds to a signal trace with minimal amplitude. If the IZ is underneath one electrode, reversal of the phase appears in the two differential traces coming from the two pairs sharing that electrode (Rainoldi, Melchiorri, & Caruso, Citation2004).
In our case, once the IZ was detected, the corresponding position laterally to the linear electrodes array was marked on the skin of the subject ().
1.7. Examples of surface EMG signals
and show examples of EMG signals detected from superficial skeletal muscles with fibers parallel to the skin. shows examples of good quality signals, where it is easy to identify the IZ location.
Figure 3. Examples of sEMG signals of good quality from two different muscles. (A) Signal recorded from Sterno Cleido Mastoid muscle, where it is possible to recognize the IZ (between channel 4 and 5). (B) Signal recorded from upper trapezius muscle, where IZ is visible on channel 9.
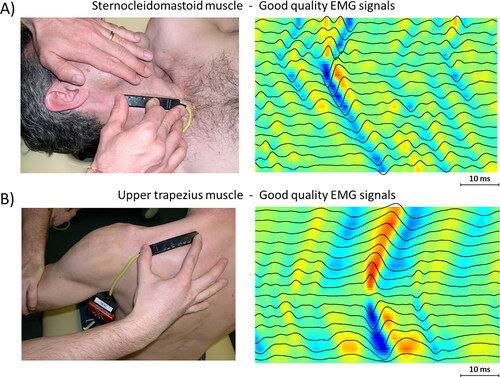
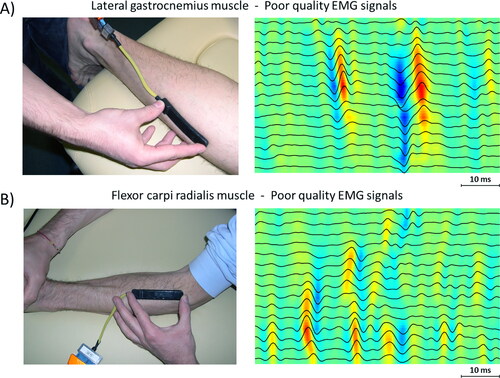
Figure 4. Examples of sEMG signals of poor quality from two different muscles. (A) Signal recorded from Soleus muscle, where it is not possible to identify an IZ (although two MUAPs are clearly visible). (B) Signal recorded from upper Flexor Carpi Radialis muscle, where the EMG signals do not allow identification of IZ.
1.8. Clinical applications
The investigation of the IZ location has been proposed with different aims in both basic research and clinical settings: i.e. to investigate the skeletal muscle anatomy and to describe the IZ morphology (DeFreitas et al., Citation2010; Masuda, Miyano, & Sadoyama, Citation1985; Saitou, Masuda, Michikami, Kojima, & Okada, Citation2000; Shiraishi, Masuda, Sadoyama, & Okada, Citation1995). Similarly, the IZ distribution in a number of muscles has been defined to improve the electrodes placement in sEMG studies (Beretta Piccoli et al., Citation2014; Boccia & Rainoldi, Citation2014)
For the purpose of CV estimation during sEMG recordings, the effect of electrode location with respect to the tendon and IZ has been discussed by many authors (Beretta Piccoli et al., Citation2014; Cescon, Rebecchi, & Merletti, Citation2008; Nielsen, Graven-Nielsen, & Farina, Citation2008; Roy, De Luca, & Schneider, Citation1986; Ye, Beck, & Wages, Citation2015). It is well established that, for getting the best estimates of amplitude, spectral variables, and CV, the electrode location should be selected between the IZ and the tendon (Merletti & Parker, Citation2004). In fact, the IZ and tendon regions determine positive bias in spectral frequency estimates and negative bias in amplitude values and the estimation of CV from regions close to IZ or tendon locations may be completely wrong, due to the absence of potentials traveling in space with similar shape.
The effect of isometric contraction intensities and joint range of motion on the IZ location has been also described (DeFreitas et al., Citation2008, Citation2010; Martin & MacIsaac, Citation2006; Piitulainen, Rantalainen, Linnamo, Komi, & Avela, Citation2009). Additionally, the influence of the electrodes placement over the IZ on sEMG variables has been extensively studied, i.e. (Beck, Housh, Cramer, & Weir, Citation2007; Beck et al., Citation2009; Nishihara et al., Citation2010; Rantalainen, Kłodowski, & Piitulainen, Citation2012). IZ detection has been also proposed to optimize the neuromuscular electrical stimulation of skeletal muscles or to inject neuromuscular blockers like the botulinum toxin (type A) (Wissel et al., 2009; Ward, Citation2008).
In all these studies, the IZs are generally localized according to the bony landmarks whose positions are not modified by the movement of the corresponding joint segments. However, during isometric contractions or electrical activations of the muscle, the IZs shift proximally with the flexion of certain joints (Huang et al., Citation2019; Nishihara, Kawai, Chiba, Kanemura, & Gomi, Citation2013; Piitulainen et al., Citation2009). This phenomenon could be explained by the muscle fibers shortening towards the fixed segment of the joint and/or to the lengthening of the distal tendon.
Knowledge about the IZ position may be also relevant to investigate neuromuscular diseases. Recently with the intent to address the myofascial trigger point physiopathology, the spatial relationship between the IZ and the trigger point has been explored (Barbero et al., Citation2013). Moreover, the biopsy of the IZ may help the diagnosis of different kind of myasthenia (Slater et al., Citation2006). Finally, surgical incisions of muscles may be guided to avoid the IZ, and consequently nerve lesions: for example, in pregnant women, in order to avoid faecal incontinence, the location of IZ of the anal sphincter should be considered prior to episiotomy (Cescon et al., Citation2014).
In this work we described a simple, fast and reliable method to non-invasively detect IZ in superficial muscles.
Disclosure statement
No potential conflict of interest was reported by the author(s).
Additional information
Funding
References
- Allen, D. G., Lamb, G. D., & Westerblad, H. (2008). Skeletal muscle fatigue: Cellular mechanisms. Physiological Reviews, 88(1), 287–332. doi:https://doi.org/10.1152/physrev.00015.2007
- Barbero, M., Cescon, C., Tettamanti, A., Leggero, V., Macmillan, F., Coutts, F., & Gatti, R. (2013). Myofascial trigger points and innervation zone locations in upper trapezius muscles. BMC Musculoskeletal Disorders, 14, 179. doi:https://doi.org/10.1186/1471-2474-14-179
- Beck, T. W., Housh, T. J., Cramer, J. T., Stout, J. R., Ryan, E. D., Herda, T. J., … Defreitas, J. M. (2009). Electrode placement over the innervation zone affects the low-, not the high-frequency portion of the EMG frequency spectrum. Journal of Electromyography and Kinesiology, 19(4), 660–666. doi:https://doi.org/10.1016/j.jelekin.2008.04.001
- Beck, T. W., Housh, T. J., Cramer, J. T., & Weir, J. P. (2007). The effect of the estimated innervation zone on EMG amplitude and center frequency. Medicine and Science in Sports and Exercise, 39(8), 1282–1290. doi:https://doi.org/10.1249/mss.0b013e31806865f2
- Beretta Piccoli, M., Rainoldi, A., Heitz, C., Wüthrich, M., Boccia, G., Tomasoni, E., … Barbero, M. (2014). Innervation zone locations in 43 superficial muscles: Towards a standardization of electrode positioning. Muscle & Nerve, 49(3), 413–421. doi:https://doi.org/10.1002/mus.23934
- Beretta-Piccoli, M., D’Antona, G., Barbero, M., Fisher, B., Dieli-Conwright, C. M., Clijsen, R., & Cescon, C. (2015). Evaluation of central and peripheral fatigue in the quadriceps using fractal dimension and conduction velocity in young females. PLoS One, 10(4), e0123921. doi:https://doi.org/10.1371/journal.pone.0123921
- Beretta-Piccoli, M., D'Antona, G., Zampella, C., Barbero, M., Clijsen, R., & Cescon, C. (2017). Test-retest reliability of muscle fiber conduction velocity and fractal dimension of surface EMG during isometric contractions. Physiological Measurement, 38(4), 616–630. doi:https://doi.org/10.1088/1361-6579/aa614c
- Bigland-Ritchie, B., Jones, D. A., Hosking, G. P., & Edwards, R. H. (1978). Central and peripheral fatigue in sustained maximum voluntary contractions of human quadriceps muscle. Clinical Science and Molecular Medicine, 54(6), 609–614. doi:https://doi.org/10.1042/cs0540609. 657729
- Boccia, G., & Rainoldi, A. (2014). Innervation zones location and optimal electrodes position of obliquus internus and obliquus externus abdominis muscles. Journal of Electromyography and Kinesiology, 24(1), 25–30. doi:https://doi.org/10.1016/j.jelekin.2013.10.017
- Cescon, C., Rebecchi, P., & Merletti, R. (2008). Effect of electrode array position and subcutaneous tissue thickness on conduction velocity estimation in upper trapezius muscle. Journal of Electromyography and Kinesiology, 18(4), 628–636. doi:https://doi.org/10.1016/j.jelekin.2007.01.005 Epub 2007 Mar 21. PMID: 17369051.
- Cescon, C., Riva, D., Zacesta, V., Drusany-Staric, K., Martsidis, K., Protsepko, O., … Merletti, R. (2014). Effect of vaginal delivery on the external anal sphincter muscle innervation pattern evaluated by multichannel surface EMG: Results of the multicentre study TASI-2. International Urogynecology Journal, 25(11), 1491–1499. doi:https://doi.org/10.1007/s00192-014-2375-0
- DeFreitas, J. M., Costa, P. B., Ryan, E. D., Herda, T. J., Cramer, J. T., & Beck, T. W. (2008). An examination of innervation zone movement with increases in isometric torque production. Clinical Neurophysiology, 119(12), 2795–2799. doi:https://doi.org/10.1016/j.clinph.2008.09.021
- DeFreitas, J. M., Costa, P. B., Ryan, E. D., Herda, T. J., Cramer, J. T., & Beck, T. W. (2010). Innervation zone location of the biceps brachii, a comparison between genders and correlation with anthropometric measurements. Journal of Electromyography and Kinesiology, 20(1), 76–80. doi:https://doi.org/10.1016/j.jelekin.2008.09.009
- Edwards, R. H. (1981). Human muscle function and fatigue. Ciba Foundation Symposium. 82:1–18.
- Farina, D., Cescon, C., & Merletti, R. (2002). Influence of anatomical, physical, and detection-system parameters on surface EMG. Biological Cybernetics, 86(6), 445–456. doi:https://doi.org/10.1007/s00422-002-0309-2
- Farina, D., Zagari, D., Gazzoni, M., & Merletti, R. (2004). Reproducibility of muscle-fiber conduction velocity estimates using multichannel surface EMG techniques. Muscle & Nerve, 29(2), 282–291. doi:https://doi.org/10.1002/mus.10547
- Hermens, H. J., Freriks, B., Disselhorst-Klug, C., & Rau, G. (2000). Development of recommendations for SEMG sensors and sensor placement procedures. Journal of Electromyography and Kinesiology, 10(5), 361–374. doi:https://doi.org/10.1016/S1050-6411(00)00027-4
- Huang, C., Klein, C. S., Meng, Z., Zhang, Y., Li, S., & Zhou, P. (2019). Innervation zone distribution of the biceps brachii muscle examined using voluntary and electrically-evoked high-density surface EMG. Journal of Neuroengineering and Rehabilitation, 16(1), 73. doi:https://doi.org/10.1186/s12984-019-0544-6PMID: 31186009; PMCID: PMC6560814.
- Kaymak, B., Kara, M., Yağiz On, A., Soylu, A. R., & Özçakar, L. (2018). Innervation zone targeted botulinum toxin injections. European Journal of Physical and Rehabilitation Medicine, 54(1), 100–109. doi:https://doi.org/10.23736/S1973-9087.17.04663-9 Epub 2017 Mar 6. PMID: 28264545.
- Martin, S., & MacIsaac, D. (2006). Innervation zone shift with changes in joint angle in the brachial biceps. Journal of Electromyography and Kinesiology, 16(2), 144–148. doi:https://doi.org/10.1016/j.jelekin.2005.06.010
- Masuda, T., Miyano, H., & Sadoyama, T. (1985). The position of innervation zones in the biceps brachii investigated by surface electromyography. IEEE Transactions on Bio-Medical Engineering, 32(1), 36–42. doi:https://doi.org/10.1109/TBME.1985.325614
- Meduri, F., Beretta-Piccoli, M., Calanni, L., Segreto, V., Giovanetti, G., Barbero, M., … D’Antona, G. (2016). Inter-gender sEMG evaluation of central and peripheral fatigue in biceps brachii of young healthy subjects. PLoS One, 11(12), e0168443. doi:https://doi.org/10.1371/journal.pone.0168443
- Merletti, R., & Parker, P. J. (2004). Electromyography: Physiology, Engineering, and Non-Invasive Applications. Wiley. doi:https://doi.org/10.1002/0471678384
- Merletti, R., Farina, D., & Granata, A. (1999). Non-invasive assessment of motor unit properties with linear electrode arrays. Electroencephalography and Clinical Neurophysiology. Supplement, 50, 293–300.
- Merletti, R., & Farina, D. (2016). Surface electromyography: Physiology, engineering and applications (1st ed.). Piscataway, NJ: Wiley.
- Negro, M., Perna, S., Spadaccini, D., Castelli, L., Calanni, L., Barbero, M., … D'Antona, G. (2019). Effects of 12 weeks of essential amino acids (EAA)-based multi-ingredient nutritional supplementation on muscle mass, muscle strength, muscle power and fatigue in healthy elderly subjects: A randomized controlled double-blind study. The Journal of Nutrition, Health & Aging, 23(5), 414–424. PMID: 31021358 doi:https://doi.org/10.1007/s12603-019-1163-4
- Negro, M., Segreto, V., Barbero, M., Cescon, C., Castelli, L., Calanni, L., & D'Antona, G. (2018). Essential amino acids (EAA) mixture supplementation: Effects of an acute administration protocol on myoelectric manifestations of fatigue in the biceps brachii after resistance exercise. Frontiers in Physiology, 9, 1140. doi:https://doi.org/10.3389/fphys.2018.01140PMID: 30174620; PMCID: PMC6107748.
- Nielsen, M., Graven-Nielsen, T., & Farina, D. (2008). Effect of innervation-zone distribution on estimates of average muscle-fiber conduction velocity. Muscle & Nerve, 37(1), 68–78. doi:https://doi.org/10.1002/mus.20895 PMID: 17912748.
- Nishihara, K., Chiba, Y., Suzuki, Y., Moriyama, H., Kanemura, N., Ito, T., … Gomi, T. (2010). Effect of position of electrodes relative to the innervation zone onsurface EMG. Journal of Medical Engineering & Technology, 34(2), 141–147. doi:https://doi.org/10.3109/03091900903480754
- Nishihara, K., Kawai, H., Chiba, Y., Kanemura, N., & Gomi, T. (2013). Investigation of innervation zone shift with continuous dynamic muscle contraction. Computational and Mathematical Methods in Medicine, 2013, 174342. doi:https://doi.org/10.1155/2013/174342 Epub 2013 Jun 3. PMID: 23762179; PMCID: PMC3677009.
- Nishimune, H., & Shigemoto, K. (2018). Practical anatomy of the neuromuscular junction in health and disease. Neurologic clinics, 36(2), 231–240. Maydoi:https://doi.org/10.1016/j.ncl.2018.01.009 PMID: 29655446; PMCID: PMC5903580.
- Piitulainen, H., Rantalainen, T., Linnamo, V., Komi, P., & Avela, J. (2009). Innervation zone shift at different levels of isometric contraction in the biceps brachii muscle. Journal of Electromyography and Kinesiology, 19(4), 667–675. doi:https://doi.org/10.1016/j.jelekin.2008.02.007
- Rainoldi, A., Melchiorri, G., & Caruso, I. (2004). A method for positioning electrodes during surface EMG recordings in lower limb muscles. Journal of Neuroscience Methods, 134(1), 37–43. doi:https://doi.org/10.1016/j.jneumeth.2003.10.014
- Rantalainen, T., Kłodowski, A., & Piitulainen, H. (2012). Effect of innervation zones in estimating biceps brachii force-EMG relationship during isometric contraction. Journal of Electromyography and Kinesiology, 22(1), 80–87. doi:https://doi.org/10.1016/j.jelekin.2011.09.012
- Roy, S. H., De Luca, C. J., & Schneider, J. (1986). Effects of electrode location on myoelectric conduction velocity and median frequency estimates. Journal of Applied Physiology, 61(4), 1510–1517. doi:https://doi.org/10.1152/jappl.1986.61.4.1510 PMID: 3781964.
- Saitou, K., Masuda, T., Michikami, D., Kojima, R., & Okada, M. (2000). Innervation zones of the upper and lower limb muscles estimated by using multichannel surface EMG. Journal of Human Ergology, 29(1-2), 35–52.
- Shiraishi, M., Masuda, T., Sadoyama, T., & Okada, M. (1995). Innervation zones in the back muscles investigated by multichannel surface EMG. Journal of Electromyography and Kinesiology, 5(3), 161–167. doi:https://doi.org/10.1016/1050-6411(95)00002-H
- Slater, C. R., Fawcett, P. R., Walls, T. J., Lyons, P. R., Bailey, S. J., Beeson, D., … Gardner-Medwin, D. (2006). Pre- and post-synaptic abnormalities associated with impaired neuromuscular transmission in a group of patients with 'limb-girdle myasthenia'. Brain: A Journal of Neurology, 129(Pt 8), 2061–2076. doi:https://doi.org/10.1093/brain/awl200
- Vollestad, N. K. (1997). Measurement of human muscle fatigue. Journal of Neuroscience Methods, 74(2), 219–227.
- Ward, A. B. (2008). Spasticity treatment with botulinum toxins. Journal of Neural Transmission (Vienna, Austria : 1996), 115(4), 607–616. doi:https://doi.org/10.1007/s00702-007-0833-2. 18389166
- Ye, X., Beck, T. W., & Wages, N. P. (2015). Relationship between innervation zone width and mean muscle fiber conduction velocity during a sustained isometric contraction. Journal of Musculoskeletal & Neuronal Interactions, 15(1), 95–102.