
 ?Mathematical formulae have been encoded as MathML and are displayed in this HTML version using MathJax in order to improve their display. Uncheck the box to turn MathJax off. This feature requires Javascript. Click on a formula to zoom.
Abstract
Europium (Eu) doped zinc oxide (ZnO) nanopowders were successfully synthesized by the solid-state reaction method for three different weight percentages (3%, 5% and 7%) and investigated by using X-ray Powder Diffraction (XRD), Thermo-gravimetric analysis (TGA), Scanning Electron Microscopy (SEM), Transmission Electron Microscopy (TEM) and Fourier Transform Infrared (FTIR) Spectroscopy. Structural investigations showed that the synthesized nanopowders have a high purity of wurtzite structure, characterized by grain size in the range of 20–65 nm. The UV-Vis spectroscopy study shows an increase in the optical absorption from 35 to 70% and a decrease in the band gap from 3.23 to 3.14 eV. The photocatalytic degradation efficiency of the synthesized composite was studied experimentally for the degradation of the MB dye by hydrogen peroxide under UV-Vis irradiation and pH ∼ 6.4. A decolorization of 38% was reached after 30 min of light exposure. The photoluminescence study exhibits a violet, green, and blue emissions whose intensity and wavelength could be controlled by choosing the adequate Eu-doping percentage.
1. Introduction
Metal-oxide-semiconductors such us Zinc Oxide (ZnO), Titanium dioxide (TiO2) and Selenium dioxide (SeO2) have received considerable attention in research and experimental work, for their wide band gap. Zinc oxide (ZnO) is an II-VI semiconductor material whose most of its physical properties in bulk shape have been well known for several decades and has been studied since the mid- 20th century. It aroused the interest of many researchers because of its high electronic mobility (Lv, Chen, Zheng, Huang, & Ding, Citation2015), good thermal, and chemical stability (Mousavi & Heris, Citation2020), and low toxicity (Landsiedel et al., Citation2010). In recent years, research on ZnO nanomaterials had undergone rapid development due to its ability to be used as additive in a large number of products of cosmetics for protection against ultraviolet (UV) (Ponnamma et al., Citation2019), catalytic processes (Landsiedel et al., Citation2010), heterojunction solar cells (Patel et al., Citation2017), white light generation (Karimipour, Sadeghian, & Molaei, Citation2018), magnetic devices (Ren et al., Citation2019), gas sensors (Kumar, Al-Dossary, Kumar, & Umar, Citation2015), etc.
ZnO material exists in two different crystallographic structures; hexagonal wurtzite and cubic blende (Ashrafi & Jagadish, Citation2007) and can be synthesized in powder or thin film shape by using different techniques such as pulsed laser ablation (Gondal, Drmosh, Yamani, & Saleh, Citation2009), co-precipitation method (Wang, Zhang, & Hou, Citation2018), solid state reaction (Zhu & Zhou, Citation2008), sol-gel method (Chebil et al., Citation2015), hydrothermal method (Shaat, Musleh, Zayed, Asad, & AlDaho udi, Citation2020). In addition to these techniques, nowadays its synthesis focuses on using a green process as reported by Shashanka, Esgin, Yilmaz, and Caglar (Citation2020) who synthesized ZnO nanoparticles through Tilia Tomentosa (Ihlamur) leaves extract calcined at 400 °C for 15 min or the work of Rathnasamy, Thangasamy, Thangamuthu, Sampath, and Alagan (Citation2017) who synthesized ZnO nanoparticles in hexagonal wurtzite structure using Carica papaya leaf extract.
With regard to the role of ZnO in photovoltaic devices and photocatalysts, it acts as an important semiconductor that plays the role of electron-photon transformer and if the principal matter has only a single p-n junction the maximum attainable efficiency cannot exceed 30% due to its feeble optical absorption. Consequently, and in order to improve its optoelectronic and photocatalytic properties, the ZnO has been doped with different materials such as alkali metals (Mirabbaszadeh, Ahmadi, Khosravi, Mokhtari, & Salari, Citation2013), alkaline earth metals (Mahdhi, Djessas, & Ben Ayadi, Citation2018), transition metals (Ashokkumar & Muthukumaran, Citation2014; Salem, Akir, Ghrib, Daoudi, & Gaidi, Citation2016), and rare-earth metals (Ashtaputre et al., Citation2008; Khataee et al., Citation2014; Kumar, Suman, Kumar, & Kumar, Citation2016; Phuruangrat, Yayapao, Thongtem, & Thongtem, Citation2014; Shinde et al., Citation2014; Vijayaprasath et al., Citation2015; Yadav, Sinha, Goel, & Kumar, Citation2016). Rare-earth ions can be used as activators owing to their emission range which can be adjusted relative to the host lattice to achieve white light emission. Europium element is one of lanthanide's series, of electron configuration [Xe] 4f7 6s2 ionizes in trivalent form (Eu3+) with the loss of one electron from the 4f and the two 6 s2 electrons making 4f partially filled with electrons- which could be responsible for their optical and magnetic properties. Therefore, further research work has focused on the doping of ZnO with Eu3+ ions in order to adjust their properties according to the desired applications. Phuruangrat et al. (Citation2014) synthesized Eu-doped ZnO with a single crystalline structure by sonochemical method to investigate the photocatalytic activity for the removal of methylene blue and they showed that the decolorization efficiency was reached 90.5% for 3% doping of Eu within 300 min. Ashtaputre et al. (Citation2008) synthesized Eu-doped ZnO nanoparticles by using chemical route that was characterized by broad white light photoluminescence originated from ZnO and the intra-4f transitions of Eu3+ ions.
Many works have studied the effect of various operational parameters on the photodegradation performance of certain photocatalysts (Ahmad, Citation2019; Anju Chanu, Joychandra Singh, Jugeshwar Singh, & Nomita Dev, Citation2019; Du et al., Citation2017; Isai & Shrivastava, Citation2019; Sehar et al., Citation2021; Younis, Shirsath, Shabbir, & Li, Citation2018), such as the effect of the pH of the dye solution, the concentration of the photocatalyst and the UV irradiation duration. Anju Chanu et al. (Citation2019) examined the Mn-doped ZnO nanoparticles and investigated the effect the initial methylene blue (MB) dye concentration, of amount of catalyst, and the initial pH dye degradation rate; they showed that the optimum conditions to achieve 99% of MB degradation after 120 min irradiation duration consist of a pH = 10, initial MB concentration 10 ppm and catalyst concentration 0.3 g/L. Isai and Shrivastava (Citation2019) investigated the effect of various parameters such as catalyst dose, contact time and pH of dye solution and they demonstrated that, the maximum degradation was obtained for 2%Fe–ZnO was 92% for an initial dye concentration 10 mg/L and pH = 2. Ahmad (Citation2019) synthesized ytterbium and erbium co-doped ZnO photocatalysts by combustion method, and tested in photocatalytic degradation of methyl orange (MO), they showed that by varying the photocatalyst loading from 1 to 7 g.L−1, the complete MO degradation under visible light irradiation can be occurred in just 90 minutes for 6 g.L−1 and by studying the effect of initial pH of MO dye solution they found that photo-degradation is optimum at pH = 11.
In this work, pure and Eu-doped ZnO nanopowders were prepared with different Eu-concentration (3, 5 and 7% wt) using solid state reaction. The obtained composite product was investigated by various advanced analytical techniques. The obtained composite was tested for photocatalytic applications on methylene blue dye solution of pH∼6.4.
2. Experimental procedures
2.1. Sample preparation
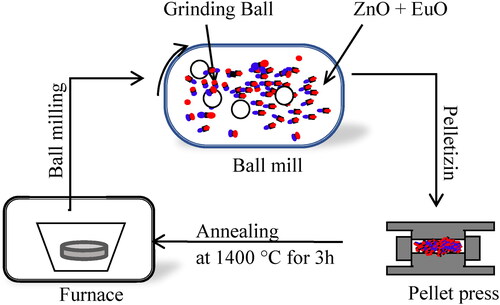
Pure ZnO powder with nanosized particles were synthesized by solid-state reaction method through the process indicated in in which commercial ZnO nano-powder (Sigma-Aldrich, 99.9%) was first ground by a ball milling apparatus (Retsch, Emax) twice for 1 hour at a vibration speed of 1000 rpm and mixed with Europium(III) oxide Eu2O3 nano powder (Sigma-Aldrich, 99.99%) in well-pandered quantities to synthesize four different samples; undoped ZnO nanopowder and three Eu-doped ZnO samples with different doping content of Eu (3, 5 and 7% wt), The nanopaowder was pelletized and placed in alumina crucibles, suitable for high-temperature annealing and then annealed under air atmosphere in an electronic furnace for 3 hours at 1400 °C. The furnace heated gradually from room temperature with a ramp speed of 20 °C/min to 1400 °C then cooled after calcination to room temperature gradually with a cooling rate of 5 °C/min. After cooling, the samples were crushed again in ball milling apparatus with 1000 rpm speed for 1 hour to obtain fine powder. The obtained powder was pelletized, annealed, and ground in the same conditions and calcined again for 1 h at 600°C and then crushed manually for 10 minutes to get a smoother and softer shape. The obtained composite samples were analyzed using the techniques described below.
Figure 1. Schematic experimental protocol for the preparation of Eu-doped ZnO nanopowders.
2.2. Characterization techniques
The surface morphology as well the shape and mean grain size of Eu-doped zinc oxide were analyzed via scanning electron microscope (20 kV SEM, FEI, Inspect S50) and Transmission electron microscope (80 kV TEM, FEI, Morgagni 268). Thermal stability and degradation were investigated in thermal gravimetric and differential thermogravimetric (Shimadzu DTG-60H) analysis instrument in the 20–600 °C range at a rate of 12 °C/5 min in atmospheric air. The crystal structures were carried out using a X-Ray diffractometer (XRD-7000, Shimadzu) running at 40 kV and 30 mA with Cu-Kα radiation (λ = 1.5406 Å) in the 2 range from 20
to 70
with a scanning speed of 0.02
/s. An infrared Fourier transform spectrophotometer (IRAffinity-2, Shimadzu) in the 400–4000 cm−1 wavenumber range with 2 cm−1 resolution, was used to specify the intramolecular bonds related to the prepared material. UV–VIS–NIR spectrophotometer (3700, Shimadzu) was used to accomplish diffuse reflectance spectroscopy in the wavelength range of 200–900 nm. Spectrofluorometer 8500 (Fluorolog FL3-iHR, HORIBA Jobin Yvon) was used to measure the photoluminescence (PL) emission spectra. UV-Vis double beam PC 8 scanning auto cell spectrophotometer (UVD-3200) with 15 W halogen lamp as a UV-light source was used to measure the photocatalytic efficiency in wavelength range of 400–800 nm.
3. Results and discussion
3.1. Thermal gravimetric analysis (TGA)
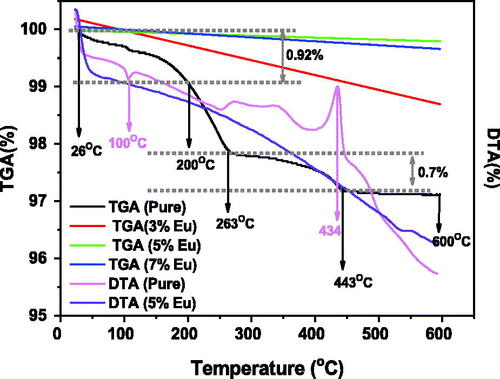
Thermogravimetric analysis (TGA) and Differential thermal analysis (DTA) measure the weight loss of a heated material as a function of temperature to determine a material's thermal stability and its content on gas, moister and impurities. shows the variation of TGA and DTA in the temperature range 25–600 °C for both pure and Eu-doped ZnO samples at a heating rate of 12.5 °C/5 min. The first observed stage ranges from 26 °C to 200 °C, showed the occurrence of an endothermal peak that was observed in the DTA curve at 100 °C accompanied with a small weight loss of about 0.92% in the TGA curve. Which might attributed to the evaporation of water adsorbed by the material from the surrounding environment (Isai & Shrivastava, Citation2019). The second stage spans from 265 to 443 °C showed an exothermal peak at 434 °C in the DTA curve accompanied with a weight loss of about 0.7% which may be due to the phase transformation and crystallization of the ZnO material (Ahmad, Citation2019). In the last thermal stage extending between 443 °C and 600 °C, there is a small mass loss without any peaks in the DTA curve indicating that the material undergo calcination for a temperature in the order of 450 °C and will be stable above 600 °C and conserves its stability for any uses in any temperature after the heat treatment reached 1400 °C.
Figure 2. TGA and DTA curves of ZnO and Eu-doped ZnO samples with different Eu concentrations.
3.2. X-ray diffraction (XRD)
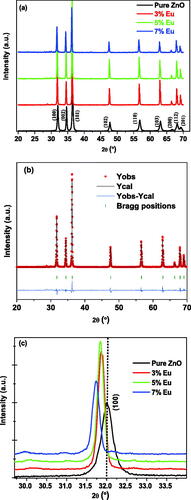
X-ray diffraction (XRD) was used to study the crystallinity, phase composition and particle size of a material. illustrates XRD patterns of pure and Eu-doped ZnO samples at room temperature. It can be noticed that the peaks (100), (002), (101), (102), (110), (103), (200), (112) and (201) appeared at 2θ angles 31.83°, 34.48°, 36.31°, 47.59°, 56.64°, 62.91°, 66,42°, 68.00° and 69.10° respectively, indicating according to JCPDS, NO 77-0452 data that the prepared ZnO material has a high purity with hexagonal wurtzite structure (Rami, Patel, Patel, & Patel, Citation2020) as confirmed by the Rietveld refinement as shown in .
Figure 3. XRD patterns of undoped and Eu- doped ZnO samples (a), (b) Rietveld refinement of X-ray diffraction pattern of 5% Eu-doped ZnO nanopowder, Zoom on (100) peaks in the XRD patterns for the undoped and Eu-doped ZnO (c).
Generally, Eu2+ ions can be inserted in the ZnO lattice either at octahedral or tetrahedral interstitial sites or by replacing the zinc ion (Zn2+) at substitutional sites. By comparing the radii of the octahedral site (99 pm), the tetrahedral site (60 pm), Eu3+ ion (108 pm) and Zn (74 pm), it was noted that Eu3+ can be inserted easily in the octahedral site compared to other ones due to the convergence between the two radii. The insertion process would be accompanied by the apparition of new peaks in the XRD patterns, but in this investigation not a single peak was noticed, which implies that the Eu doping was done by substitution process. This behavior might be attributed to the activation energy barrier which is higher in the case of insertion process compared to that of the substituted one (Rajput & Pandey, Citation2017).
Zooming on some peaks related to the doped materials such as (100) presented in , shows that some peaks occurred small left-shift compared to the pure one which confirms the substitution process between certain Zn atoms by those of Europium.
The analysis of the relative peak intensity shows an increase for the 3% and 5% Eu doping percentage but was regressed for 7%, which indicates an increase in the crystallinity of the prepared materials with a doping percentage 3% and 5% but decreases for that doped with 7%. This behavior can be affirmed by studying the evolution of certain other crystal parameters such as the unit cell volume, grain size and/or the micro-strain.
The difference between the Zn and Eu3+ radius may affect the value of the lattice parameters (a and c), the unit cell volume V and bond length which are calculated using the following expressions (Korake, Kadam, & Garadkar, Citation2014):
(1)
(1)
(2)
(2)
(3)
(3)
Where and u are the inter-planar distance and a displacement parameter, are given by:
(4)
(4)
(5)
(5)
The calculated values are listed in , which imply that the lattice parameters, unit cell volume and bond length increase altogether with the Eu percentage suggesting a ZnO lattice expansion.
Table 1. Band gap energy, lattice parameters, unit cell volume, bond length, micro-strain and grain size of the undoped and Eu-doped ZnO samples.
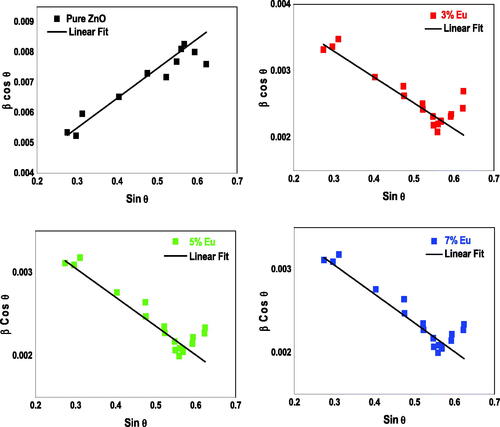
This expansion may cause some internal micro-strain which can be determined by using the Williamson–Hall equation (Shannon, Citation1976):
(6)
(6)
λ (∼ 0.1540 nm) is the Cu-Kα radiation wavelength, β is the peak width at half-maximum, k = 0.9 is a constant and, D is the grain size estimated by using the Debye-Scherrer’s formula given by (Vinoditha et al., Citation2019):
(7)
(7)
The results showed that the crystallite size increased from 20.31 nm for the pure ZnO to 61.85 nm, 65.00 nm and 57.57 nm for 3, 5 and 7 wt% Eu-doping percentages respectively. This trend can be interpreted by the fact that for the small amount of the Eu3+ ions the nucleation is stimulated, and the growth process tends to the apparition of nano crystallites whose size increase with the doping percentage due to the bigger radius of Eu3+ than that of Zn2+ . That leads to crystal cell’ volume increase and therefore increase of the grain size. However, for higher Eu density, the decrease of crystallite size values can be associated to the low solubility of Eu3+ions into the ZnO lattice (Williamson & Hall, Citation1953). This annihilation of the solubility leads to the formation of a thin insulating Eu2O3 layer segregating the ZnO nanoparticles surface and thus inhibiting its growth process. The Eu2O3 thin film has high surface tension which causes a distortion in the crystal lattice and therefore reduces the grain size and thus acts as a fine structural stabilizer to conserve or reduce the grain size. This result is in agreement with that obtained by Williamson and Hall (Citation1953) who synthetized Zn1-xEuxO nanoparticles by direct wet chemical synthesis method and showed that the grain size was increased for Eu doping percentage smaller than 0.1 mol% from 61 to 74 nm and decreased for the Eu-densities 0.5, 1 and 2.5 mol% from 52 to 37 nm. The results confirmed by high-resolution transmission electron microscopy (HRTEM) and selected area electron diffraction (SAED) analysis the formation of thin Eu2O3 thin film on the Zn1-xEuxO nanoparticles for the high doping percentage.
shows the Williamson–Hall plots for the pure and Eu-doped ZnO samples whose slope allows to deduce the micro-strain value. The negative value can be attributed to the large size of the Eu3+ radius that produces compressive strain in the crystal lattice after substitution with the Zn atom which maximum for 5% Eu. These results are in good agreement with those reported by Korake et al. (Citation2014), who synthetized Eu-doped ZnO nanoparticles by hydrothermal technique with 1, 3 and 5 wt% Eu-doping percentages and revealed a maximum compressive strain in the crystal lattice for 5% Eu-doping percentage.
Figure 4. Williamson–Hall plots for the undoped (a) and Eu-doped ZnO samples (b, c and d).
3.3. Microscopy analysis
The shape and morphology of the obtained material was investigated by scanning electron microscope (SEM) The morphological properties of the prepared undoped and Eu-doped ZnO powders were investigated with SEM at a magnification of 10k times as shown in .
Figure 5. SEM images of the prepared nanopowders: undoped (a) and Eu-doped ZnO samples.
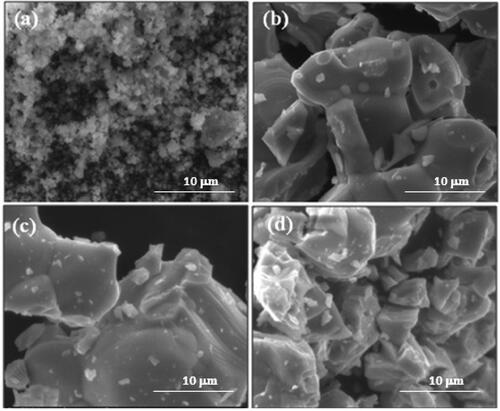
shows that the particles of the pure ZnO sample were spherical in shapes. Particles agglomerated were also observed. While the doped samples showed. broad size distribution and. irregular shapes of particles. These indicated greater surface area for the undoped ZnO compared to the doped ones, also confirmed the good calcination and crystallization of the Eu-ZnO nanoparticles which was indicated by increasing the Eu doping concentration, The large particles size was noted at 5% doping.
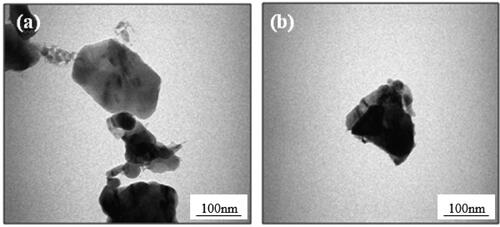
For TEM imaging, 0.01 g of the prepared powder was dispersed in 10 ml of ethanol and sonicated for 30 min from which two drops of 10 microliters were deposited on a carbon-coated Cu grid and dried at room temperature in air. show the TEM images of the undoped and 7% Eu-doped ZnO. The mean grain size of the were 25 nm and 61 nm for undoped and 7% doping respectively which are close to results obtained by XRD measurements.
Figure 6. TEM images for (a) undoped ZnO and (b) 5% Eu-doped ZnO sample.
3.4. Fourier-transform infrared spectroscopy
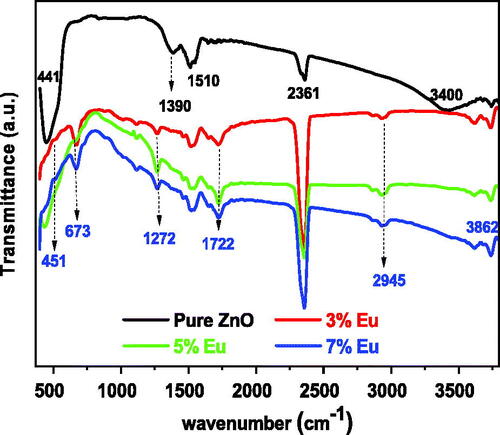
Fourier transform infrared (FTIR) spectroscopy was applied to get information regarding chemical bonding and vibrational frequencies of bonds between atoms in the molecules constituting the material (Shannon, Citation1976; Vinoditha et al., Citation2019). The FTIR spectrum appears as dips at different wavenumbers depending on crystalline structures and chemical compositions. presents the FTIR spectra of the pure and Eu-doped ZnO samples with different concentrations recorded at room temperature in the range 400–4000 cm−1. The peak at 441 cm−1 was characterized as Zn-O stretching mode (Bao, Wang, & Ma, Citation2016; Mesaros et al., Citation2015; Williamson & Hall, Citation1953), while the two other dips located at 1510 cm−1 and 2361 cm−1are respectively related to the symmetric and asymmetric stretching vibration modes of C = O due to the existence of CO2 molecule in the air (Ntwaeaborwa, Mofokeng, Kumar, & Kroon, Citation2017). The dips at 1390 cm−1 and 3400 cm−1 are ascribed to O-H bending for H2O in the pure sample (Dobrozhan, Opanasyuk, Kolesnyk, Demydenko, & Cheong, Citation2015; Singh, King, & Nayak, Citation2020). It was noted that the obtained dips are characteristic of the hexagonal wurtzite structure that demonstrated by the XRD analysis (Pal & Manam, Citation2014). The spectra of Eu-doped ZnO present new dips related to the Eu atoms which proves the effected doping of Eu in the possible hosts of the ZnO lattice. The dip located at 451 cm−1 might be attributed to Eu − O (Bao et al., Citation2016; Mesaros et al., Citation2015) stretching mode confirming that some Eu3+ ions were introduced in the Zn2+ sites.
Figure 7. FTIR spectra measured for the undoped and Eu- doped ZnO samples.
3.5. Ultraviolet-visible spectrophotometry
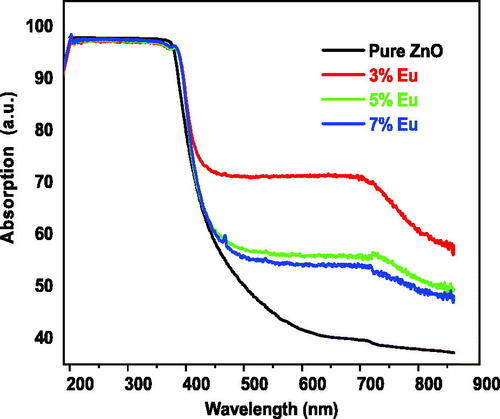
Ultra-Violet Visible (UV-Vis) spectroscopy was used to investigate the optica properties of the obtained compsoites and calculate the bandgap (Ciciliati et al., Citation2015; Mihaiu et al., Citation2016; Park, Hakeem, Pi, & Jung, Citation2019). Diffuse reflectance and optical absorbance were performed in the spectral range of 200–800 nm. It was noticed from that the highest absorption intensities for all prepared samples are obtained in the UV region while it dropped be zero in the visible range for the undoped sample. In contrarily the doped samples exhibit good optical absorption in the visible range. The relative values of absorption are 71, 55 and 52% for 3, 5 and 7 wt% Eu-doping percentages respectively. The increase in the optical absorption can be attributed to different reasons such as the increase in the surface area due grain size decreasing and to the generation of intermediate energy levels which increase with the Eu-doping percentage (Wang & Xie, Citation2008). These results are in agreement with the work of Al-Otaibi et al. (Citation2019) who investigated Zn1-xEuxO nanoparticles synthesized by combustion reaction method for x = 0.01, 0.02 and 0.03, and showed that optical absorption is almost zero for the undoped nanopowder . It was about 50% for x = 0.1 and was decreased with the atomic percentage to reach about 22% for x = 0.03.
Figure 8. Optical absorption of the undoped and Eu-doped ZnO nanopowders for different Eu concentrations.
The bandgap energy was determined by using the Kubelka-Munk equation (Mihaiu et al., Citation2016), expressed as following:
(8)
(8)
where F(R) known as Kubelka-Munk absorption function:
(9)
(9)
R is the reflectance, n factor depends on the nature of the electron transition and is equal to 1/2 or 2 for the direct and indirect transition band gaps, respectively for ZnO semiconductors nanopowder based materials the value is 1/2; h is Plank constant, is the photon frequency and A is a characteristic parameter.
After plotting versus
as shown in , the intersection point between the x-axis and the linear fit of the Kubelka-Munk plot gives an estimated value of the bandgap energy. The calculated bandgap of pure ZnO was 3.233 eV while the calculated bandgaps for the doped samples were 3.135, 3.146 and 3.139 eV for 3, 5 and 7 wt% Eu-doping percentage, respectively.
Figure 9. Kubelka-Munk plots of the undoped and Eu-doped ZnO nanopowders for different Eu concentrations.
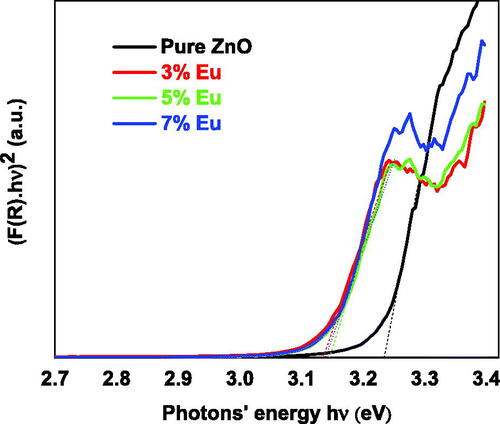
The bandgap energy decreases as the Eu concentration increase. The 5 wt% sample has the smallest value among them. This behavior might be attributed the quantum confinement (Jule et al., Citation2016) effect due to grain size reduction. As the doping concentration increases to 5% the grain size increased and the bandgap was decreased but when the doping concentration increases from 5% to 7% the grain size increased and the bandgap was increased indicating that the bandgap is inversely proportional to the size of nanoparticles according to EquationEquation 10(10)
(10) that gives the relationship between the bandgap and grain size (Pessoni, Maia, & Franco, Citation2015):
(10)
(10)
where
is the band gap of the material constitued of nanoparicles,
is the band gap of the material in bulk shape,
and
are the effective masses for holes and electrons in this material,
is the vacuum permittivity, and R is the nanoparticle’ radius.
The Eu-doping ZnO by substituting Zn2+ ions by those of Eu+3 leads to the formation of an acceptor level below the conduction band leading to the overall decrease in the bandgap and gave a redshift of the optical absorption edge which improves its photocatalytic efficiency.
3.5. Photoluminescence study
shows the photoluminescence (PL) spectra of the pure and Eu-doped ZnO nanopowders. The undoped ZnO sample spectrum exhibited three emission peaks 360–440 nm, 462–475 nm and 470–560 nm regions and centered at 397 nm, 467 nm and 529 nm respectively.
Figure 10. PL spectra for undoped and Eu-doped ZnO samples for various Eu percentages.
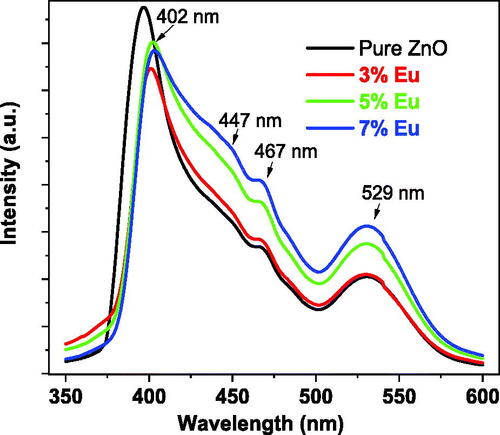
The peak in the range of 460–476 nm whose center lies at 467 nm remain at the same position independent of the doping percentage and corresponds to the blue emission of the electronic recombination from the zinc interstitial (Zni) to the zinc (VZn) energy levels (Pessoni et al., Citation2015). The peak in the 500–560 nm region and centered at 529 nm could be attributed to the green emission due to the oxygen vacancies related to the internal transitions between the singly ionized oxygen vacancies and the photoexcited holes, whose intensity increases with the Eu density. This improvement is due to the fact that the lattice of ZnO nanomaterials acquires more singly ionized oxygen vacancies and defects with Eu-doping (Samanta, Citation2020). The peak in the 360–440 nm region whose center shifts from 397 nm to 400.97 nm, 402.02 nm and 403.09 nm for 3%, 5% and 7% doping percentage respectively leading to the violet emission which corresponds to the near-band edge of the ZnO host and confirms the decrease in the bandgap as Eu-doping increases (Ravichandran & Karthick, Citation2020). The broad-band blue emission centered at 447 nm was attributed to the 4f6d1→4f7 transition of the Eu2+ ions obtained after the electron-hole recombination between conduction free electrons and Eu3+ (Malimabe et al., Citation2020).
3.6. Photocatalytic studies
The photocatalytic activity of Eu-doped ZnO nanopowder was investigated for the degradation of a persistent pollutant like methylene blue by dissolving 0.2 mg of MB powder in 100 ml of 0.3% hydrogen peroxide (H2O2) at pH ∼ 6.4. For this purpose, a 2 mg of the prepared nanopowder was added to 10 mL of MB solution and stirred for 30 min under dark conditions and centrifuged at 6000 rpm to separate the remained undissolved powder and then exposed to UV-Vis halogen lamp for 30 minutes. shows the optical absorption measurements performed by the UV-visible spectrometer versus the wavelength in the spectral range 400–800 nm. It was observed that the MB degraded under light illumination of 30 min duration.
Figure 11. The UV-Vis absorption spectra of MB solution mixed with undoped and Eu-doped ZnO samples.
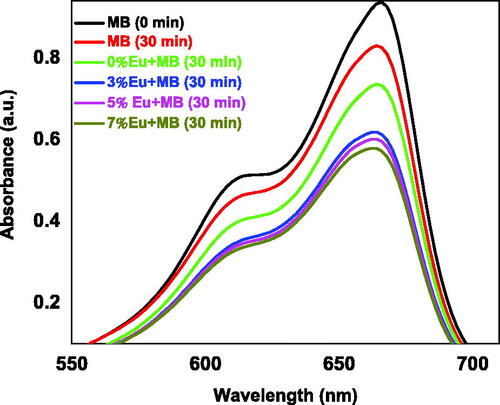
The degradation efficiency of MB at 0%, 3%, 5% and 7% of Eu were 27%, 38%, 40% and 43% MB respectively after 30 min of light illumination compared to that measured without catalyst. It was noted that the undoped ZnO catalysis has the lowest degradation efficiency despite its small grain size, as reported by Trandafilovic et al. (Citation2017). It worth mentioning that the different doping composite used in this work showed better photocatalytic efficiency that that reported by other groups such as Phuruangrat et al. (Citation2014) who obtained a degradation of 25% and Luo et al. (Citation2014).
The decolorization efficiency percentage was calculated using EquationEquation 11
(11)
(11) :
(11)
(11)
where
and
are respectively the peaks intensities of MB at the beginning and at time t subjected to light irradiation for a duration t for all the studied samples. The results are presented in .
Table 2. The decolorization efficiency of the undoped and Eu-doped ZnO catalysts.
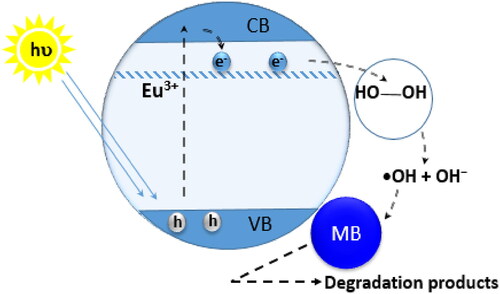
A large difference can be noted between undoped and Eu doped ZnO in degradation efficiency despite the small size of the undoped ZnO nanopowder compared to doped sampled. This behavior may be attributed to the fact that Eu is a rare earth element which constitutes an extra source of photo-generated electrons and promotes charges separation in a rare earth doped photocatalyst. Hydrogen peroxide H2O2, in presence of UV light or photogenerated electrons, constitutes a green oxidant by the intermediate hydroxyl radical (•OH) due to the rupture of O-O bond which oxidize and degrade any organic matter such as the MB whose degradation mechanism can be described through the following EquationEquations (12–14):
(12)
(12)
(13)
(13)
(14)
(14)
Therefore, increasing the Eu-doping concentration enhance the number of the •OH radicals and so the photocatalytic efficiency, which may be related to the fact that by adding the dopant, the incompletely filled 4f orbitals of Eu3+ ions appeared slightly below the lower edge of the ZnO conduction band. This allows the capture of the closest conduction electrons which react with the hydrogen peroxide molecules adsorbed on the surface of the Eu-doped ZnO nanoparticles to form the hydroxyl radicals which eventually attack the MB molecules (EquationEquation 14(14)
(14) ) leading to several degraded products as shown in .
Figure 12. Photocatalytic mechanism for the degradation of MB by Eu-doped ZnO.
4. Conclusion
Europium (Eu) doped zinc oxide (ZnO) nanocomposite were successfully synthesized by the solid-state reaction method for three different doping percentages (3%, 5% and 7%) The synthesized samples are characterized by different techniques.
The synthesized samples have a high purity of wurtzite structure with grain size in the range of 20–65 nm. The optical measurement showed an increase in the optical absorption in the visible range and a decrease in the bandgap energy. The photocatalytic efficiency was studied for the degradation of MB dye. The photocatalytic efficiency showed strong influence of the Eu doping of the nanocomposite
Disclosure statement
No potential conflict of interest was reported by the authors.
References
- Ahmad, I. (2019). Inexpensive and quick photocatalytic activity of rare earth (Er, Yb) co-doped ZnO nanoparticles for degradation of methyl orange dye. Separation and Purification Technology, 227, 115726. doi:10.1016/j.seppur.2019.115726
- Al-Otaibi, A. L., Ghrib, T., Alqahtani, M., Alharbi, M. A., Hamdi, R., & Massoudi, I. (2019). Structural, optical and photocatalytic studies of Zn doped MoO3 nanobelts. Chemical Physics, 525, 110410. doi:10.1016/j.chemphys.2019.110410
- Anju Chanu, L., Joychandra Singh, W., Jugeshwar Singh, K., & Nomita Dev, K. (2019). Effect of operational parameters on the photocatalytic degradation of methylene blue dye solution using manganese doped ZnO nanoparticles. Results in Physics, 12, 1230–1237. doi:10.1016/j.rinp.2018.12.089
- Ashokkumar, M., & Muthukumaran, S. (2014). Microstructure, optical and FTIR studies of Ni, Cu co-doped ZnO nanoparticles by co-precipitation method. Optical Materials, 37, 671–678. doi:10.1016/j.optmat.2014.08.012
- Ashrafi, A., & Jagadish, C. (2007). Review of zincblende ZnO: Stability of metastable ZnO phases. Journal of Applied Physics, 102(7), 071101. doi:10.1063/1.2787957
- Ashtaputre, S. S., Nojima, A., Marathe, S. K., Matsumura, D., Ohta, T., Tiwari, R., … Kulkarni, S. K. (2008). Investigations of white light-emitting europium doped zinc oxide nanoparticles. Journal of Physics D: Applied Physics, 41(1), 015301. doi:10.1088/0022-3727/41/1/015301
- Bao, Y., Wang, C., & Ma, J. (2016). Trisodium citrate as bridging and suppressing agent to control synthesis of ZnO hollow hierarchical microspheres and their photocatalytic properties. Ceramics International, 42(1), 1746–1755. doi:10.1016/j.ceramint.2015.09.133
- Chebil, W., Fouzri, A., Fargi, A., Azeza, B., Zaaboub, Z., & Sallet, V. (2015). Characterization of ZnO thin films grown on different p-Si substrate elaborated by sol-gel spin-coating method. Materials Research Bulletin, 70, 719–727. doi:10.1016/j.materresbull.2015.06.003
- Ciciliati, M. A., Silva, M. F., Fernandes, D. M., de Melo, M., Hechenleitner, A., & Pineda, E. (2015). Fe-doped ZnO nanoparticles: Synthesis by a modified sol–gel method and characterization. Materials Letters, 159, 84–86. doi:10.1016/j.matlet.2015.06.023
- Dobrozhan, O., Opanasyuk, A., Kolesnyk, M., Demydenko, M., & Cheong, H. (2015). Substructural investigations, Raman, and FTIR spectroscopies of nanocrystalline ZnO films deposited by pulsed spray pyrolysis. Physica Status Solidi (a), 212(12), 2915–2921. doi:10.1002/pssa.201532324
- Du, H., Wan, T., Qu, B., Scott, J., Lin, X., Younis, A., & Chu, D. (2017). Tailoring the multi-functionalities of one-dimensional ceria nanostructures via oxygen vacancy modulation. Journal of Colloid and Interface Science, 504, 305–314. doi:10.1016/j.jcis.2017.05.057
- Gondal, M. A., Drmosh, Q. A., Yamani, Z. H., & Saleh, T. A. (2009). Synthesis of ZnO2 nanoparticles by laser ablation in liquid and their annealing transformation into ZnO nanoparticles. Applied Surface Science, 256(1), 298–304. doi:10.1016/j.apsusc.2009.08.019
- Isai, K. A., & Shrivastava, V. S. (2019). Photocatalytic degradation of methylene blue using ZnO and 2%Fe–ZnO semiconductor nanomaterials synthesized by sol–gel method: A comparative study. SN Applied Sciences, 1(10), 1247. doi:10.1007/s42452-019-1279-5
- Jule, L. T., Dejene, F. B., Ali, A. G., Roro, K. T., Hegazy, A., Allam, N. K., & El Shenawy, E. (2016). Wide visible emission and narrowing bandgap in Cd-doped ZnO nanopowders synthesized via sol-gel route. Journal of Alloys and Compounds, 687, 920–926. doi:10.1016/j.jallcom.2016.06.176
- Karimipour, M., Sadeghian, M., & Molaei, M. (2018). Fabrication of white light LED photocatalyst ZnO–rGO heteronanosheet hybrid materials. Journal of Materials Science: Materials in Electronics, 29(16), 13782–13793. doi:10.1007/s10854-018-9509-y
- Khataee, A., Soltani, R., Hanifehpour, Y., Safarpour, M., Ranjbar, H. G., & Joo, S. W. (2014). Synthesis and characterization of dysprosium-doped ZnO nanoparticles for photocatalysis of a textile dye under visible light irradiation. Industrial & Engineering Chemistry Research, 53(5), 1924–1932. doi:10.1021/ie402743u
- Klement, R., Drdlíkova, K., Kachlík, M., Drdlík, D., Galusek, D., & Maca, K. (2021). Photoluminescence and optical properties of Eu3+/Eu2+-doped transparent Al2O3 ceramics. Journal of the European Ceramic Society, 41(9), 4896–4906. doi:10.1016/j.jeurceramsoc.2021.03.029
- Korake, P. V., Kadam, A. N., & Garadkar, K. M. (2014). Photocatalytic activity of Eu3+-doped ZnO nanorods synthesized via microwave assisted technique. Journal of Rare Earths, 32(4), 306–313. doi:10.1016/S1002-0721(14)60072-7
- Kumar, R., Al-Dossary, O., Kumar, G., & Umar, A. (2015). Zinc oxide nanostructures for NO2 gas-sensor applications: A review. Nano-Micro Letters, 7(2), 97–120. doi:10.1007/s40820-014-0023-3
- Kumar, V., Suman, S., Kumar, S., & Kumar, D. (2016). Synthesis and characterization of lanthanum doped zinc oxide nanoparticles. AIP Conference Proceedings, 1728, 020458. doi:10.1063/1.4946509
- Landsiedel, R., Ma-Hock, L., Van Ravenzwaay, B., Schulz, M., Wiench, K., Champ, S., … Oesch, F. (2010). Gene toxicity studies on titanium dioxide and zinc oxide nanomaterials used for UV-protection in cosmetic formulations. Nanotoxicology, 4, 364–381. doi:10.3109/17435390.2010.506694
- Luo, L., Zhu, L., & Wang, X. (2014). Study on Eu doped ZnO photocatalytic degradation of pharmaceutical wastewater. Applied Mechanics and Materials, 700, 482–486. doi:10.4028/www.scientific.net/AMM.700.482
- Lv, P., Chen, S. C., Zheng, Q., Huang, F., & Ding, K. (2015). High electron mobility ZnO film for high-performance inverted polymer solar cells. Applied Physics Letters, 106(16), 163902. doi:10.1063/1.4918686
- Mahdhi, H., Djessas, K., & Ben Ayadi, Z. (2018). Synthesis and characteristics of Ca-doped ZnO thin films by rf magnetron sputtering at low temperature. Materials Letters, 214, 10–14. doi:10.1016/j.matlet.2017.11.108
- Malimabe, M. A., Dejene, B. F., Swart, H. C., Motloung, S. V., Motaung, T. E., & Koao, L. F. (2020). Characterization of the incorporated ZnO doped and co-doped with Ce3+ and Eu3+ nanophosphor powders into PVC polymer matrix. Journal of Molecular Structure, 1202, 127339. doi:10.1016/j.molstruc.2019.127339
- Mesaros, A., Toloman, D., Nasui, M., Mos, R., Petrisor, T., Vasile, B., … Pana, O. (2015). A valence states approach for luminescence enhancement by low dopant concentration in Eu-doped ZnO nanoparticles. Journal of Materials Science, 50(18), 6075–6086. doi:10.1007/s10853-015-9157-z
- Mihaiu, S., Szilágyi, I. M., Atkinson, I., Mocioiu, O. C., Hunyadi, D., Pandele-Cusu, J., … Zaharescu, M. (2016). Thermal study on the synthesis of the doped ZnO to be used in TCO films. Journal of Thermal Analysis and Calorimetry, 124(1), 71–80. doi:10.1007/s10973-015-5147-2
- Mirabbaszadeh, K., Ahmadi, M., Khosravi, M., Mokhtari, R., & Salari, S. (2013). Hydrothermal synthesis of vertically aligned cesium-doped ZnO nanorods for solar cell applications. Journal of Inorganic and Organometallic Polymers and Materials, 23(6), 1219–1225. doi:10.1007/s10904-013-9903-0
- Mousavi, S. B., & Heris, S. Z. (2020). Experimental investigation of ZnO nanoparticles effects on thermophysical and tribological properties of diesel oil. International Journal of Hydrogen Energy, 45(43), 23603–23614. doi:10.1016/j.ijhydene.2020.05.259
- Ntwaeaborwa, O. M., Mofokeng, S. J., Kumar, V., & Kroon, R. E. (2017). Structural, optical and photoluminescence properties of Eu3+ doped ZnO nanoparticles. Spectrochimica Acta. Part A, Molecular and Biomolecular Spectroscopy, 182, 42–49. doi:10.1016/j.saa.2017.03.067
- Pal, P. P., & Manam, J. (2014). Color tunable ZnO nanorods by Eu3+ and Tb3+ co-doping for optoelectronic applications. Applied Physics A, 116(1), 213–223. doi:10.1007/s00339-013-8095-3
- Park, K., Hakeem, D. A., Pi, J. W., & Jung, G. W. (2019). Emission enhancement of Eu3+-doped ZnO by adding charge compensators. Journal of Alloys and Compounds, 772, 1040–1051. doi:10.1016/j.jallcom.2018.08.278
- Patel, M., Kim, H.-S., Kim, J., Yun, J.-H., Kim, S. J., Choi, E. H., & Park, H.-H. (2017). Excitonic metal oxide heterojunction (NiO/ZnO) solar cells for all-transparent module integration. Solar Energy Materials and Solar Cells, 170, 246–253. doi:10.1016/j.solmat.2017.06.006
- Pessoni, H., Maia, L., & Franco, A., Jr. (2015). Eu-doped ZnO nanoparticles prepared by the combustion reaction method: Structural, photoluminescence and dielectric characterization. Materials Science in Semiconductor Processing, 30, 135–114. doi:10.1016/j.mssp.2014.09.039
- Phuruangrat, A., Yayapao, O., Thongtem, T., & Thongtem, S. (2014). Synthesis and characterization of europium-doped zinc oxide photocatalyst. Journal of Nanomaterials, 2014, 1–9. doi:10.1155/2014/367529
- Ponnamma, D., Cabibihan, J.-J., Rajan, M., Pethaiah, S. S., Deshmukh, K., Gogoi, J. P., … Chandrashekar, B. (2019). Synthesis, optimization and applications of ZnO/polymer nanocomposites. Materials Science & Engineering. C, Materials for Biological Applications, 98, 1210–1240. doi:10.1016/j.msec.2019.01.081
- Rajput, V., & Pandey, N. (2017). Moisture sensing studies of CuO-ZnO nanocomposites. International Journal of Applied Ceramic Technology, 14(1), 77–83. doi:10.1111/ijac.12620
- Rami, J. M., Patel, C. D., Patel, C. M., & Patel, M. V. (2020). Green ZnO nanorod material for dye degradation and detoxification of pharmaceutical wastes in water. Journal of Environmental Chemical Engineering, 8, 104295. doi:10.1016/j.jece.2020.104295
- Rathnasamy, R., Thangasamy, P., Thangamuthu, R., Sampath, S., & Alagan, V. (2017). Green synthesis of ZnO nanoparticles using Carica papaya leaf extracts for photocatalytic and photovoltaic applications. Journal of Materials Science: Materials in Electronics, 28(14), 10374–10381. doi:10.1007/s10854-017-6807-8
- Ravichandran, A. T., & Karthick, R. (2020). Enhanced photoluminescence, structural, morphological and antimicrobial efficacy of Co-doped ZnO nanoparticles prepared by co-precipitation method. Results in Materials, 5, 100072. doi:10.1016/j.rinma.2020.100072
- Ren, S., Dong, W., Tang, H., Tang, L., Li, Z., Sun, Q., … Zhao, J. (2019). High-efficiency magnetic modulation in Ti/ZnO/Pt resistive random-access memory devices using amorphous zinc oxide film. Applied Surface Science, 488, 92–97. doi:10.1016/j.apsusc.2019.05.129
- Salem, M., Akir, S., Ghrib, T., Daoudi, K., & Gaidi, M. (2016). Fe-doping effect on the photoelectrochemical properties enhancement of ZnO films. Journal of Alloys and Compounds, 685, 107–113. doi:10.1016/j.jallcom.2016.05.254
- Samanta, P. K. (2020). Band gap engineering, quantum confinement, defect mediated broadband visible photoluminescence and associated quantum states of size tuned zinc oxide nanostructures. Optik, 221, 165337. doi:10.1016/j.ijleo.2020.165337
- Sehar, S., Naz, I., Rehman, A., Sun, W., Alhewairini, S. S., Zahid, M. N., & Younis, A. (2021). Shape-controlled synthesis of cerium oxide nanoparticles for efficient dye photodegradation and antibacterial activities. Applied Organometallic Chemistry, 35(1), e6069. doi:10.1002/aoc.6069
- Shaat, S. K. K., Musleh, H., Zayed, H., Asad, J., & AlDaho udi, N. (2020). Structural parameters of hydrothermally synthesized ZnO nanostructure and their based solar cells. Nano-Structures & Nano-Objects, 23, 100515. doi:10.1016/j.nanoso.2020.100515
- Shannon, R. (1976). Revised effective ionic radii and systematic studies of interatomic distances in halides and chalcogenides. Acta Crystallographica Section A, 32(5), 751–767. doi:10.1107/S0567739476001551
- Shashanka, R., Esgin, H., Yilmaz, V. M., & Caglar, Y. (2020). Fabrication and characterization of green synthesized ZnO nanoparticle based dye-sensitized solar cells. Journal of Science: Advanced Materials and Devices, 5, 185–191. doi:10.1016/j.jsamd.2020.04.0052468
- Shinde, K., Pawar, R., Sinha, B., Kim, H., Oh, S., & Chung, K. (2014). Study of effect of planetary ball milling on ZnO nanopowder synthesized by co-precipitation. Journal of Alloys and Compounds, 617, 404–407. doi:10.1016/j.jallcom.2014.08.030
- Singh, R., King, A., & Nayak, B. B. (2020). Influence of calcination temperature on phase, powder morphology and photoluminescence characteristics of Eu-doped ZnO nanophosphors prepared using sodium borohydride. Journal of Alloys and Compounds, 847, 156382. doi:10.1016/j.jallcom.2020.156382
- Trandafilović, L. V., Jovanović, D. J., Zhang, X., Ptasińska, S., & Dramićanin, M. D. (2017). Enhanced photocatalytic degradation of methylene blue and methyl orange by ZnO:Eu nanoparticles. Applied Catalysis B, 203, 740–752. doi:10.1016/j.apcatb.2016.10.063
- Vijayaprasath, G., Murugan, R., Palanisamy, S., Prabhu, N. M., Mahalingam, T., Hayakawa, Y., & Ravi, G. (2015). optical and antibacterial activity studies of neodymium-doped ZnO nanoparticles. Journal of Materials Science: Materials in Electronics, 26(10), 7564–7576. doi:10.1007/s10854-015-3393-5
- Vinoditha, U., Sarojini, B., Sandeep, K., Narayana, B., Maidur, S., Patil, P., & Balakrishna, K. (2019). Defects-induced nonlinear saturable absorption mechanism in europium-doped ZnO nanoparticles synthesized by facile hydrothermal method. Applied Physics A, 125(6), 125–436. doi:10.1007/s00339-019-2732-4
- Wang, H., & Xie, C. (2008). Effect of annealing temperature on the microstructures and photocatalytic property of colloidal ZnO nanoparticles. Journal of Physics and Chemistry of Solids, 69(10), 2440–2444. doi:10.1016/j.jpcs.2008.04.036
- Wang, Y., Zhang, X., & Hou, C. (2018). Facile synthesis of Al-doping 1D ZnO nanoneedles by co-precipitation method for efficient removal of methylene blue. Nano-Structures & Nano-Objects, 16, 250–257. doi:10.1016/j.nanoso.2018.07.001
- Williamson, G., & Hall, W. (1953). X-ray line broadening from filed aluminium and wolfram. Acta Metallurgica, 1(1), 22–31. doi:10.1016/0001-6160(53)90006-6
- Yadav, H., Sinha, N., Goel, S., & Kumar, B. (2016). Eu-doped ZnO nanoparticles for dielectric, ferroelectric and piezoelectric applications. Journal of Alloys and Compounds, 689, 333–341. doi:10.1016/j.jallcom.2016.07.329
- Younis, A., Shirsath, S. E., Shabbir, B., & Li, S. (2018). Controllable dynamics of oxygen vacancies through extrinsic doping for superior catalytic activities. Nanoscale, 10(39), 18576–18585. doi:10.1039/C8NR03801E
- Zhu, Y., & Zhou, Y. (2008). Preparation of pure ZnO nanoparticles by a simple solid-state reaction method. Applied Physics A, 92(2), 275–278. doi:10.1007/s00339-008-4533-z