
 ?Mathematical formulae have been encoded as MathML and are displayed in this HTML version using MathJax in order to improve their display. Uncheck the box to turn MathJax off. This feature requires Javascript. Click on a formula to zoom.
Abstract
Energy consumption has always been considered one of the major issues in the six Gulf Cooperation Council (GCC) countries. Therefore, the predicted energy consumption can respond based on several factors and conditions, where which will help in response to plan saving energy for the future. The significant contribution of the present study is the development of software merging the Petri-Nets and ANFIS to become a comprehensive model to find the maximum annual load demand estimation of the GCC countries based on the historical data of the countries. The ANFIS-Petri Nets have expected modeling to represent knowledge and help in rule-based expert systems. The data has several parameters/conditions (factors), where these factors are temperature, humidity, GDP, pressure, and energy consumption. The results lead to a fast and accurate figure have developed an energy estimated system that works by tracking, analyzing, and controlling conditions of the energy system. The Petri-Nets ANFIS developed technique targeting the estimated maximum annual energy consumption believes that obtaining the values is satisfactory for the future of GCC states. In addition, the developed and obtained models have great application for the GCC countries. This might help to develop the models of other countries.
1. Introduction
Petri Nets are graphing tools that provide a unified modeling and formal analysis of unique event system. As an example, the system might be as business automation systems. The Petri net models having advantages, one of these helped for behavioral properties. In addition, it helps in the evaluation of discrete event controllers and simulators. Petri Nets can be used to model functions. These functions representing the process and events of synchronization, simultaneous actions, and clashes, or sharing the resource. Petri-Nets uses tokens in simulation. The Nets allow tokens to have a data value attached to them. Also, the Petri Nets uses places which symbolize conditions or states. Before an action, the places are carried out and transition the token which symbolize actions. The electric energy consumption increases rapidly due to the increase of temperature, humidity, GDP, and pressure over the period of the study. The energy consumption contributes more to economic growth of the GCC states.
In Nigeria there was a need to develop a calculation model with which 24-hour electrical predictions can be made. Iyanda and Odejobi (Iyanda & Odejobi, Citation2015) in their study highlights on the design which was created with a colored petri-net tool and applied with an obscure logic tool. The results showed that the share of electrical load in the rainy period is less than the consumed amount in the dry and dusty period, so more attention must be paid to produce more energy under the harmattan than in the rainy season to make electricity generated correctly handled. The Artificial Intelligence (AI) Approach is known as the approach used to study and design intelligent agents. The colored Petri Nets is used to interact between the system and user which helps in the design of the model. The authors expect, in the next 50 years, Nigeria will experience stable power supply. The stable power supply will produce a greater sustainable development of the citizens and Nigeria as a country.
For energy analysis Wang, Wang, and Yang (Citation2014) highlight on the processing of the power consumption and the difficulty of collecting data the study proposed a simpler and more practical power consumption model for Petri Net-based processing systems (CPNs). The energy flow of the processing system was studied and analyzed. In addition, the power model of the machining processing demonstrated multi functions, simplifying calculating the power consumption during production and verifying by unloading the machine power, automation time, material style and the volume of material removal. Eventually, while studying the case for a dual position engineering system, the proposed energy model is simulated, and the output of the simulation proved to be very practical. The CPN energy machines for a single case automation system are modeled by CPN machines. Also, based on the discussion of the simulation outputs, the energy model satisfies the usability.
Labadi, Benarbia, Hamaci, and Darcherif (Citation2012) in their chapter, the Petri’s original approach introduced to modeling public sharing systems and evaluating performance for management purposes. It is proposed to identify a dynamic modular model based on Petri’s dependent load networks and to develop and use a simulation method in their chapter. Apparently, this approach is urban transport with Petri Nets. The authors believe there is great future promise in this new area of research that will help designers successfully implemented and operated the system. The authors are working in the two directions. These directions are the development and modeling functions, such as implementing other control strategies that work to provide real-time information to users and for bicycle availability regulators. The second direction is the develop advanced techniques for optimal management purposes.
Solti, Vana, and Mendling (Citation2015) they highlight on the operational support as a mining area targets to predict individual case and overall process of the business. Also, it is known that there will be seasonal effects, delays, and changes in performance for business processes, to date there is no forecasting model specifically covering seasonality. In this study, a time series of Petri net are introduced. In addition, these models include the Petri net flow control view the predictions. Their evaluation based on prototypical application highlights the model benefits to improve accuracy in the presentation.
Vrontakis, Kampianakis, and Tsinarakis (Citation2016) in their study demonstrated method to optimize product design for an industry that processes a wide range of raw materials. Modeling Petri-net production methods, together with a random estimate of future demand, provide the Mixed Integer Linear Problem (MILP) input which measures the favorable production time. The end products have been developed and applied in a case study.
Hafeez, Alimgeer, and Khan (Citation2020) in their research highlight on the accurate electricity load forecasting is important for use in decision-making on the power network. The electrical load is a complicated indicator of the users’ nonlinear. Despite a lot of research studies in the area; however, accurate prediction models are required. The study proposes a new hybrid prediction model for short-term electrical loads. The proposed model of data preprocessing model and prediction model, and fully developed model are a unified framework. The data preprocessing model based on modified mutual information, an enhanced of the correlation information method, is used to choose from the historical data the summary. The prediction model is based on the Boltzmann Billing Constraints Tool, an in-depth learning model, enabled by the study of future electricity load predictions. The optimization module is concentrates on the wind-powered genetic algorithm. The proposed frame is assessed using one-hour historical data from three U.S. power grids. The model under study is valid. This validity is proven by comparing it with four recent models preview such as dual-level network, accurate and fast convergence based on Artificial Neural Network, and short-term memory. in the long term in terms of accuracy and degree of coherence.
Wei et al. (Citation2020) with control functions such as energy storage system. However, the control functions can lead to load reversal, tempting the convenience network operator to issue less efficient control commands. Therefore, the study proposes a forward-looking design for smart and intelligent buildings to track the changes in the power, which is focusing on the impact of load reversal. The live load bases are used as a communicator between loads control and recirculation. The load control is not only reflecting the load impact regulation on consumers’ energy, but also in turn helps the network operator to upgrade the management schema. In addition, the diffuse output method depends on the generation of the columns combining the Dantzig-Wolfe decay methods plus branch-and-link methods. It grooming to integer mixing problems and using again the columns which can speedy the degradation and confinement methods. The result of the simulation illustrates that the proposed schedule that satisfy the full utilize of load recycling to satisfy it. The effectiveness of the control and resolution method can be implemented in real-time, even if the decay algorithm is repeated.
Heydari et al. (Citation2020) in their study mentioned that the increasing their economic efficiency in deregulated markets is an important part of electricity price forecasting for market participants. However, due to its non-linearity and silence, price development is usually difficult to predict. In addition, the accuracy of electricity prices in the short term and the forecast of loads are fundamental to the effective electricity management. The study proposes a new carefully engineered model for short-term load forecasting in unregulated energy markets. It includes variable decoding, mixed modeling, function selection, a universal NN for retrieval, and an algorithm for gravity analysis. A load forecasting and integration with the original and decomposed set of price and load indicators was considered. Through this model, entry variables are selected by selecting a specific hybrid function. The considered model, candidate entry variables are selected by selecting a specific hybrid function.
Chu et al. (Citation2020) in their article introduce an algorithm. This algorithm applied with respect to a new short-term load demand method on a city scale. In this way, a decision on seasonal characteristics per hour and a weighted method for daytime characteristics are both applied to distribute the seasons in multi-ways. The demand of the seasons is selected as the basic part based on the characteristics of power loads. The difference between the full load and the basic part removed as the weather-sensitive part. Then, a time series model chosen to predict the standard portion and support the sensitivity of the weather portion. The study presents Shanghai’s annual electricity costs to test the ensemble method. The output show that, unlike the total daily loads and other methods – empirical mode decay and Wavelet Transform reduces an error of 3 to 5% to less than 2% when forecasting load working days, and at the same time for non-working days the percentage error is reduced from the range of 4% to 5% to less than 4%.
de Mars, O’Sullivan, and Keppo (Citation2020) in their study highlight on both of wind and solar energies resources in the United Kingdom’s electricity generation. Due to the changing of these sources, large power plants for sustainable loads have had to operate in a more flexible way to compensate for changes in the generation of renewable energy. The results of the first empirical study are presented in de Mars et al. (Citation2020), to our knowledge, of the effect of renewable generation on starting generators, ramping, and partial load (combined, ‘cycling’) of generators. basic loads. The authors developed models using half-hourly generation data that consider the impact of the greater impact on renewable energy, considering complex characteristics, including seasonality. and application. The authors found cycling in 2017 with renewable generation levels in 2009 as intense, with 20% fewer start-ups. The authors also include cyclical estimates in future grid positions up to year 2030 with an impact on investment in asset generation. In addition, the database derived from this research will be made available and it will contain the first open access cycle dataset.
Nie, Jiang, and Zhang (Citation2020) in their research concentrate on the short-term wealth load forecasts play an important function in improving the operational impact of the energy system. To improve many load forecasting models are recommended. Most previous studies did not address the limitations of the prediction models that need for pre-preparation of data, which results in less reliable prediction. In their research, a new hybrid model was successfully demonstrated that successfully combines data, a single prediction algorithm and a weight determination to obtain higher accuracy and more predictable capacity. better. From the obtained study, the data preprocessing process first uses a new combination of preprocessing data procedure, where it addresses the shortcomings of some preprocessing procedures. To evaluate the proposed hybrid model, three datasets from the Queensland, South Australia, and Victoria at half-hour power in Australia were chosen. The experimental results show that the proposed procedure can not only estimate real power but can also be used as a useful tool for designing and launching the power grid.
Lindberg, Bakker, and Sartori (Citation2019) in their research highlight on the long-term prediction of the profile of accumulated electrical load is essential for energy system design decisions. With improvements in the energy efficiency buildings and the link between heat and electric load via heat pumps. The study of an ongoing project targeting improvement of the electric load image prediction. The approach allows for the introduction of energy efficiency measurement in buildings and the installation of heat pumps on the image of electricity collector loads. With respect to the survey data from over 100 non-residential properties across Norway, with the hourly resolution, the article presents individual models for retrieving panel data for specific heaters and electric load. This separation is critical because it can assess future efficiency measurement and replace heating technologies. The database is categorized to seven types of buildings, where two types: stable and efficient. The electric demand depends on the time of day, the outside environment, and the day type. The day type means if it is weekday or weekend. The results estimate is an indication of each building type and a variability of energy, typically per floor area (square meter). Thus, load profiles can be generated for typical period (e.g., days, weeks, and years), and aggregate electric demand projections can be made for a specific area, requiring outdoor temperatures and floor areas just as an extra data entry.
In the book, Qamber focuses on power systems reliability and generating unit commitments (Qamber, Citation2020). Also, he explains the probability theory which plays important role in power reliability applications that led to the development of the mathematical models (Qamber, Citation2020). In addition, both of Artificial Neural Networks (ANN) and Fuzzy Logic (FL) are explained.
Zhang, Zhao, Zhang, Fan, and Li (Citation2017), in their study concentrate on the developing a cooling load. The expected interval coverage probability is applied to evaluate the performance of the proposed intervals expectation procedure. The obtained results illustrate that the method used will helps to improve the prediction accuracy. The authors highlight on the used data in their study that validation of data is required from real data buildings.
Al-Hamad and Qamber (Citation2019) presented in their study the maximum electric load as a long-term forecasting using a Adaptive Neuro-Fuzzy Inference System (ANFIS) developed model. In addition, they presented the Multiple Linear Regression (MLR) methods in their study. The obtained models presented on the Gulf Cooperation Council (GCC) region.
Ismail and Bendary (Citation2018), in their study presented various types of load frequency. The type of controller is the PI controller. This type of controller is based on Artificial Intelligent optimization technique. Under the present study, the controller illustrates the frequency deviation signal. In addition, the MATLAB/SIMULINK tools are used.
Qamber in his study presents how to deal with the required design using a developed ANFIS method (Qamber, Citation2021). In addition, the model is formulated for the GCC. At the same time, the model will help the GCC countries for economic development.
He, Pan, Lu, Chen, and Jiao (Citation2020), in their study deals with a probabilistic load forecasting approach applied to model the electrical demand and its affecting factors. In addition, kernel density prediction takes quantile forecasts and probabilistic results.
Qamber and Al-Hamad (Citation2020) in their book deals with the intelligent power system integrated into the GCC area. The study provides a comprehensive analysis of some reliability terms that calculated to help in power system plan.
Bellahsen and Dagdougui (Citation2021) in their study proposed a classical machine learning principle such as recurrent NN and Long Short-Term Memory to find the best forecasting model and strategy. The obtained result becomes an accurate prediction which will serve to find the peak percentage through a certain subscribed power in the entire district. In conclusion, the operations and planning of the system are power system management crucial aspects.
Peng, Yan, Yu, and Luo (Citation2021), in their study they explored state-of-the-art deep learning techniques. This exploring is helping to analyze and find structural dynamic nonlinear behaviors applications. The proposed procedures are based on auto-regression and time series estimation models. With respect to the results, the long short-term memory neural network method was the most promising expectation method with sufficient training samples in their research (Peng et al., Citation2021).
Heydari et al. (Citation2020) in their study they proposed a combination selected model based on artificial intelligent for short term load demand forecast which deals for electricity short term price forecast and verified by two electrical markets (Pennsylvania New Jersey Maryland “PJM” and Spanish Electricity markets). In addition, the Favignana Island’s power grid tested to analyze, which used to test the proposed model in their study. A mixed data of load and price mixed in their study, where in the present study the ANFIS and Petri-Nets are mixed. Their study provide an intelligent strategy to evaluate the electricity market to match energy consumption.
In the year 2021, Nie, Roccotelli, Fanti, Ming, and Li (Citation2021) reported in their study about energy consumption prediction of buildings. The energy consumption estimation of building is a target the authors targeting, where a model is established. The prediction carried out by gradient boosting regression tree algorithm, which becomes accumulated final output. Experimental results in the study is proposed and shows lower values results.
Al-Badi and AlMubarak (Citation2019) reported in their study how the energy sector in GCC states plays a role to meet climate conditions and water scarcity. The energy consumption growing is one of the challenges GCC faced. In a time of ten years, the authors expected the GCC population would increase by approximately 20%. Al-Badi and AlMubarak in their study provide electricity demand estimation. One of their targets is the reduction of fossil fuel usage to reduce the carbon dioxide emission by adding renewable energy sources. In addition, the authors mentioned in their study that GDP is an important parameter affect to the energy consumption.
In 2019, Heydari et al. in their study concentrates on intelligent approaches hybrid strategy helps to estimate electricity consumption (Heydari, Astiaso Garcia, Keynia, Bisegna, & De Santoli, Citation2019). The approaches help to evaluate the correlation coefficient indicators and their classifications. I addition to the development of combined approach ANFIS and whale optimization algorithm. These help to estimate electricity consumption. Two cases considered Italy and Iran.
In 2022, Al Bannay and Takizawa in their study electricity and water correlated with GDP and population explained by economic development applied to the GCC states (Al Bannay & Takizawa, Citation2022). These GDP and population are due to demand-management policies, which save environmental protection and saving cost as well. Their results illustrate the GDP relationship with the production of electricity and water, where the production have decoupled from GDP since the year 2015. Both of GDP and population used for prediction of electricity and water demand. For the last two decades, statistical data found for electricity and water. In their study, the obtained results indicate a reduction in future risk in the GCC states.
The production of energy consumption models developed in the present study to estimate the energy consumption until the year 2030 using the Petri Nets-ANFIS GCC forecasting models. Each country indicates that a positive significant relationship between energy consumption and the variation of temperature, humidity, GDP, and pressure over the period of 2012 until 2030.
Several attempts have made to trigger the detection of annual pregnancy clarity. To characterize the incomprehensible annual load calculated for the future based on the input and training data. This will result in inconsistency in distinguishing the annual estimated load. To overcome the limitation, a new proposed method for improving accuracy known as ANFIS-Petri Nets. This method can determine the estimated future load; the results obtained showed that the ANFIS-Petri network is reliable. In addition, this network defined as having greater representation capacity and transparent modelling.
The present research study divided into five sections. This section is the introduction of the study which contents some background knowledge. The second section covers the Petri-Nets and Neuro-Fuzzy developed model. The third section deals with the GCC developed model application. The fourth section is the results and discussion, where the fifth is the conclusion and policy implications.
2. Petri-Nets and Neuro-Fuzzy developed model
The Petri Nets structure is the most useful graphical representation, where the places (states) and transitions (t) are connected by arrows. These arrow(s) are directed from the place(s) to transition and the other arrow(s) from the transition to place(s). The Petri Nets allow multiple arrows from one node of graph to another. Therefore, Petri net is represented as multigraph. In general, the Petri Nets are mathematical as well as graphical model tool. Also, for the formal analysis, the Petri Nets provided a uniform environment of the system and its design.
The Neuro-fuzzy system has advantages combination of the neural networks and fuzzy logic. The Fuzzy logic utilizes human understandable linguistic terms to formulate the knowledge of the system. This formulation makes suitable a close interaction between both system and human operator. Automatically the results obtained by data training using ANFIS (Qamber, Citation2020) to form the models. Finally, the estimated values of the five models are obtained.
Following the multi-layer (Al-Hamad & Qamber, Citation2019; Qamber, Citation2021) in this study. To reduce the neuro-fuzzy weight, a vector update is required:
(1)
(1)
where
known as firing strengths. This will help in normalization the firing strength of the rule which is defined as the input membership grades product. The resulted value is passed as an output to the corresponding fuzzy set.
Newton’s algorithm used as a common method. It is used to find the size and direction of a step instead of weight space. The size of the step and the direction at the weight space help to find JN (vk) which represents the cost function towards its minimum.
Following the cost function and Taylor’s expansion which is approximated by the quadratic function (Jang, Sun, & Mizutani, Citation1997; Kim, Duong, Nguyen, & Choi, Citation2013):
(2)
(2)
Where the weight vector v is updated as Δv. The T is the transpose.
Differentiation of (2) is obtained. Then, the differentiation is equal to zero and result becomes:
(3)
(3)
(4)
(4)
where:
g is the gradient of JN(vk), and
H is the Hessian of JN(vk), where the Hessian matrix at w which entries are the second derivatives of the cost function JN(vk)
To find the Newton’s equation, the conjugate gradient algorithm is truncated. The algorithm is summarized in the following points:
k = Zero.
The starting value of weight vector is vk.
The mathematical function gradient is g(vk) and the Hessian is H(vk).
Applying the termination of ǁg(vk)ǁ in the case that it will be less than
In condition that ǁ vk+1ǁ
Dk: then finding H(vk) Δvk + g(vk) using the conjugate.
In case that vk+1= vk + λkΔvk, λk is calculated and beginning with a value of λk=1
The region radius (Dk+1) is adjusted:
Back to step (iv).
The cost function JN (vk) needs both gradient and Hessian. Using the cost function helps to reduce the prediction error. After that considering the weight vector v and these derivatives can be found as:
(6)
(6)
(7)
(7)
With respect to the weights, the gradient of the model output is found:
(8)
(8)
vp is the ith weight of uth tensor model.
vp is the jth weight of kth tensor model.
The final output of ANFIS is formulated as:
(9)
(9)
where
on the input vector xi. The input vector has been dropped to reduce the notation.
Besides Petri Nets model, the ANFIS used as extension to make the results more accurate and helps to predict the energy consumption. This is called Petri Nets-ANFIS model methodology. The Petri Nets-ANFIS model is illustrated in which shows the behavior of the Fuzzy Logic model. The identification of the input parameters to the represented system as well as the output data from it, the developed model is called the fuzzification of the considered data. The input fuzzy inference engine converts the input set into an output fuzzy set methodology used.
Figure 1. Petri Nets-ANFIS flow-diagram.
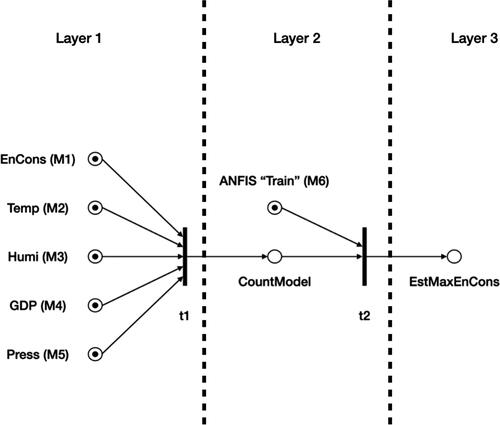
The transitions shown in act as processing units, where the firing depends on parameters of connections considered in this study, where these called weights. The marking illustrated as an output reflects a level of membership. The simulated energy consumption values of models used as the input information. There are number of inputs shown in affect the prediction model. These inputs are data trained and tested the proposed output estimated values for the coming years. The ANFIS Petri Nets proposed method is useful and significantly can reduce the size of the steps. In addition, the method can improve the performance of the training process.
The proposed and developed model represented by is known as a Petri Nets-ANFIS flow diagram model. This model deals with the implementation of the procedure which describes the comprehensive system’s implementation. The obtained results are known as an important major computational complication with respect to the time. This model representing the five factors which are the inputs of the model. These factors are the energy consumption (EnCons, M1), temperature (Temp, M2), humidity (Humi, M3), Gross Domestic Product (GDP, M4), and pressure (Press, M5). The membership functions and input factors represented in Layer (1) are illustrated in by gathering in the node (t1) as output. The second layer (Layer 2) is the output of (t1) results as (CountModel) and called membership value. The membership value and ANFIS “Train” (M6) are used to find the firing strength and rules by gathering in the node (t2). The third layer (Layer 3) is the final ANFIS results are found as the output of t2 which called EstMaxEnCons. Each of these five conditions has a Token (dot) inside the state (Circle). The tokens will be fired towards the transition bar (t1), where it will be combined after (t1) and fired to form the estimated models of the five factors forming (CountModel). The CountModel will continue with fired token of the ANFIS “Train, M6” to the transition (t2) to find the estimated maximum energy consumption (EstMaxEnCons). Reaching this state is the results estimated based on the developed Petri Nets-ANFIS model.
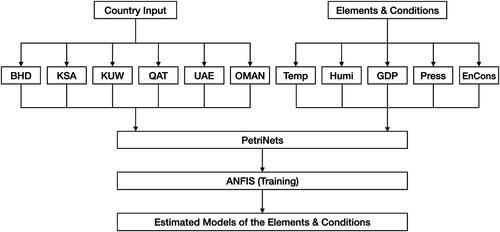
illustrates the operation process of electric energy consumption. It will start by two inputs, the country input and both elements and conditions input (called factors). The countries are Kingdom of Bahrain (BAH), Kingdom of Saudi Arabia (KSA), Kuwait (KUW), Qatar (QAT), United Arab Emirates (UAE), and Sultanate of Oman (OMAN). The five factors are the temperature (Temp), humidity (Humi), GDP, pressure (Press), and energy consumption (EnCons). Both countries and factors will be passed through using the Petri Nets, then trained using ANFIS to reach and obtain the estimated models of the elements and conditions to finalize the estimated energy consumption of each country. The forecasting models may classify as time series models of each elements/conditions for each country. Each model is a function of its past data values. The first four factors (elements/conditions) are exogenous factors (Temperature, Humidity, GDP, and Pressure). Both Petri-Nets and ANFIS are used as an artificial intelligent technique.
Figure 2. Operation process of electric energy consumption.
The estimation of the five factors (the elements/condition) versus time is more accurate. The collected data should be pre-processed before training of the model. The question raised regarding the preprocessing of the collected data can be achieved. The achievement is satisfied by any of the most suitable techniques. The most suitable technique is helping any selected model with its relevant information during the training process to find the most suitable formula representing the model. Therefore, the model performance can be satisfied and finding the estimated value of the coming years in future. The collected weather variables data contains three parameters (Temperature, Humidity, and Pressure).
Generally, the operation process of electric energy consumption illustrated in with two inputs. These two inputs are the five elements/condition (factors) and countries inputs. These inputs are passing through the criteria of Petri Nets, then its results passing through the ANFIS. After that, the ANFIS will train the initial output to find the final results which helps to find the maximum energy consumption.
As the input parameters have validation for the present study, then the obtained model functions which are used for the targeted models of the five elements/condition (factors) of the considered countries. The obtained functions are the most convolutional ANFIS networks. The algorithm used in the present study is followed to iteratively update the network’s weights based on the training data.
3. GCC developed model application
During the past few years, the electrical loads in the world have grown at very large rates, reaching almost 8% annually, on average. The reasons for the rapid growth of electrical loads are due to several factors, the most important of which are population and economic growth, the growth of per capita consumption of electricity, and the weak efficiency of electrical appliances used, especially air-conditioning equipment, which represents the bulk of consumption in the GCC. This growth also represents a challenge that requires the electricity sector, as it reduces the savings of electricity consumption, and this is considered one of the implications of the electric energy policy. Based on that, there is a requirement to build capacity for generation, transmission, and distribution networks to meet the growth.
The developed system applied to different elements and conditions. Applying the developed model as a relationship between each elements/condition (factor) versus the years that the system is passing through to find the most suitable model in each case. The obtained curve is helping to find the future estimated values of the elements and conditions based on the given data of each case. It is thus easy to predict the future predicted value. Processing every part of the available information using intelligent model illustrated in will helps in creating the relationship of the elements/condition (factors) versus time.
Each of the GCC countries has almost the same GDP and has market value for the end products manufactured by country over a period. In the GCC countries, the Population growth has risen in the recent decades sharply (Al-Hamad & Qamber, Citation2019; Qamber & Al-Hamad, Citation2020). In the present study, long-term annual maximum-energy consumption forecasting obtained. The method considers the uncertainties in the nature of the maximum energy consumption based on the variation of the other elements and conditions, where the proposed algorithm shows excellent performance.
The present iteration for the developed model continues running on the main data values till it reaches the suitable/reasonable value. In case that the iteration continues for a long period of time, a thread might start and helps to obtain a suitable value of the elements/conditions (factors) it becomes stable.
4. Results and discussion
The results obtained for the five considered elements and conditions illustrated in using the training of the data following structure hierarchy of each model considering elements/condition (factor) through years for each country to predict every step of the forecasting value. Each model of the country has been trained to predict the five elements/condition (factor). The obtained models for the results are summarized in . As the temperature rises, energy consumption increase. Even though in case that the temperature decreases, the energy consumption might increase as well. summarize the temperatures models of the considered countries. The reason behind the temperature fluctuation of the results before the year 2020 lies because of global warming resulting in that period such as UAE temperature (Statista, n.d.). Therefore, the global warming is the main reason behind the temperature fluctuation.
Figure 3. GCC countries’ temperatures versus years 2012–2030.
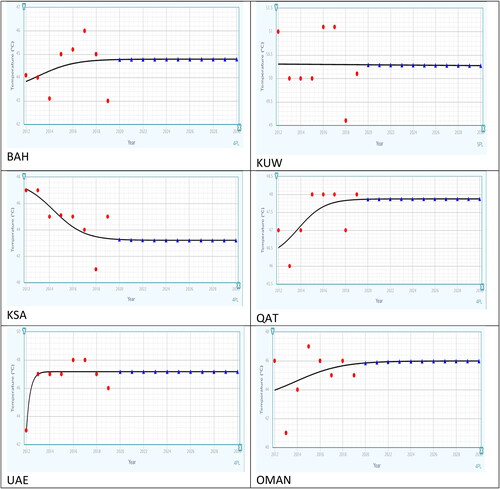
Figure 4. GCC countries’ humidity versus years 2012–2030.
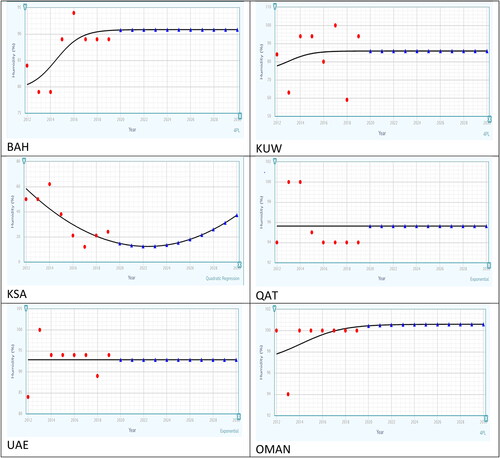
Figure 5. GCC countries’ GDP versus years 2012–2030.
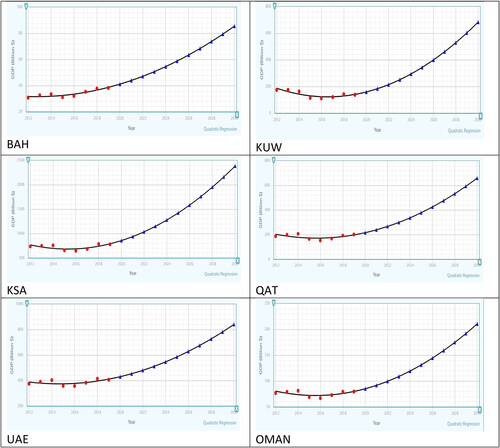
Figure 6. GCC countries’ pressure versus years 2012–2030.
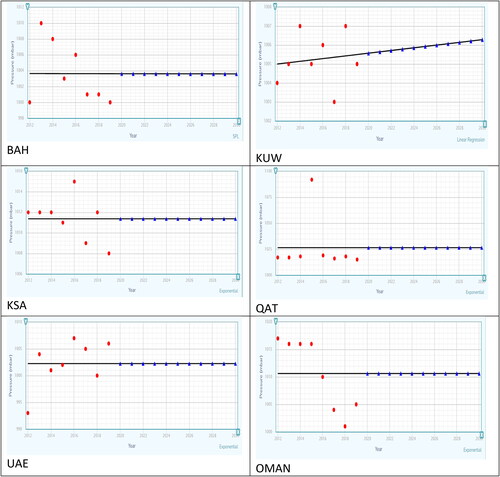
Figure 7. GCC countries’ energy consumption versus years 2012–2030.
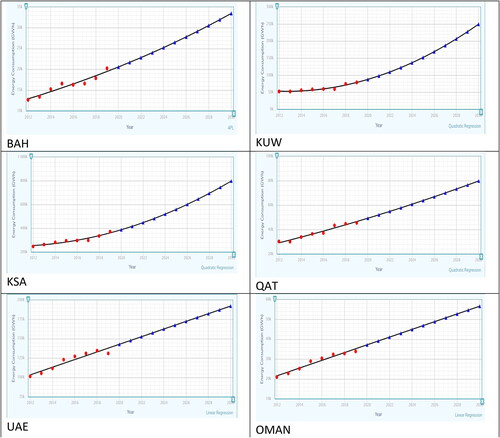
Table 1. Temperature models of the GCC countries.
Table 2. Humidity models of the GCC countries.
Table 3. GDP models of the GCC countries.
Table 4. Pressure models of the GCC countries.
Table 5. Energy consumption models of the GCC countries.
In summer, electricity consumption can increase at a certain humidity or water vapor concentration in the GCC countries. summarize the humidity models of the considered six GCC countries. In addition, the humidity is varied from year to year. Based on the average and using the curve-fitting technique the models obtained. Therefore, the fluctuation of the humidity results before the year 2020, because the humidity is worth it and global warming is a major cause of climate change. Therefore, the global warming is the main reason behind humidity fluctuation.
The growth of GDP will also increase the demand for electricity, which provides productive activity in the industrial sector. Therefore, the causal relationship between energy consumption and GDP is observed. In addition, the energy consumption can have a positive effect on GDP, this means that the GDP increases as energy consumption increases. To explain, economic growth is increasingly dependent on electricity consumption. Hence, countries’ demand for electricity is increasing day by day, depending on developing economies and changing socio-economic structures. summarize the GDP models of the considered six GCC countries.
The electric power consumption increases rapidly due to pressure increase. This means that the relationship between energy consumption and air pressure is directly proportional. summarize the pressure models of the considered six GCC countries.
Each country indicates that there is a positive and statistically significant relationship between energy consumption and economic growth over the long term such that energy consumption contributes more to economic growth as the import dependence of the country decreases. Moreover, the effect of energy consumption on economic growth decreases as the income level of the country increases. summarize the consumption energy models of the considered six studied countries.
The method has been presented to perform the suitable model of each element/condition. These elements/conditions are the maximum of temperature, humidity, GDP, pressure, and energy consumption of each of GCC countries. Each model was trained separately with inputs using load as a future target. One of the contributions of the present study is providing a developed intelligent strategy to evaluate the electricity market of the GCC countries power grids energy consumption forecasting based on Petri Nets-artificial intelligent method.
In the estimation stage of each country according to the elements/condition (factor), the coefficients (a, b, c, d, m) are obtained. The best fitted models are found as a year-ahead. The five depict the curves of nineteen time series datasets. The first eight time series are stationary. The training is carried out using the MATLAB/SIMULINK software. It is noted that the forecasting performance of Petri Nets-ANFIS is best. The forecast performance measurements are obtained. The analysis of the results obtained has become an inspiration for creating the five required forecasting factors of each country’s model based on the Petri Nets-ANFIS technique.
The Petri Nets-ANFIS forecasting model was developed for forecasting energy consumption and provides a unique basis for applying electrical load modeling to the activity of logical calculation of uncertain energy systems. However, the Petri Nets-ANFIS algorithm does not pay attention to the effects of the parameters. These constraints, such as weight, energy consumption and security of energy demand forecasts, are based on known load data.
The GCC states total energy consumption calculated as shown in for the years 2012 until 2019. shows the energy consumption for the same period with estimated values until the year 2030. In addition, illustrated the percentage energy consumption for the years 2012 until 2019. The highest value belongs to KSA, where the lowest belongs to Kingdom of Bahrain. The sequence of the energy consumption in percentage from the lowest until the highest is Bahrain, Oman, Qatar, Kuwait, UAE, KSA through the years mentioned earlier.
Figure 8. GCC energy consumption versus years 2012–2030.
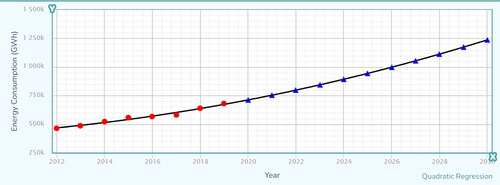
Figure 9. Energy consumption as a percentage for the years 2012–2019.
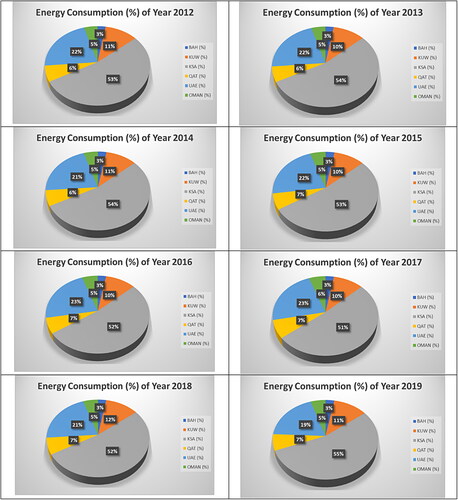
Table 6. GCC states total energy consumption.
The model obtained for the GCC energy consumption versus the years 2012 until 2030 as second order polynomial quadratic regression is:
(10)
(10)
5. Conclusion and policy implications
The developed Petri Nets-ANFIS model assists to find the expected energy consumption for the future. The obtained results of the models for the six GCC countries illustrate clearly that the models help in finding the most reliable power network of the system under study and help to plan for the future how much the plant(s) needs to be expanded and by how much energy. Electric energy consumption estimates guide to outstanding savings in costs of a power plant from the maintenance and operation point of view. Also, the reliability of the electric power supply and transportation and delivery system is maximized. This will serve to take the correct decisions for the future development of the power plant in general. The present study forms the most important models for the countries to estimate the targeted energy consumption. Based on the Petri Nets-ANFIS, the developed model of each country can be modeled and investigated. Also, the present research helps to keep away from the huge generation capacity. It can be concluded that the methodology helps GCC and other countries to avoid load shedding and meet the reasonably expected energy demand for the different sector(s). Also, Petri Nets-ANFIS which has been developed in the present study serves in the development of any country’s economy. The results show that the energy consumption in percentage from the lowest until the highest is Bahrain, Oman, Qatar, Kuwait, UAE, KSA through the years 2012-2019. The highest value of the energy consumption of the GCC is 680420 GWhr. A novel forecasting model developed in the present study to estimate the energy consumption forecast that helps to analyze the GCC electricity markets. The proposed energy consumption forecast models evaluate the strategy evaluated with different parameters. The energy consumption affects the surrounding environment. As a future work, the study might be extended using other software(s) to compare the results with the existent results. In addition, as a recommended point for future work as well to consider extension of the discussed present study that will helps the analysis and prediction of electricity consumption by adding more parameters other than discussed in this study.
Acknowledgment
The author would like to thank Ms. Aysha Qamber for the great help during preparation of the article, the preparation of this paper.
Disclosure statement
No potential conflict of interest was reported by the authors.
References
- Al Bannay, S., & Takizawa, S. (2022). Decoupling of water production and electricity generation from GDP and population in the Gulf Cooperation Council (GCC) countries. Sustainability, 14(9), 5386. doi:10.3390/su14095386
- Al-Badi, A., & AlMubarak, I. (2019). Growing energy demand in the GCC countries. Arab Journal of Basic and Applied Sciences, 26(1), 488–496. doi:10.1080/25765299.2019.1687396
- Al-Hamad, M. Y., & Qamber, I. S. (2019). GCC electrical long-term peak load forecasting modeling using ANFIS and MLR methods. International Arab Journal of Basic and Applied Sciences, 26(1), 269–282. doi:10.1080/25765299.2019.1565464
- Bellahsen, A., & Dagdougui, H. (2021). Aggregated short-term load forecasting for heterogeneous buildings using machine learning with peak estimation. Energy and Buildings Journal, 237, 110742. doi:10.1016/j.enbuild.2021.110742
- Chu, Y., Xu, P., Li, M., Chen, Z., Chen, Z., Chen, Y., & Li, W. (2020). Short-term metropolitan-scale electric load forecasting based on load decomposition and ensemble algorithms. Energy & Buildings, 225, 110343.
- de Mars, P., O’Sullivan, A., & Keppo, I. (2020). Estimating the impact of variable renewable energy on base-load cycling in the GB power system. Energy, 195, 117041. doi:10.1016/j.energy.2020.117041
- Hafeez, G., Alimgeer, K. S., & Khan, I. (2020). Electric load forecasting based on deep learning and optimized by heuristic algorithm in smart grid. International Journal on Applied Energy, 269, 114915. doi:10.1016/j.apenergy.2020.114915
- He, H., Pan, J., Lu, N., Chen, B., & Jiao, R. (2020). Short-term load probabilistic forecasting based on quantile regression convolutional neural network and Epanechnikov kernel density. Energy Reports, 6, 1550–1556. doi:10.1016/j.egyr.2020.10.053
- Heydari, A., Astiaso Garcia, D., Keynia, F., Bisegna, F., & De Santoli, L. (2019). Hybrid intelligent strategy for multifactor influenced electrical energy consumption forecasting. Energy Sources, Part B: Economics, Planning, and Policy, 14(10–12), 341–358. doi:10.1080/15567249.2020.1717678
- Heydari, A., Majidi Nezhad, M., Pirshayan, E., Astiaso Garcia, D., Keynia, F., & De Santoli, L. (2020). Short-term electricity price and load forecasting in isolated power grids based on composite neural network and gravitational search optimization algorithm. Applied Energy, 277, 115503. doi:10.1016/j.apenergy.2020.115503
- Ismail, M. M., & Bendary, A. F. (2018). Load frequency control for multi area smart grid based on advanced control techniques. Alexandria Engineering Journal, 57(4), 4021–4032. doi:10.1016/j.aej.2018.11.004
- Iyanda, A. R., & Odejobi, O. A. (2015). Computational modelling technique for short-term electric load forecasting. Journal of Engineering and Engineering Technology (FUTAJEET), 9(2), 89–95.
- Jang, J. S. R., Sun, C. T., & Mizutani, E. (1997). Neuro-fuzzy and soft computing. Hoboken, NJ: Prentice Hall.
- Kim, W., Duong, V., Nguyen, T., & Choi, W. (2013). Analysis of the effects of inverter ripple current on photovoltaic power system by using an AC impedance model of the solar cell. Renewable Energy, 59, 150–157. doi:10.1016/j.renene.2013.03.035
- Labadi, K., Benarbia, T., Hamaci, S., & Darcherif, A. (2012). Petri Nets models for analysis and control of public bicycle-sharing systems, Chapter 21 (Open access peer-reviewed chapter). London, UK: IntechOpen Publisher. doi:10.5772/47774
- Lindberg, K. B., Bakker, S. J., & Sartori, I. (2019). Modelling electric and heat load profiles of non-residential buildings for use in long-term aggregate load forecasts. Utilities Policy, 58, 63–88. doi:10.1016/j.jup.2019.03.004
- Nie, P., Roccotelli, M., Fanti, M., Ming, Z., & Li, Z. (2021). Prediction of home energy consumption based on gradient boosting regression tree. Energy Reports, 7, 1246–1255. doi:10.1016/j.egyr.2021.02.006
- Nie, Y., Jiang, P., & Zhang, H. (2020). A novel hybrid model based on combined preprocessing method and advanced optimization algorithm for power load forecasting. Applied Soft Computing Journal, 97, 106809. doi:10.1016/j.asoc.2020.106809
- Peng, H., Yan, J., Yu, Y., & Luo, Y. (2021). Time series estimation based on deep learning for structural dynamic nonlinear prediction. Structures Journal, 29, 1016–1031. doi:10.1016/j.istruc.2020.11.049
- Qamber, I. S. (2020). Power system control and reliability: Electric power design and enhancement. New York, NY: AAP & CRC, Taylor & Francis.
- Qamber, I. S. (2021). Development model of the inverter size for the GCC countries. Applications of Modelling and Simulation, 5, 1–6.
- Qamber, I. S., & Al-Hamad, M. Y. (2020). Power system market planning: Losses indices calculation and modeling. Saarbrücken, Germany: LAP LAMBERT Academic Publishing GmbH & Co. KG.
- Solti, A., Vana, L., & Mendling, J. (2015). Time series Petri Net models—Enrichment and prediction. Published in SIMPDA 2015, Computer Science. doi:10.1007/978-3-319-53435-0_6
- Statista. (n.d.). Annual maximum average temperature in the United Arab Emirates from 2013 to 2020. Published by Statista Research Department. Webpage: https://www.statista.com/statistics/633084/uae-maximum-average-annual-temperature/.
- Vrontakis, K. E., Kampianakis, A. N., & Tsinarakis, G. J. (2016). A Petri Net based methodology for modelling, analysis, demand forecast and optimal planning of batch production systems. 2016 IEEE International Conference on Systems, Man, and Cybernetics (SMC 2016); 9–12 October, Budapest, Hungary, pp. 1136–1141.
- Wang, Q., Wang, X., & Yang, S. (2014). Energy consumption modelling of the machining system based on Petri Net. Advances in Mechanical Engineering, 6, 324819. doi:10.1155/2014/324819
- Wei, C., Wu, Q., Xu, J., Sun, Y., Jin, X., Liao, S., … Yu, L. (2020). Distributed scheduling of smart buildings to smooth power fluctuations considering load rebound. Applied Energy, 276, 115396. doi:10.1016/j.apenergy.2020.115396
- Zhang, C., Zhao, Y., Zhang, X., Fan, C., & Li, T. (2017). An improved cooling load prediction method for buildings with the estimation of prediction intervals. Procedia Engineering, 205, 2422–2428. doi:10.1016/j.proeng.2017.09.967