
Abstract
In forensic toxicology, precise determination of toxic trace metals in biological samples is critical. Inductively coupled plasma optical emission spectrometry (ICP OES), which has a low limit of detection, high sensitivity, accurate testing, and high analytical efficiency, is one of the most widely used techniques for determining the level of toxic trace metals in biological samples. This study aimed to assess the efficiency of ICP-OES in estimating cadmium (Cd) and lead (Pb) in whole blood samples when viewed axially, dual, and radially. All the samples that were analyzed were digested in 1.5 ml HNO3 and 2 ml H2O2. Selectivity, linearity, recovery, limits of detection (LOD), and quantification (LOQ) were used to validate the system. Cd-axial and radial recovery values were between 82–96 and 84–97%, while Pb-axial and radial recovery values were between 85–94 and 83–99%. Dual Cd-axial and radial recovery values were between 80–92 and 82–94%, while dual Pb-axial and radial recovery values were between 77–92 and 75–96%. The results demonstrated that the axillary and radially view is preferable to the dual view when using separate axially and radially view inductively coupled plasmas (ICP). In axillary and radially views, Cd's recovery rates were better than Pb's in the separate mode, but overall they were satisfactory. The recovery values for Cd and Pb in the dual view were acceptable but not sufficient.
1. Introduction
Toxic trace metals are inorganic compounds, some of them are essential to support various biological functions, and some are toxic. Toxic trace metals are the most famous and oldest toxins throughout history. Over the years, accumulating scientific evidence shows the association of significant health problems with heavy metal intoxication (Jaishankar et al., Citation2014; Raposo & Ibelli-Bianco, Citation2020). Therefore, the determination of their levels in biological samples is essential in forensic toxicology.
To ensure the correctness of the working method for estimating toxic trace metals. Standard methods utilized outside typical ranges, extensions, and modifications of standard methods must be verified by the laboratory to assure the accuracy of the working method for estimating toxic trace metals (Draghici et al., Citation2011). The process must be validated using instruments and tools within specifications, working correctly and properly calibrated (Instituto Nacional de Metrologia & Normalização e Qualidade Industrial, Citation2010).
The development of robust and reliable analytical methods for determining toxic trace metals levels in biological samples is essential for developing biological models to understand the relationship between toxic trace metals and diseases and the interpretation of poisoning cases in various crimes. Inductively coupled plasma optical emission spectrometry (ICP-OES) is one of the most common techniques for determining these metals. The ability to obtain a low limit of detection (LOD), high sensitivity, accurate testing, and a relatively high degree of analytical efficiency are the main advantages of ICP OES (Sharma, Citation2020).
Axial viewing mode is commonly used in most modern ICP systems, and it has a much higher sensitivity to med to the central channel diameter than radial viewing. However, matrix effects and self-absorption phenomena were reported (Beauchemin, Citation2020; Stepan et al., Citation2001). Self-absorption is also improved by axial viewing using robust plasma conditions; these limitations can be minimized or reduced (Brinkman et al., Citation2013). In comparison to radial view ICPs, axial ICPs can have improvement factors ranging from 3 to 10 times depending on the spectrometer's resolution. Improvements in the detection limit may be advantageous for basic environmental applications for a minor cost increase, although it has been proven that radial view ICPs are more stable than axial view ICPs. One of the early detected drawbacks of axial plasma was ionization-induced interference (Noland et al., Citation2010). This was resolved by removing the fireball area of the plasma and focusing the view on the central channel. Advances in systems characteristics such as optical baffling and resolution improved radial ICPs in terms of noise. However, such enhancements severely affected the signal, minimizing the detection limit. These limitations were resolved recently with the advent of radial ICP instruments with improved resolution and optical efficiency, which results in enhanced detection limits that far surpassed the earlier low-resolution radial instruments and the published detection limits of axial ICP (Georgiou & Danezis, Citation2015).
The conical cooling interface of the ICP-OES instrument, which is innovative, removes the plasma tail, allowing for linear dynamic range increase and matrix decrease interactions like ionizing metals' impacts to be managed. The cooled conical interface also protects the optics from the window of hot plasma gases. When optimized for the sensitivity required, axially displayed is a favorite instrument. In the radial view shown by ICP-OES instruments, the plasma tail is off the optical path, and hot plasma gases flush directly into the exhaust. Radial view ICP-OES is ideal for routine complex analysis sample matrices. The dual view ICP-OES reduces analysis and operation time costs in either mode. Superior optics allow full wavelength coverage to be made in one measurement, making the 700 series the only sync ICP-OES in the world. Exceptional plasma generation, plasma interface, optics, and detection remove many restrictions that a dual display is designed to overcome (de Souza et al., Citation2008). Whole blood, primarily utilized used for elemental analysis, is the most acceptable human biological sample. For several years, blood samples have been used to evaluate the levels of trace heavy metals in the human body (Gajek et al., Citation2013; Lemos & de Carvalho, Citation2010; Yahaya et al., Citation2013).
The goal of this study was to examine the efficiency of different viewing modes for determining cadmium and lead in whole blood samples, as well as to investigate the relationship between cadmium and lead concentrations.
2. Methods
2.1. Reagents, chemicals, and standard solutions preparation
Nitric acid HNO3, 69% was purchase from Panreac (Germany), Hydrogen peroxide H2O2, 35% from Riedel-de Haen (Germany), and Distilled water from the laboratory water purification system from Elga, UK. Standard calibration solutions of Cd and Pb were purchased from Agilent Technologies, USA. All other reagents were of analytical grade. The plasticware was cleaned with warm water and liquid detergents, followed by soaking in HNO3 5% for 24 hours, and then rinsed with distilled water.
2.2. Collection of blood samples
After signing an informed consent form and the study was authorized by the institutional review board (IRB) at Naif Arab University for Security Sciences (NAUSS), 5 ml of whole blood samples were taken from 24 healthy Tabuk city participants aged 18–50 years. The study was approved by an ethical under approval protocol number HA-01-R-092. After adding 0.5 ml of HNO3 69% to each sample, samples were collected in EDTA blood collection tubes and stored at −20 °C until analysis time.
2.3. Digestion of blood samples
For each element, whole blood samples were prepared in the following manner: In a PTFE microwave tube, 750 µl of whole blood was spiked with 3 ml of working standard solution (60 µg/l) from Cd and Pb, followed by 1.5 ml concentrated HNO3 69% and 2 ml of H2O2 35%. After a 10-minute incubation period, 8 ml of deionized distilled water was added, and PTEF vessels (20 ml were tightly closed and loaded in microwave digestion at a constant presser, as follows:
2.4. Instrumentation
The analysis of whole blood samples has been carried out using ICP-OES at the forensic sciences department—College of Criminal Justice at NAUSS, KSA. ICP OES (model: 5110 VDV, Agilent Technologies, USA) was operated under suitable conditions, including choosing the suitable wavelength for each element (Cd 214.439 nm, Pb 220.353 nm). The selection of this wavelength was due to no possible inferences at these emission lines, and a good baseline was observed than other wavelengths. The plasma argon flow rate of 12 l/min, auxiliary argon flow rate of 1 l/min, nebulizer argon flow rate of 0.7 l/min, integration time 100 s, read delay of 20 s, and peristaltic pump flow rate of 1 ml/min.
2.5. Validation method
In the presented study, the investigation has been performed with linearity to examine method reliability, accuracy, precision, sensitivity (LOQ, LOD), and linearity order to examine method reliability (Rao, Citation2018).
2.6. Linearity
The method’s linearity is examined by evaluating the regression line and it is ascertained as a coefficient of determination (r2). The investigation of linearity is performed within a quantitative concentration array of 30, 50, 70, 90, 110, and 130 µg/ml in a blood sample concerning each analyte. The analysis of linearity data is performed within the adequate value of the coefficient of determination r2 ≥ 0.99 of the linear regression line.
2.7. Accuracy
The closeness between the actual value of the analyte and the value obtained by the analytical technique is defined as accuracy or recovery. It's a parameter that assures no loss or contamination throughout the analytical process, which helps determine the number of different components. Spikes with three distinct levels of analyte were held spikes from a sample with low metal content. For at least three days, samples were subjected to the maximum possible procedure stages, with replicates twice a day. Accuracy should be within 15% of the actual value.
2.8. Precision
Precision was determined and expressed as a percentage of relative standard deviation (% RSD) and should not surpass 15% at any concentration level.
2.9. Sensitivity
The evaluation of sensitivity is done by ascertaining the limit of quantification (LOQ) and limit of detection (LOD) for each analyte. The LOD is identified as the signal-to-noise ratio ≥ 3 (identified by high point) with acceptable chromatography peak shape and good resolution. The LOQ is identified as a signal-to-noise ratio ≥ 10.
3. Results and discussion
ICP-OES analysis of biological material is gaining popularity among emission techniques due to its ease of use, ability to identify many metals simultaneously, fast measurement time, good tolerance to higher metal concentrations, and relatively few matrix effects (Mochizuki et al., Citation2002).
Continuous improvement of the plasma emission spectrometer, through nebulization of sample method, generator structure, the optical system, and detector type, leads to lower detection limits, increased accuracy, resolution, and improved spectrum stability over time (Nölte, Citation2021). For these reasons, modern ICP-OES spectroscopy instruments have become useful in clinical and forensic studies (Nölte, Citation2021; Rahil-Khazen et al., Citation2002), assessing environmental pollution, geology, and various industrial applications (Brooks et al., Citation2006).
This study was designed to compare the axial, radial, and dual viewing modes in the ICP-OES technique to determine Cd and Pb concentration in the whole blood samples.
.
At the beginning of the experiment, it is necessary to ensure optimal conditions for ICP-OES to determine the metals according to the parameters recommended by the Agilent equipment guide (Agilent Technologies, Citation2018). Monitoring these parameters confirms the device's ability to read the sample. Therefore, these values must be performed daily to verify the ICP-OES device and the correlation coefficient of the calibration method (Daftsis & Zachariadis, Citation2008).
4. Method validation
The validation method of the analytical assays of this study was performed by calculating linearity, the limit of quantitation (LOQ), the limit of detection (LOD), and recovery (Tiwari & Tiwari, Citation2010).
4.1. Linearity
Linearity for the target metals, calibration curves were created in duplicate at concentrations of 30, 50, 70, 90, 110, and 130 µg/ml, containing all the metals studied. The correlation coefficient values for Cd-Axial view (0.998), Pb-axial view (0.997), Cd-Radial view (0.999), Pb-Radial view (0.993), Cd-dual-axial view (0.999), and Cd-dual-radial view (0.999), Pb-dual-axial view (0.997), and Pd-dual-radial view (0.998). All the correlation coefficients (r2) were within the national standards limit (Rao, Citation2018) (r2 0.99), with the smallest one (0.993) being obtained for redial view Pb, which was beyond this limit, , .
Figure 1. Linearity data was obtained from a calibration curve that contained a standard solution of Cd and Pb.
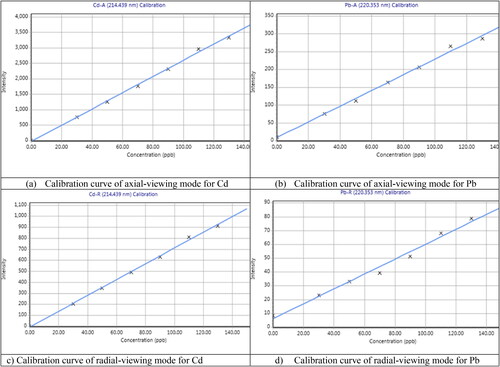
Table 1. Correlation coefficient and regression equations for Cd and Pb.
4.2. Accuracy and precision
The concentration of the pure sample and three known concentrations of the samples were read to obtain accuracy (recovery) % Rec. The average results were within the range of (80 to 120%) for Cd-Axial view (92%), Pb-axial view (89%), Cd-Radial view (92%), Pb-Radial view (89%), Cd-dual-axial view (88%), and Cd-dual-radial view (89%), Pb-dual-axial view (87%), and Pd-dual-radial view (84%) . The % Rec recommended by national standards (Miller & Miller, Citation2010; Olmedo et al., Citation2010) must be within the range of 80 to 120%. Recovery values of Cd-axial view and radial view post-spiked samples ranged between 82–96 and 84–97%, whereas Pb-axial view and radial view recovery values ranged between 85–94 and 83–99%. Simultaneously, dual Cd-axial view and radial view recoveries ranged between 80–92 and 82–94%, while dual Pb-axial view and radial view ranged between 77–92 and 75–96%. This indicates a loss of elements during sample preparations and measurement steps in separate and combined axial view and radial view techniques for Cd and Pb. Thus, no significant differences were observed (p < 0.05), and the accuracy observed was found to be entirely satisfactory (Miller & Miller, Citation2010; Olmedo et al., Citation2010).
Table 2. Recovery for standard toxic trace metals understudy.
Unfortunately, the ICP-OES method does not establish reference values of certain metals, such as Pb or Cd, under test, especially in blood, where they occur at low levels, as a result of the findings of this study. Pb and Cd recoveries in blood, for example, are unsatisfactory; this agrees with Subramanian (Petrov, Citation2017), who suggested that determining Pb and Cd in blood by ICP OES requires initial concentration and separation of the metal from the matrix and that the microwave method used in atomic absorption spectroscopy analyses could be used in ICP OES analyses.
Precision was determined using the same procedures as accuracy. The mean, SD, and RSD for each metal were calculated at various levels of a spike. In the radial view mode of Pb, the maximum %RSD was 6.83%, as shown in a). However, an appropriate percentage range for precision has not been determined. It should be as small as possible within the permissible limitations of the procedure under examination, according to national and international standards. According to national standards, the precision percentage was consistent to be consistent with the technique (Instituto Nacional de Metrologia & Normalização e Qualidade Industrial, Citation2010)
Table 3 (a). Validation parameters.
Table 3 (b). Validation parameters.
5. Sensitivity
The instrument’s sensitivity in measuring the desired metal in whole blood samples was evaluated by measuring LOD and LOQ. LOD for Cd (axial view and radial view) and Pb (axial view and radial view) were 51.9, 47.3, 33.7, and 20.7 µg/ml, respectively, and LOD for Cd-dual view (axial and radial) and Pb-dual view (axial and radial) were 24.8, 10.3, 35.5, and 12.7 µg/ml, respectively while the LOQ for Cd (axial view and radial view) and Pb (axial view and radial view) were, 78.9, 143.3, 102.1, and 62.8 µg/ml and LOQ for Cd-dual view (axial and radial) and Pb-dual view (axial and radial) were 75.0, 31.2, 107.7, and 38.5 µg/ml . Because precision, LOD, and LOQ are specific to each method, the paths are considered acceptable according to national standards (Peters et al., Citation2004, Citation2007).
Conclusion
In this investigation, ICP-OES was used to assess the levels of toxic trace metals Pb and Cd in whole blood samples in various viewing modes to find the most efficient viewing modes for recovering these elements from whole blood. Under the validation protocol, the method demonstrated adequate linearity, precision, accuracy, LOD, and LOQ (Agilent Technologies, Citation2018). A loss of elements was observed during sample preparations and measurements in (axial view and radial view) and dual viewing modes for Cd and Pb. In the axial and radial views, Cd's recovery values were better than Pb's, with satisfactory mean values. However, both elements’ recovery values are acceptable but not satisfactory in the dual viewing mode. To assess the levels of additional trace elements in biological samples, more research on other biological samples and testing of other analytical instruments should be undertaken and compared to the findings of this study.
Authors’ contributions
Hatem Abdel Moniem Ahmed The idea of the project and discussion of the results. Asma Obaidullah Alatawi The theoretical background of the research. The practical part of the project. Discussion of results.
Availability of data and material
The data that support the findings of this study are available on request from the corresponding author.
Disclosure statement
The authors have no conflicts of interest to declare relevant to this article’s content.
Additional information
Funding
References
- Agilent Technologies. (2018, July). Agilent 5100 and 5110 ICP-OES (6th ed.). Australia: Agilent Technologies.
- Beauchemin, D. (Ed.). (2020). Sample introduction systems in ICPMS and ICPOES. Newnes.
- Brinkman, U. T., Dorsey, J. G., & Durig, J. R. (Eds.). (2013). TRAC: Trends in analytical chemistry (Vol. 7).
- Brooks, T. R., Bodkin, T. E., Potts, G. E., & Smullen, S. A. (2006). Elemental analysis of human cremains using ICP‐OES to classify legitimate and contaminated cremains. Journal of Forensic Sciences, 51(5), 967–973. doi:10.1111/j.1556-4029.2006.00209.x
- Daftsis, E. J., & Zachariadis, G. A. (2008). Analytical performance of a multi-element ICP-AES method for Cd, Co, Cr, Cu, Mn, Ni and Pb determination in blood fraction samples. Microchimica Acta, 160(4), 405–411. doi:10.1007/s00604-007-0791-2
- de Souza, R. M., Leocadio, L. G., & da Silveira, C. L. P. (2008). ICP OES simultaneous determination of Ca, Cu, Fe, Mg, Mn, Na, and P in biodiesel by axial and radial inductively coupled plasma-optical emission spectrometry. Analytical Letters, 41(9), 1615–1622. . doi:10.1080/00032710802122248
- Draghici, C., Jelescu, C., Dima, C., Coman, G., & Chirila, E. (2011). Heavy metals determination in environmental and biological samples. In Environmental heavy metal pollution and effects on child mental development (pp. 145–158). Springer. doi:10.1007/978-94-007-0253-0_9
- Gajek, R., Barley, F., & She, J. (2013). Determination of essential and toxic metals in blood by ICP-MS with calibration in synthetic matrix. Analytical Methods, 5(9), 2193–2202. doi:10.1039/c3ay26036d
- Georgiou, C. A., & Danezis, G. P. (2015). Elemental and isotopic mass spectrometry. In Comprehensive analytical chemistry (Vol. 68, pp. 131–243). Elsevier. doi:10.1016/B978-0-444-63340-8.00003-0
- Instituto Nacional de Metrologia, Normalização e Qualidade Industrial. (2010). Orientação sobre validação de métodos analíticos.
- Jaishankar, M., Tseten, T., Anbalagan, N., Mathew, B. B., & Beeregowda, K. N. (2014). Toxicity, mechanism, and health effects of some heavy metals. Interdisciplinary Toxicology, 7(2), 60–72. doi:10.2478/intox-2014-0009
- Lemos, V. A., & de Carvalho, A. L. (2010). Determination of cadmium and lead in human biological samples by spectrometric techniques: A review. Environmental Monitoring and Assessment, 171(1–4), 255–265. doi:10.1007/s10661-009-1276-z
- Miller, J., & Miller, J. C. (2010). Statistics and chemometrics for analytical chemistry. Pearson Education.
- Mochizuki, M., Hondo, R., & Ueda, F. (2002). Simultaneous analysis for multiple trace metals in contaminated biological samples. Biological Trace Element Research, 87(1–3), 211–223. doi:10.1385/BTER:87:1-3:211
- Noland, J., Benitez, J. Y., Leitner, D., Lyneis, C., & Verboncoeur, J. (2010). Measurement of radial and axial high energy x-ray spectra in electron cyclotron resonance ion source plasmas. The Review of Scientific Instruments, 81(2), 02A308. doi:10.1063/1.3258614
- Nölte, J. (2021). ICP emission spectrometry: A practical guide. John Wiley & Sons.
- Olmedo, P., Pla, A., Hernández, A. F., López-Guarnido, O., Rodrigo, L., & Gil, F. (2010). Validation of a method to quantify chromium, cadmium, manganese, nickel and lead in human whole blood, urine, saliva and hair samples by electrothermal atomic absorption spectrometry. Analytica Chimica Acta, 659(1–2), 60–67. doi:10.1016/j.aca.2009.11.056
- Peters, F. T., Drummer, O. H., & Musshoff, F. (2007). Validation of new methods. Forensic Science International, 165(2–3), 216–224. doi:10.1016/j.forsciint.2006.05.021
- Peters, F. T., Hartung, M., Herbold, M., Schmitt, G., Daldrup, T., & Musshoff, F. (2004). Anlage zu den Richtlinien der GTFCh zur Qualitätssicherung bei forensisch-toxikologischen Untersuchungen, Anhang C: Anforderungen an die Durchführung von Analysen, 1. Validierung. Toxichem Krimtech, 71(3), 146–154.
- Petrov, P. (2017). Irena Baranowska (Ed.): Handbook of trace analysis: Fundamentals and applications. Analytical and Bioanalytical Chemistry, 409(14), 3495–3497. doi:10.1007/s00216-017-0324-8
- Rahil-Khazen, R., Bolann, B. J., Myking, A., & Ulvik, R. J. (2002). Multi-element analysis of trace element levels in human autopsy tissues by using inductively coupled atomic emission spectrometry technique (ICP-AES). Journal of Trace Elements in Medicine and Biology, 16(1), 15–25. . doi:10.1016/S0946-672X(02)80004-9
- Rao, T. N. (2018). Validation of analytical methods. In Calibration and validation of analytical methods—A sampling of current approaches (pp. 131–141). doi:10.5772/intechopen.72087
- Raposo, F., & Ibelli-Bianco, C. (2020). Performance parameters for analytical method validation: Controversies and discrepancies among numerous guidelines. TrAC Trends in Analytical Chemistry, 129, 115913. doi:10.1016/j.trac.2020.115913
- Sharma, I. (2020). ICP-OES: An advance tool in biological research. Open Journal of Environmental Biology, 5(1), 27–33. doi:10.17352/ojeb.000018
- Stepan, M., Musil, P., Poussel, E., & Mermet, J. M. (2001). Matrix-induced shift effects in axially viewed inductively coupled plasma atomic emission spectrometry. Spectrochimica Acta Part B: Atomic Spectroscopy, 56(4), 443–453. doi:10.1039/b709359d
- Tiwari, G., & Tiwari, R. (2010). Bioanalytical method validation: An updated review. Pharmaceutical Methods, 1(1), 25–38. doi:10.1016/S2229-4708(10)11004-8.
- Yahaya, M. I., Shehu, A., & Dabai, F. G. (2013). Efficiency of extraction of trace metals from blood samples using wet digestion and microwave digestion techniques. Journal of Applied Sciences and Environmental Management, 17(3), 365–369. doi:10.4314/jasem.v17i3.4