
Abstract
The PROMISE study assessed revisions designed to facilitate implementation of an HIV care coordination program (CCP) addressing gaps in care and treatment engagement among people living with HIV in New York City (NYC). Through latent class analysis (LCA) of a discrete choice experiment (DCE), we explored heterogeneity of provider preferences regarding CCP features. From January-March 2020, 152 NYC CCP providers completed a DCE with 3–4 levels on each of 4 program attributes: 1) Help with Adherence to Antiretroviral Therapy (ART), 2) Help with Primary Care Appointments, 3) Help with Issues Other than Primary Care, and 4) Where Program Visits Happen. We used LCA to assess patterns of preference, and choice simulation to estimate providers’ endorsement of hypothetical CCPs. LCA identified three subgroups. The two larger subgroups (n = 133) endorsed more intensive individual program features, including directly observed therapy, home visits, and appointment reminders with accompaniment of clients to their appointments. The smallest subgroup (n = 19) endorsed medication reminders only, appointment reminders without accompaniment, and meeting at the program location rather than clients’ homes. Choice simulation analysis affirmed the highest degree of endorsement (62%) for hypothetical programs combining the intensive features described above. Results indicated providers’ preference for intensive program features and also reinforced the need for flexible service delivery options. Provider perspectives on service delivery approaches can inform program adjustments for successful long-term implementation, which in turn can improve patient outcomes.
Introduction
Disparities in HIV viral suppression (VS) among people with HIV (PWH) in New York City (NYC) constitute a major obstacle to achieving the goals of the Ending the HIV Epidemic initiative [Citation1].
In 2009, 65% of PWH engaged in care in NYC had VS; though VS had increased to 79% by 2022, inequities have persisted, with lower rates of VS among Black and Latino people, transgender individuals, young people, and people with a history of injection drug use [Citation2, Citation3]. To address HIV outcome disparities and strengthen the HIV care continuum as a whole, the NYC Department of Health and Mental Hygiene (NYC Health Department) and its community partner, the HIV Health and Human Services Planning Council of New York, launched a multi-component HIV Care Coordination Program (CCP) in 2009 directed toward the most vulnerable, high-need PWH in NYC [Citation4].
The CCP combined several evidence-based elements including antiretroviral therapy (ART) adherence support, case management, outreach for initial case finding and for re-engagement as needed, and patient navigation [Citation4]. Despite the success of the CCP as measured by positive VS effects (relative to usual care) for newly diagnosed and previously unsuppressed CCP participants, the absence of an effect on VS among previously diagnosed PWH with any suppression in the year prior to enrollment left ample room for improvement [Citation4, Citation5]. Based on lessons learned in the first several years of the program’s existence, the NYC Health Department undertook a substantial revision of the CCP model and a resolicitation of CCP service delivery contracts in 2017–2018. Salient revisions to the CCP included elimination of rigid program tracks, allowance of video chat as a mode of delivery for services such as directly observed therapy (DOT), addition of a structured assessment and counseling protocol for client HIV self-management, and transition to a fee-for-service reimbursement model that accounts for staff travel to and from clients’ homes [Citation6]. The PROMISE study (Program Refinements to Optimize Model Impact and Scalability based on Evidence) was launched in 2018 to assess the impact and the implementation of the revised program model, as compared to the original CCP, which was designated by the U.S. Centers for Disease Control and Prevention (CDC) as a Structural Evidence-Based Intervention [Citation7].8
Discrete Choice Experiments (DCEs) are research tools that quantify preferences and trade-offs in decision making and are increasingly applied to HIV care program design [Citation8]. Provider and client preferences of CCP features can guide future revisions to program design and ultimately optimize real-world implementation and effectiveness. While past research has explored client preferences for HIV care and treatment services [Citation9–11], little work has been done to systematically ascertain the preferences of providers. Attention to provider preferences, including potential preference heterogeneity, could improve the acceptability, feasibility, and sustainability of care and treatment programs in the settings where they will be delivered [Citation12, Citation13]. In this way, a better understanding of provider perspectives on program implementation and delivery approaches has the potential to improve patient outcomes. Here we report results of an exploratory latent class analysis of a DCE among NYC CCP providers, to characterize preference heterogeneity in this population with regard to specific attributes of the revised CCP.
Methods
Study setting and population
The CCP is a medical case management (MCM) program funded under the Ryan White HIV/AIDS Program Part A. In part due to a robust Medicaid program for the coverage of medical care in New York State, Ryan White Part A funding in NYC has primarily been allocated to services other than medical care, including but not limited to various forms of case management, mental health services, housing assistance, food and nutrition services, health education, and harm reduction support. Therefore, our population of interest included non-medical providers in the core CCP positions of patient navigators/health educators, care coordinators/case managers, and program directors or other administrators, at any of the 25 agencies implementing the revised CCP. All staff in those core program roles were eligible to participate. Among the 25 agencies, there were 10 community health centers, 6 private hospitals, 3 public hospitals, and 6 community-based organizations. Eleven agencies were located in Brooklyn, 10 in Manhattan, 9 in the Bronx, 4 in Queens, and 1 in Staten Island. This study was approved by the NYC Health Department Institutional Review Board, which is the IRB of record for the PROMISE study. All participants provided informed consent electronically to participate in the DCE.
Definition of key terms
Discrete Choice Experiment (DCE) – Research methodology to measure preferences by presenting individuals with multiple sets of product or service alternatives defined by their features (attributes) with varying values (levels).
Latent Class Analysis (LCA) – Statistical technique to identify patterns in the data.
Relative D-efficiency – Measure of the effectiveness of the DCE design in estimating the result. The higher the relative D-efficiency, the stronger the design for accurately estimating the result. On this measure, 100% is ideal; 80% or above is considered reasonable.
Attribute, in DCE – Broader characteristic (or feature) of the program, product or package on which participant preferences are being assessed.
Level, in DCE – Value (or possible expression) of an attribute. Each attribute may have multiple levels.
Choice task – Survey question that includes at least two alternatives, defined using the attributes and their levels, and could also include an opt-out (‘None of these’) option.
Relative Importance – Influence of each attribute on the decision-making process, measured as a percentage. The total relative importance for all attributes adds to 100%.
Part-Worth Utility – Preference weight indicating the contribution of individual level to the total preference for a product or service alternative. The higher the part-worth utility, the greater the preference.
Choice Simulation – Technique used to predict the market share of hypothetical combinations of levels, based on the estimated part-worth utilities.
DCE design
Lighthouse Studio Version 9.8.1. (Sawtooth Software, Provo, Utah, USA) was used to implement the DCE. Here we briefly summarize the details of the DCE design, which have been previously described [Citation14]. Attributes and levels were developed from client and provider focus group studies, and with feedback from the study’s advisory board and CCP subject matter experts on the study team. The DCE included four attributes, two with four levels and two with three levels. In addition to level descriptions, images were displayed to improve understanding and to ease comparison of choice alternatives (See ) [Citation14].
Table 1. Attributes and levels in the DCE exploring preferences for HIV care coordination services in New York City.
Preferences for care coordination features were solicited by presenting participants with 10 choice tasks, a number that both minimizes cognitive burden and maximizes the efficiency of the DCE design [Citation15]. Each choice task presented participants with two random combinations of levels for each of the four attributes, with each combination, or alternative, differing by one or more levels (See Supplemental Figure 1). In each choice task, the participant was asked for their preference: ‘Imagine that you had to choose between two programs with the features below. Select the one that you would prefer.’ This survey design assumes that participants make a series of trade-offs when choosing one alternative over the other; there may be features in both alternatives that they value, but they are asked to choose the one they prefer as a whole. The design did not include a ‘None’ option.
Sawtooth Software’s experimental design module generated 300 different versions of the survey that were balanced (meaning that, across choice tasks, each level appeared with the same frequency) and orthogonal (meaning that each pair of levels appeared with the same frequency) [Citation16, Citation17]. The estimated standard error for each level ranged from 0.045 − 0.059. The design’s relative D-efficiency was deemed reasonable at 88%, compared to a completely enumerated design, i.e. one that includes all possible combinations of levels.
Sample size
We use the formula ‘n ≥ (500c)/(ta)’ to determine a minimum sample size of 100 to estimate main effect estimates, where n is the number of participants, t the number of choice tasks (t = 10), a the number of options per choice task (a = 2), and c the largest number of levels for any attribute (c = 4) [Citation18]. The target sample size was set at 150. While this was sufficient to estimate with precision the main effects for the entire sample, as reported elsewhere [Citation14], it is less than the recommended sample size of 200 participants per subgroup [Citation18]. As such, we consider this segmentation analysis to be exploratory.
Data collection
In January 2020, survey links were emailed with unique survey IDs to 227 providers from the 25 revised-CCP-implementing agencies. The DCE could be completed in any modern browser on a computer, tablet, or phone. Additional questions were included about providers’ age, race, ethnicity, gender identity, and care coordination services experience. Participants were compensated with $25 gift cards upon survey completion. The survey was closed in early March 2020. The DCE data were merged with agency descriptive data, such as staff role, agency location, and CCP budget, gathered from program liaisons and existing NYC Health Department contract records.
Analysis
Latent class analysis
The Latent Class Analysis (LCA) method in Lighthouse Studio’s Analysis Manager was implemented to understand providers’ preference heterogeneity. Here, we used LCA to identify subgroups of providers by analyzing patterns of part-worth utilities. Part-worth utilities are estimates of preference weights for attributes’ levels based on how frequently those levels were present in the alternatives chosen by each participant. Higher utility is interpreted as higher preference. The relative importance of an attribute is the proportion of its utility range compared to the total utility range of all attributes. It measures each attribute’s influence on participants’ decision making [Citation19], with a higher percentage indicating greater impact of the attribute on choice.
The size of the subgroups varies depending on the patterns in the data. The optimal number of subgroups in LCA was determined using model fit statistics such as Akaike’s information criterion (AIC), Log-likelihood ratio, and the Relative Chi-Square difference [Citation12, Citation20]. Solutions ranging from two to five subgroups were evaluated. After the number of subgroups was established, part-worth utilities and relative attribute importances were compared across the subgroups. Additional analyses were conducted with SAS software (Release 9.4 SAS Institute Inc., Cary, NC, USA). Significance testing was two-tailed, with alpha = 5%.
Choice simulation analysis
Sawtooth Software’s Choice Simulator was used to estimate the market share of various hypothetical MCM programs for each LCA subgroup. The simulation was designed to reflect diverse CCP implementation approaches, allowing flexibility in service options within different attributes. For example, since in a DCE only one level of each attribute may be endorsed through a participant’s selection within a choice task, the levels Specialty Medical Care and Mental Health Care are treated as mutually exclusive in the Help with Issues Other than Primary Care attribute. However, in reality, both services may be offered within the same program. The choice simulation analysis enabled us to emulate such real-life scenarios through these hypothetical programs. Using utilities estimated from the DCE, the choice simulation predicted the types of programs – combinations of features rather than individual features – that providers would be more likely to endorse.
Subject matter experts in CCP design and implementation from the NYC Health Department, who also work with CCP providers on quality management/process improvement projects, conceived of eight hypothetical MCM programs by incorporating the attributes and levels from the DCE () [Citation14] and provider preferences elicited by analysis of the DCE. In this way, the hypothetical programs reflect both what is feasible and the range of what was found to be preferable. The eight hypothetical program models were then aggregated based on their relative intensity: Basic, Medium, and Intensive (See ). The intensity of the program was determined according to the degree of client support and provider labor involved. For example, home visits 30 or 60 min away from the program location represent a more intensive service delivery approach than meetings at the program location or via phone or video chat, and directly observed therapy represents a more intensive approach to adherence support than adherence assessments or medication reminders.
Table 2. List of hypothetical programs with the corresponding attribute levels.
The choice simulation analysis employed the randomized first choice simulation model. The model involves summing and exponentiating the utilities across the levels of each hypothetical program to calculate the probability of one hypothetical program being preferred over others. The randomized first choice model has a superior predictive ability compared to other methods, as it accounts both for random error in the utilities’ estimates and the similarities among the hypothetical options. The choice simulation analysis results offer insights into the types of programs, as a whole, that participants would be most likely to endorse [Citation21, Citation22].
Results
Characteristics of participants & group segmentation
presents the demographics and professional backgrounds of the 152 participating providers, stratified by preference group. Of these providers, 52.0% (n = 79) were 20–39 years old, 82.3% (n = 125) identified as Latino/a or Black, and 68.4% (n = 104) were female. The majority, 65.1% (n = 99), were navigator-type staff, followed by 21.7% (n = 33) care coordinator-type staff, and 13.2% (n = 20) administrative staff. Over half of the participants (57.9%, n = 88) had over two years of experience in delivering CCP services.
Table 3. Characteristics of provider respondents.
Regarding agency characteristics, 84% (n = 128) of providers worked in clinic-based agencies, and 76.3% (n = 116) had experience with both the original and the revised CCP. Geographically, providers’ program locations were distributed as follows: Manhattan 34.2% (n = 52), Bronx 27.6% (n = 42), Brooklyn 24.3% (n = 37), Queens 9.2% (n = 14), and Staten Island 4.6% (n = 7).
The number of LCA groups was chosen using the AIC, Log-likelihood ratio, and the Relative Chi-Square difference. Despite the five-class solution having a lower AIC and a higher Log-likelihood, the three-class solution was selected for its greater Chi-Square difference and simplicity. Further details are provided in the Supplemental Materials.
The three-class solution produced the following distribution: 63.8% (n = 97) in Group 1, 23.7% (n = 36) in Group 2, and 12.5% (n = 19) in Group 3. Agency type (clinic-based vs non-clinic-based) was the only characteristic showing statistically significant group differences; 94.7% of providers in Group 3 worked in clinic-based CCPs, compared to 87.6% in Group 1 and 69.4% in Group 2.
Though not statistically significant, some differences were noteworthy. Group 3 had a higher percentage (36.8%) of providers from agencies experienced only with the revised CCP, compared to 19.6% in Group 1 and 27.7% in Group 2. Additionally, Group 3 had a higher percentage of navigator-type providers (84.2%, compared with 64.9% in Group 1 and 55.6% in Group 2). Finally, Group 1 and Group 2 providers were more likely to be from agencies in Manhattan (37.1% and 33.3% respectively), while Group 3 providers were mostly located in the Bronx (31.6%) or Queens (26.3%).
Relative importance and part-worth utilities
compares the attribute relative importances across the LCA groups. compares the part-worth utilities and graphically displays their patterns within each attribute by LCA group.
Figure 1. Relative importance of each attribute of the HIV care coordination program for each provider group.
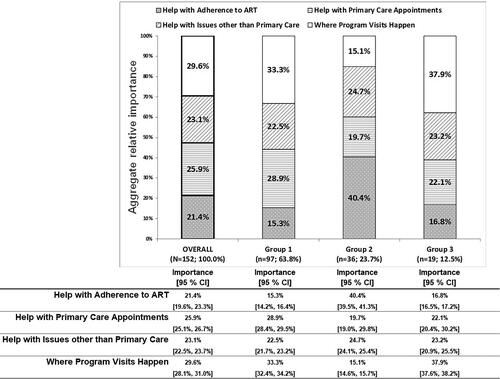
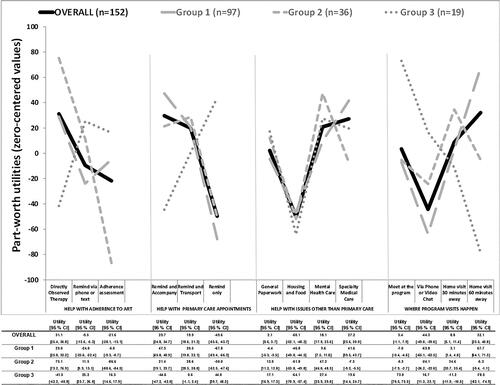
Figure 2. Plot of part-worth utilities (zero-centered values) for each level by provider group.
Regarding relative importance, the attribute Where Program Visits Happen had the highest relative importance for the overall sample (29.6%), Group 1 (33.3%) and Group 3 (37.9%), while Help with Adherence to ART had the least importance (21.4%, 15.3%, and 16.8%, respectively). However, Group 2 showed the reverse pattern, with Help with Adherence to ART being the most important attribute (40.4%) and Where Program Visits Happen being the least important (15.1%).
As for part-worth utility, the overall sample and Group 1 similarly endorsed Directly Observed Therapy for the Help with Adherence to ART attribute, Remind and Accompany for the Help with Primary Care Appointments attribute, Specialty Medical Care for the Help with Issues Other than Primary Care attribute, and Home Visit 60 min Away for the Where Program Visits Happen attribute. Group 2 also showed a preference for Directly Observed Therapy, but showed preferences for Remind and Transport, Mental Health Care, and Home Visit 30 min Away for the other attributes.
Although Group 1 and Group 3 had a similar pattern of importances, Group 3 endorsed Medication Reminders for Help with Adherence to ART, Remind Only for Help with Primary Care Appointments, Mental Health Care for Help with Issues other than Primary Care and Meet at the Program for Where Program Visits Happen.
Preferences for care coordination programs
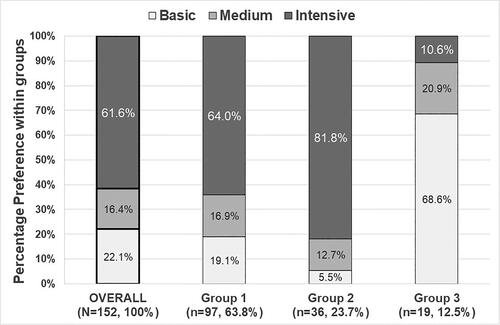
Choice simulation analysis estimated shares of preference in a single simulation scenario for the eight hypothetical CCP types, as outlined in . displays the shares of preference for the aggregated hypothetical CCPs. For the overall sample, Group 1, and Group 2, the Intensive program had the highest degree of endorsement (62%, 64%, and 82%, respectively). In contrast, Group 3 providers showed a preference (69%) for the Basic programs, characterized by use of medication reminders and by CCP meetings at the program location.
Figure 3. Choice simulation of the eight hypothetical care coordination programs, overall and by group.
Discussion
This study sought to explore the heterogeneity of provider preferences for discrete features and combinations of features in an HIV care coordination program. The findings of substantial preference heterogeneity suggest the potential value (with regard to provider uptake, implementation, and sustainment) of a flexible program model. Revisions made to the CCP in 2017–2018 were primarily directed at permitting greater flexibility (e.g. removal of program enrollment tracks with fixed visit-frequency requirements, and addition of video chat options for service delivery) and to foster differentiated care.
The analysis revealed underlying differences in preferences among providers, notably for Where Program Visits Happen and Help with Adherence to ART. While agency type was the only characteristic that showed statistically significant differences between groups, it may nonetheless be relevant that Group 3 had the highest proportion of providers at an agency in Queens compared to Groups 1 and 2, and the highest proportion of providers at an agency newly participating in the CCP under the revised model. Queens has more ‘transit deserts’ than other NYC boroughs, and differences in geography and public transit may play a role in providers’ preferences for visit location [Citation23]. Specifically, providers may be more likely to endorse home visits if they work at agencies with access to multiple public transportation options or with sufficient home-visiting staff to cover a large geographic area [Citation24, Citation25]. Additionally, staff at agencies with experience under the original and revised CCP, instead of the revised CCP only, may recognize the cumulative value of outreach work and home visits, despite the number of individual attempts that fail due to barriers such as clients not being home or not letting the provider in.
While staff role did not vary in a statistically significant way between groups, a larger majority of staff in Group 3 were patient navigator-type staff (84.2%), compared to staff in Groups 1 and 2 (64.9% and 55.6%, respectively). Staff in different roles may have different perspectives on DOT as an adherence strategy. In contrast to patient navigators, administrative staff do not themselves administer DOT, which requires substantial time and effort. Administrators often act as the liaisons between their programs and the NYC Health Department, and may be especially aware that the Health Department emphasizes DOT as an essential ART adherence strategy. As a result, they may be more apt to endorse DOT as an effective and evidence-based programmatic approach to improve treatment adherence [Citation26], without as much regard for the potential barriers to implementing DOT, which may be more influential for patient navigator preferences.
The choice simulation results highlight the endorsement among most providers in the study for intensive care coordination programs that provide support for psychosocial factors (e.g. mental health issues and housing instability) that often act as barriers to ART adherence; this finding is substantially supported by past research [Citation27–30]. A small subset of providers had a high share of preference in the simulation for Basic rather than Intensive MCM. Though not statistically significant in our small study, heterogeneity is expected in a large city with diverse client needs and widely spread Ryan White Part A agencies. This finding may indicate the need to ensure opportunities to share lessons learned between providers from different agencies.
There are limitations to this study. As a whole, DCEs collect data on stated preferences, not actual provider behavior. More specifically, this analysis should be characterized and interpreted as exploratory; though the sample size was within range for an unstratified DCE, larger sample sizes are generally recommended for segmentation analysis [Citation18]. The analysis also did not take into account agency differences in client populations, which could influence providers’ approaches to service delivery and the ranges in preferences between groups. In addition, interpretation of the findings is limited by the framing of the survey; it is unclear if providers’ stated preferences were based on what they prefer for themselves (to deliver) or for clients (to receive). Regardless of the motivation behind the preferences, the provider preferences identified in the DCE effectively highlight the factors that engage providers in service delivery, thus addressing the overall aim of the study. Because the surveys were completed by March 2020, they do not account for possible changes in provider preferences due to the COVID-19 pandemic. Lastly, as the study focused on HIV care coordination in NYC, its findings may not be generalizable to other regions with different demographic distributions and healthcare systems. Notwithstanding this limitation, the research offers valuable insights into providers’ preference breakdown for features within the NYC CCP.
Conclusion
The goal of this study was to characterize the heterogeneity of provider preferences for HIV CCP features. The results highlight the endorsement among most providers of a CCP with intensive program options around adherence support and visit location, as well as ways to help mitigate psychosocial barriers to adherence such as unstable housing and mental health challenges. The results also support the revised CCP’s flexible service model, enabling providers to meet the needs of the diverse clients these programs serve. DCEs capturing provider preferences for the delivery of evidence-based interventions offer an opportunity to maximize those interventions’ acceptability, feasibility, and sustainability in the settings where they will be delivered, and ultimately improve patient outcomes.
Authors’ contributions
DN and MI conceptualized the study. ABL conducted formative work. ABL, DN, MI, and RZ collaborated on the design of the data collection tool. CF and RZ performed statistical analyses. CF, MC, and RZ wrote the first draft of the paper. CF, MC, RZ, ABL, MR, JC, GG, ABL, MR, MI, and DN contributed to interpreting the data and to the writing and revising of the manuscript.
HRCP_Provider LCA Supplementary material_20231225.docx
Download MS Word (84.6 KB)Acknowledgements
The content is the sole responsibility of the authors and does not necessarily reflect the official views of NIH. We would like to acknowledge Sarah Kulkarni for her help with logistics and securing funding for the study; Sarah Kozlowski for her help with logistics and recruitment; Kate Taylor for her contribution to the conceptualization and drafting of the DCE; and Tye Seabrook, Grace Herndon, Scarlett Macías, Graham Harriman and the PROMISE qualitative research team [Rachel Schenkel, Thamara Tapia, Miguel Hernandez and Honoria Guarino], for their contributions to the larger project. We would also like to acknowledge the PROMISE Study Advisory Board members for their contributions to the study (in alphabetical order by last name): Mohammed Aldhuraibi for ACACIA Network, Lori Hurley for the STAR Program at SUNY Downstate Medical Center, Tiffany Jules for Services for the UnderServed, Inc., Genesis Luciano for AIDS Center of Queens County, Cyndi Morales for the Council on Adoptable Children, and Vanessa Pizarro for COMPASS.
Disclosure statement
No potential conflict of interest was reported by the author(s).
Additional information
Funding
References
- Fauci AS, Redfield RR, Sigounas G, et al. Ending the HIV epidemic: a plan for the United States. JAMA – J Am Med Assoc. 2019;321(9):844–845.
- HIV/AIDS Surveillance and Epidemiology Reports. [cited 5 Mar 2021]. Available from: https://www1.nyc.gov/site/doh/data/data-sets/hiv-aids-surveillance-and-epidemiology-reports.page.
- Xia Q, Lazar R, Bernard MA, et al. New York city achieves the UNAIDS 90-90-90 targets for HIV-infected whites but not latinos/hispanics and blacks. J Acquir Immune Defic Syndr. 2016;73(3):e59–e62.
- Nash D, Robertson MM, Penrose K, et al. Short-term effectiveness of HIV care coordination among persons with recent HIV diagnosis or history of poor HIV outcomes. PLoS One. 2018;13(9):e0204017.
- Robertson MM, Penrose K, Irvine MK, et al. Impact of an HIV care coordination program on durable viral suppression. J Acquir Immune Defic Syndr. 2019;80(1):46–55.
- Irvine MK, Levin B, Robertson MM, et al. PROMISE (program refinements to optimize model impact and scalability based on evidence): a cluster-randomised, stepped-wedge trial assessing effectiveness of the revised versus original ryan white part a HIV care coordination programme for patients with barriers to treatment in the USA. BMJ Open. 2020;10(7):e034624.
- Compendium. 2021 Jun 28. [cited 2021 Aug 16]. Available from: https://www.cdc.gov/hiv/research/interventionresearch/compendium/index.html.
- Eshun-Wilson I, Kim H-Y, Schwartz S, et al. Exploring relative preferences for HIV service features using discrete choice experiments: a synthetic review. Curr HIV/AIDS Rep. 2020;17(5):467–477.
- Youssef E, Cooper V, Miners A, et al. Understanding HIV-positive patients’ preferences for healthcare services: a protocol for a discrete choice experiment. BMJ Open. 2016;6(7):e008549.
- Zanolini A, Sikombe K, Sikazwe I, et al. Understanding preferences for HIV care and treatment in Zambia: evidence from a discrete choice experiment among patients who have been lost to follow-up. 2018.[30102693]
- Imbert E, Hickey MD, Del Rosario JB, et al. Understanding preferences for HIV care among patients experiencing homelessness or unstable-housing: a discrete choice experiment. J Acquir Immune Defic Syndr. 2020;90(2):140–145.
- Hauber AB, González JM, Groothuis-Oudshoorn CGM, et al. Statistical methods for the analysis of discrete choice experiments: a report of the ISPOR conjoint analysis good research practices task force. Value Health. 2016;19(4):300–315.
- Dubov A, Ogunbajo A, Altice FL, et al. Optimizing access to PrEP based on MSM preferences: results of a discrete choice experiment. AIDS Care. 2019;31(5):545–553.
- Zimba R, Fong C, Conte M, et al. Provider preferences for delivery of HIV care coordination services: results from a discrete choice experiment. J Int AIDS Soc. 2022;25(3):e25887.
- Bridges JFP, Hauber AB, Marshall D, et al. Conjoint analysis applications in health—a checklist: a report of the ISPOR good research practices for conjoint analysis task force. Value Health. 2011;14(4):403–413.
- Johnson FR, Lancsar E, Marshall D, et al. Constructing experimental designs for discrete-choice experiments: report of the ISPOR conjoint analysis experimental design good research practices task force. Value Health. 2013;16(1):3–13.
- Mangham LJ, Hanson K, McPake B. How to do (or not to do) … designing a discrete choice experiment for application in a low-income country. Health Policy Plan. 2009;24(2):151–158.
- Orme B. Getting started with conjoint analysis: strategies for product design and pricing research. 2010.
- Orme B. Latent class v4. 5: software for latent class estimation for CBC data. Orem (UT): Sawtooth Software; 2012.
- Zhou M, Thayer WM, Bridges JFP. Using latent class analysis to model preference heterogeneity in health: a systematic review. Pharmacoeconomics. 2018;36(2):175–187.
- Huber J, Orme B, Miller R. The value of choice simulators. In: Conjoint measurement. 4th ed. New York: Springer; 2007. p. 347–362.
- Discover – HELP. [cited 6 Dec 2020]. Available from: https://sawtoothsoftware.com/help/discover/manual/index.html?market-simulation-methods.html.
- Chen S. Who’s afraid of a transit desert? The New York Times. 11 Oct 2019. Available from: https://www.nytimes.com/2019/10/11/realestate/whos-afraid-of-a-transit-desert.html.
- Cook PA, Downing J, Wheater CP, et al. Influence of socio-demographic factors on distances travelled to access HIV services: enhanced surveillance of HIV patients in North West England. BMC Public Health. 2009;9(1):78.
- Terzian AS, Younes N, Greenberg AE, et al. Identifying spatial variation along the HIV care continuum: the role of distance to care on retention and viral suppression. AIDS Behav. 2018;22(9):3009–3023.
- Altice FL, Maru DS-R, Bruce RD, et al. Superiority of directly administered antiretroviral therapy over self-administered therapy among HIV-infected drug users: a prospective, randomized, controlled trial. Clin Infect Dis. 2007;45(6):770–778.
- Maina G, Mill J, Chaw-Kant J, et al. A systematic review of best practices in HIV care. J HIV AIDS Soc Serv. 2016;15(1):114–126.
- Kushel MB, Colfax G, Ragland K, et al. Case management is associated with improved antiretroviral adherence and CD4 + cell counts in homeless and marginally housed individuals with HIV infection. Clin Infect Dis. 2006;43(2):234–242.
- Aidala AA, Wilson MG, Shubert V, et al. Housing status, medical care, and health outcomes among people living with HIV/AIDS: a systematic review. Am J Public Health. 2016;106(1):e1–e23.
- Safreed-Harmon K, Anderson J, Azzopardi-Muscat N, et al. Reorienting health systems to care for people with HIV beyond viral suppression. Lancet HIV. 2019;6(12):e869–e877.