
 ?Mathematical formulae have been encoded as MathML and are displayed in this HTML version using MathJax in order to improve their display. Uncheck the box to turn MathJax off. This feature requires Javascript. Click on a formula to zoom.
ABSTRACT
We analyze in-plane and out-of-plane texture and terahertz analysis of a YBa2Cu3O7-δ (YBCO) film deposited by chemical solution deposition technique onto LaAlO3 (100) substrate. X-ray diffraction reveals the presence of (00l) reflections for the YBCO phase. The out-of-plane texture, measured by a rocking curve, shows two sub-layers with Δω = 0.45° and 1.8°. The value of the c-axis fraction of the crystallites is 81%. Also, the in-plane texture was studied by ϕ-scan measurements of the (102) reflection, displaying mostly a colony of c-axis oriented grains, and two colonies of a-axis oriented grains onto the YBCO surface. In addition, the temperature dependence of the magnetization measurement revealed a critical temperature of 90 K, typical for YBCO superconductor material. From the temperature-dependent optical conductivity of YBCO, we observe an absorption feature at ≈1.57 THz, which redshifts with increasing temperature.
Introduction
The growth of advanced material thin films has allowed the introduction of new concepts and potential applications. This fact has triggered a new focus on novel synthetic techniques and processing advances for their deposition. Therefore, the preparation of advanced materials such as complex metal oxides using novel synthetic routes [Citation1,Citation2] is a growing technological area. However, the properties and applications of advanced material thin films depend to a large extent on the stoichiometry and microstructure of the thin film. One of these novel synthetic techniques is chemical solution deposition (CSD); this technique is a wet-chemical process that is employed to fabricate a wide variety of amorphous and crystalline oxide thin films. The most prominent advantage of chemical solution deposition is the film composition; it can be tuned easily by adjusting the composition of the precursor solution [Citation3]. A large number of tailored thin films with specific properties can be prepared to lead to a diverse family of thin films for numerous applications. The versatility of this technique has already led to the achievement of high-quality thin films with various properties: ferroelectrics [Citation4,Citation5], piezoelectrics [Citation6,Citation7], mixed composition dielectrics [Citation8,Citation9], and superconductors (REBaCuO, where RE: rare earth) [Citation10,Citation11].
Chemical solution deposition technologies for the growth of complex REBaCuO materials like YBa2Cu3O7 (YBCO) thin films have gained considerable interest since this technique is low-cost, reproducible, and allows large-area coating [Citation12]. This technique typically obtains granular YBCO films, and by careful adjustment of the preparation procedure, compact films can be also achieved [Citation12]. Many reports focus on the initial reactants [Citation13], preparation procedure [Citation14], and substrates [Citation15]. Paramount attention must be paid to the resulting texture of the YBCO films obtained by CSD in order to be used in advanced technological devices. This is important since textured YBCO films are very anisotropic so they must have a high degree of both, out-of-plane and in-plane, textures to obtain well-ordered CuO2 superconducting planes; and thus, to achieve high critical current densities values [Citation16].
Quantification of the texture degree in YBCO films is commonly performed by X-ray diffraction (XRD), polarized Raman spectroscopy, optical techniques, transmission electron microscopy (TEM) and scanning electron microscopy (SEM). In the case of XRD, the texture can be studied through θ-2θ-, ω- and ϕ-scans. Rocking curve (ω-scan) is an advantageous way to study the out-of-plane texture; meanwhile, the in-plane texture can be analyzed by measuring the pole figures or by ϕ-scans. A pole figure shows the statistical distribution of a family of selected atomic planes concerning the normal of the substrate. A radial cut of few degrees through one of the pole figures peaks, for a constant ϕ, would provide the information equivalent to a rocking curve. The ϕ-scan checks the in-plane alignment of the YBCO grains.
On the other hand, in contrast to the Nb-based superconductors, the fundamental physical properties of YBCO films have been relatively unexplored at the THz frequency (meV energy) scale. This is particularly important since the superconducting energy gap exists on the order of ∼meV providing a testbed for any strong coupling effects. In addition, the existence of pseudogap in high-critical current (TC) superconductors [Citation17], makes it challenging to investigate gap energy scales, and a probe in the meV or THz range is urgently needed.
Recently, we have reported the deposition of compact YBCO films on different substrates [Citation15,Citation18,Citation19] by the CSD technique. In this work, we quantify the in-plane and out-of-plane texture of a YBCO film by XRD and estimate its TC from its magnetic properties. We also investigate the picosecond resolved THz response of the YBCO film at various temperatures across the superconducting states. We further obtain a.c. optical conductivity in the range 0.1–1.9 THz to elucidate the nature of the superconducting gap at the meV energy scale.
Experimental
The superconducting YBCO film was prepared onto LaAlO3 (100) substrate by the CSD method. Stoichiometric amounts of yttrium, barium and copper acetates (Y(OOCCH3)3.4H2O, Ba(OOCCH3)2 and Cu(OOCCH3)2.2H2O respectively) were mixed and completely dissolved in a solution of ethanol (C2H5OH) and oxalic acid (H2C2O4) (1:1 ratio). The system was left to decant for around 12 h. The matrix was then dispersed and magnetically stirred at 250 rpm to achieve a homogeneous metathesis reaction between the acetate solution and the oxalic acid. The resulting precursor solution was a colloid based on Y, Ba and Cu oxalates. Single drops of this precursor were carefully dripped on the LaAlO3(100) substrate with the help of a Fisher pipette. The sample was immediately dried in an oven at 40°C. The last steps were repeated 7 times.
A first thermal treatment at 880°C was made in air atmosphere for 12 h, followed by a second thermal treatment at the same temperature and time in an O2 atmosphere, following the same procedure reported in our previous works [Citation15,Citation18,Citation19]. These two thermal treatments were performed in order to obtain the crystallization and optimal oxygenation of the sample, respectively.
The morphology of the sample was inspected through a scanning electron microscope (SEM, Philips XL30) attached with an electron dispersive X-ray spectrometer (EDX, Oxford inc.).
The X-ray diffraction (XRD) measurements were performed in two X-ray diffractometers. The first one was a powder universal diffractometer Bruker D8 with Cu Kα1 radiation (λ = 1.54056 Å) meanwhile the second one was a Panalitycal X'Pert Pro MPD diffractometer with Cu-Kα, with a monochromator and equipped with an Eulerian cradle. Rocking curve measurements were performed around the (005) reflection (2θ = 38.72°) with a 0.02° step and an accumulation time of 6 s/step by using the first X-ray diffractometer. The ϕ-scan measurement was performed on the (102) reflection by using fixed angles ω0 = 13.94° and 2θBragg (102) = 27.88° by employing the second X-ray diffractometer. The sample holder was rotated to two χ angles, first χc = 56.80°, and later χa = 33.20° in order to quantify the fraction of c-axis and a-axis YBCO grains, respectively. Finally, the specimen holder moves to scan an angle ϕ from 0° to 360°.
The superconductivity state was demonstrated by measuring the temperature dependence of the magnetization in a direct current magnetic properties measurement system magnetometer (DC-MPMS-SQUID) from Quantum Design Inc. The magnetic data were collected in zero-field cooling (ZFC) and field cooling (FC) modes. Broadband terahertz time-domain spectroscopy of the YBCO/LaAlO3 film was performed with a Tera K15- T-Light Menlo system. The optical setup included a 30-mW pump laser with 90 fs output pulse at 1560 nm, split into two paths: (i) pump component focused down to a <50 μm spot onto the THz photoconductive emitter, resulting in a broadband THz emission, and (ii) probe component through the delay stage for coherent THz detection. The sample was mounted in the transmission geometry to obtain the THz response for each temperature. The sample is mounted on the cold finger of continuous-flow helium cryostat (Janis ST-300) with optical access reaching a base temperature of 4.3 K to obtain a temperature-dependent THz response.
Results and discussion
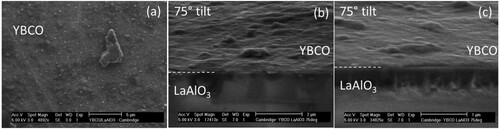
shows the surface morphology of the YBCO film grown on LaAlO3 substrate obtained by the chemical solution deposition technique. The micrography reveals a compact and dense film without cracks, no formation of aislate YBCO islands was observed or any evidence of substrate from the top-view direction. Despite the presence of some pores, a good coating of the film onto all the surface of the substrate is also observed. Pores and islands are typically formed during the growth of the superconducting grains to form polycrystalline YBCO films by this technique [Citation12,Citation15]. However, the scarce presence of pores in the surface confirms that the preparation procedure in the present work results in a compact and dense YBCO film with a thickness of approximately 400 nm.
Figure 1. Microscopy images of a YBCO film grown onto LaAlO3 substrate at different magnifications. (a) SEM micrographs took from the top view and tilted views ((b) and (c)).
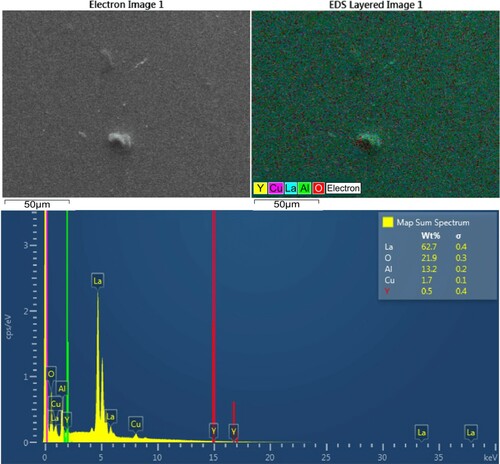
presents the EDX analysis for the YBCO/LaAlO3 film where it was able to identify the elemental composition of the film. The EDX scan was performed onto the whole area of the micrograph as observed in (a,b), respectively. (c) illustrates the EDX spectrum of the YBCO film, where La, Al, and O peaks are higher than the Cu and Y peaks. These strong element peaks correspond to the LaAlO3 single crystal substrate due to the thickness of 400 nm approximately. This fact reveals that EDX analysis was performed in all the bulk of the film reaching until substrate due to the strong signal of the elements of the substrate. The low presence of YBCO elements peaks is possibly due to the irregular region where the analysis was carried out or related to the low bulk volume of YBCO film associated with low thickness.
Figure 2. EDX analysis for the YBCO/LaAlO3 film. (a) Electron microscope micrograph, (b) EDS mapping and (c) EDS quantification. The spectrum shows the higher presence of La, Al, and O elements peaks corresponding to the substrate.
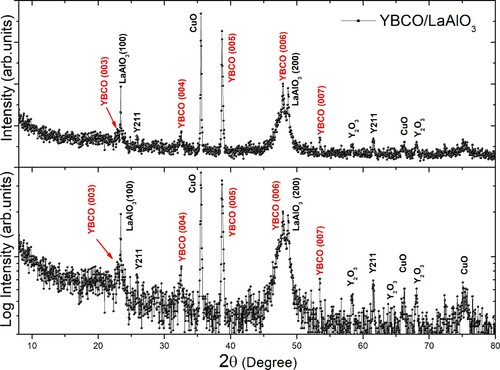
shows the X-ray diffractograms of the YBCO/LaAlO3 film. The presence of the peaks (003), (004), (005), (006), and (007) reveal epitaxial growth of YBCO grains in the c-direction with respect to the substrate surface, i.e. the c-axis of YBCO grains grown perpendicular to the substrate surface. The X-ray diffractograms also reveal the presence of the CuO phase (PDF card 89-2899 [Citation20]) at 35.52°, and Y2O3 phase (PDF card 65-3178 [Citation20]) at 58.32° and 68.08° due to possible inhomogeneities in the starting precursor solution. Moreover, the Y2BaCuO5 phase (Y211, PDF card 78-1719 [Citation20]) is also detected as a secondary phase by its reflections around 25.92° and 61.52°. We are able to obtain the percentage of c-axis YBCO grains grown with its c-axis perpendicular to the substrate surface from X-rays diffractograms. This fact was possible by using the (005) and (002) reflections, the first one is related to c-axis YBCO grains meanwhile the second one is assigned to a-axis YBCO grains, respectively. Therefore, in order to quantify the out-of-plane texture, i.e. the quantity of c-axis oriented grains grown with its c-axis normal to the substrate surface (fc), the following equation was used [Citation21]:
where Istand is the standard intensity obtained for randomly oriented samples (PDF card 40-159 [Citation20]). This equation provides a first estimation of the out-of-plane texture comparing the percentage of c-axis grains provided by (00l) reflection with reference to a-axis grains supplied by (h00) reflection in the film. (005) profile was selected because it has no interference from any other reflection such as substrate profile, and (200) reflection represents the presence of a-axis grains in the YBCO film. In our case fc = 0.81. Thus, 81% of the YBCO grains grew with their c-axis perpendicular to the substrate surface while 19% of the YBCO grains grew with their a-axis perpendicular to the substrate surface. A good matching between YBCO and LaAlO3 cell parameters exists because the lattice constant of the substrate (
nm) is quite similar to that for YBCO orthorhombic (
nm). Therefore, LaAlO3 single crystal is acting as a template for the epitaxial growth of YBCO grains.
Figure 3. XRD pattern of the YBCO film grown on LaAlO3 substrate. Top: The normal intensity axis is in arbitrary units, and Bottom: XRD in semi-logarithmical scale. The presence of the (00l) reflections corresponding to YBCO indicates that the crystallite grew in the c-direction. Small reflections corresponding to the phases CuO, Y2O3 (unreacted), and Y2BaCuO5 (secondary) were also detected in addition to the YBCO phase.
The rocking curve (RC) or omega-scan can provide a better analysis of the out-of-plane texture (see (a)). This measurement is a very useful way to study the perfection of epitaxy in the film when the {00l} planes are not parallel or the degree of tilt of the axis of YBCO grain with respect to the substrate surface. A very epitaxial film will produce a very sharp peak °. RC has been performed in the (005) reflection (see (b)) since its intensity is higher than the other (00l) reflections, and its position in the X-ray diffractogram (around 2θ = 38.72°) is far away from any other reflection from the LaAlO3 substrate. In the present work, the RC has been deconvoluted by two Gaussian functions. The Δω values can be estimated from the full width half maximum (FWHM) of the Gaussian functions, and they represent the degree of inclination of the c-axis oriented YBCO crystallites with respect to the normal to the substrate surface. The two obtained values, Δω = 0.80°, and 1.90° indicate that the YBCO film consists of two regions with different out-of-plane textures [Citation22]. Since film texture is strongly influenced by the substrate because it is a template, the low Δω value can be related to the texture of YBCO crystallites close to the interface, and it can be called cube-on-cube epitaxy. Whereas, the high Δω value represents the out-of-plane texture of the YBCO crystallites far away to the substrate surface and they have a major tilt than the c-axis grains close to the interface. This fact can be described in the following manner: In the first stage of the growing of YBCO grains close to the interface (during the final heat treatment), YBCO grains receive the epitaxy coming from the LaAlO3 single crystal; this epitaxy value is increasing as the growing front continues from the bottom to the top of the film. The increase of tilt value in c-axis YBCO grains is normally observed in films with thickness greater than 500 nm so it was to be expected that this situation would happen.
Figure 4. (a) Draw of Eulerian cradle to tilt the sample taken into consideration during measuring the crystallographic texture. (b) Rocking curve corresponding to the (005) reflection. And ϕ-scan spectra of one colony of crystallites oriented along the c-axis (c), and two colonies of crystallites oriented along the a-axis (d).
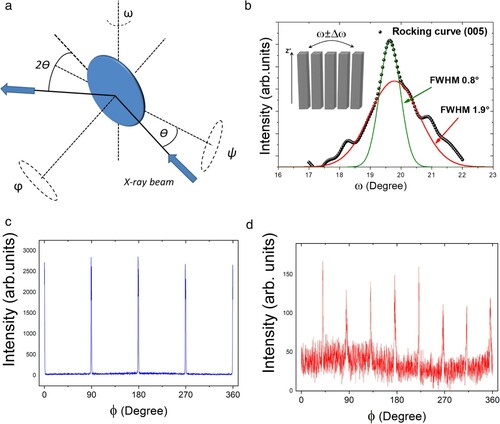
(c,d) presents ϕ-scans of the YBCO/LaAlO3 in the [102] direction. (c) has χc = 56.80° meanwhile (d) has χa = 33.20°. Both configurations helped to characterize the dispersion of the c-axis and a-axis YBCO grains regarding the in-plane texture of the film to determine how well aligned the YBCO grains are with respect to the plane of the substrate. Also, shows YBCO (00l) and (h00) profiles, which are directly related to the presence of YBCO crystallites oriented with their c-axis and a-axis perpendicular to the substrate, respectively. For this reason, two ϕ-scans were recorded in order to quantify the in-plane texture degree of the YBCO film. On one hand, (c) (χc = 56.80°) exhibits a single colony of c-axis oriented YBCO crystallites, with FWHM equal to Δϕc = 1.40°. Also, (c) gives information about the c-axis oriented YBCO crystallites that have their a- and b-axis parallel to the a- and b-axis of the LaAlO3 substrate because each profile is located at 0°, 90°, 180°, 270°, and 360°. On the other hand, as a consequence of the (200) diffraction profile present in , the peaks observed in (d) (χa = 33.20°) correspond to the presence of the two colonies of a-axis oriented YBCO crystallites, with FWHM equal to Δϕa = 7.1°. Moreover, this pair of a-axis oriented YBCO colonies forms an angle of 45° with respect to the other. This situation can be explained by the following manner: a-axis oriented YBCO crystallites can match its c-axis and b-axis with three and one LaAlO3 unit cells, respectively (low interfacial tension). Another possibility permitted by epitaxial considerations is that c-axis of a-axis oriented YBCO crystallites can match with the diagonal of two LaAlO3 unit cells (high interfacial tension), meanwhile b-axis can match with the diagonal of one LaAlO3 unit cell (high interfacial tension). The growth velocity of a-axis oriented YBCO crystallites is greater than the growth velocity of c-axis oriented YBCO crystallites. Therefore, it is possible to compare the X-ray intensity of each colony with respect to the sum of both colonies. In order to quantify the in-plane texture, we use the following equations:
(2)
(2)
(3)
(3) where Fc is the in-plane texture of c-axis oriented crystallites, Fa is the in-plane texture of a-axis oriented crystallites, Iφc is the integrated intensity of the colony of c-axis oriented crystallites, and Iφa is the integrated intensity of the colony of a-axis oriented crystallites. From integration of diffraction profiles in (c,d), values of Fc = 0.92, and Fa = 0.08 for in-plane texture were obtained. Therefore, the film presents an out-of-plane texture value of fc = 0.81; and from this quantity of c-axis oriented grains in the film, the value of in-plane texture is Fc = 0.92. Both models, in-plane and out-of-plane texture, can be understood in terms of the order and disorder of the YBCO grains. It is not enough for the c-axis grains to grow perpendicular to the substrate surface to have high values of Jc > 1 MA/cm2, it must have a well-ordered a- or b-axis of the YBCO grains in-plane. In order to take into account, the disorder fraction into in-plane texture, a pole figure must be taken because Equations (2) and (3) are only dealing with the ordered fraction.
The term superconductivity refers to the loss of resistivity below a critical temperature (TC) which is characteristic of a superconductor material. However, the superconductivity property of a material can be also studied from its magnetic properties. To name, typical REBCO superconductors behave as antiferromagnetic above TC and diamagnetic (Meissner effect) below it. shows the temperature dependence of the magnetization of the sample. The plot shows the measurements obtained in ZFC (magnetic shielding measurement) and FC (Meissner effect measurement) modes and under an external magnetic field of 100 mT applied perpendicular to the plane of the substrate. The superconducting behavior of the film is demonstrated by the diamagnetic signals below the onset transition temperature TC(onset) = 90 K in the two measurement modes, thus confirming the formation of the YBCO superconductor [Citation16]. The TC(onset) could be better estimated by taking the first derivate of the loops, as is observed in the inset plot.
Figure 5. Magnetic moment vs. temperature measurement of the YBCO film grown by the CSD technique. Inset: First derivate ZFC and FC curves.
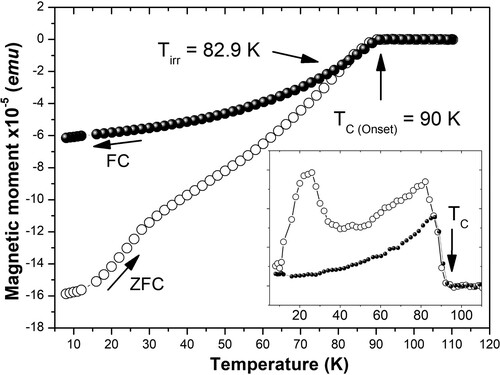
In addition, the irreversibility temperature Tirr = 82.9 K was estimated from the point at which the ZFC and FC loops diverge. It has been reported that Tirr usually varies with the applied magnetic field and forms the so-called irreversibility line in a corresponding magnetic phase diagram [Citation16]. Tirr acts as a boundary phase, dividing the vortex phase into two regions: a first region where exist a flow of bulk supercurrents by vortex pinning (irreversible magnetic behavior) and a second region where no bulk supercurrents can flow (reversible magnetic behavior). The irreversibility line is an important property that sets the limits on the range where the YBCO superconductor can be used in technical applications.
Note that in the figure, the curves show an up-turn in the diamagnetic signal at low temperature, which can be attributed to other phases that are present in the sample. This is better appreciated in the inset plot, in which the diamagnetic behavior of the YBCO superconductor at low temperatures is screened by the paramagnetic response of the impurity phases.
In order to characterize the gap and elucidate the superconducting behavior of the YBCO, we performed broadband terahertz (THz) time-domain spectroscopy on the YBCO/LaAlO3, by measuring the THz transmittance as a function of temperature. The THz setup was configured in transmission geometry to obtain temperature-dependent THz response of the superconducting film, providing a non-contact bulk probe to measure A.C optical conductivity as a function of temperature. (a) shows the time-dependent THz field transmitted through the YBCO thin films at various temperatures measured in a continuous flow L-He cryostat with optical access. The amplitude and the phase of the THz pulse waveform show significant change over the superconducting transition, which reflects the underlying changes in the optical conductivity spectra of YBCO. Below TC = 90 K, the THz transmitted field increases with a decrease in sample temperature, indicating a reduced free-carrier absorption. To probe this further, we calculated the THz conductivity spectra from Tinkham’s theory [Citation23] using the Fourier transform of the primary transmitted pulse from the YBCO films, normalized to the substrate signal at the same temperature.
Figure 6. Terahertz measurements of YBCO granular film deposited onto LaAlO3 substrates by the CSD method. (a) Time-domain picosecond (ps) pulse response transmitted through YBCO film for different sample temperatures. All the measurements were performed in a nitrogen purged environment to eradicate any features from water absorption. (b) THz conductance spectra obtained from normalized transmittance amplitude spectra concerning reference substrate.
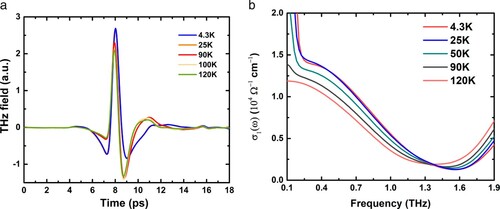
(b) shows the temperature-dependent real part of the optical conductivity of YBCO in the THz range. As the temperature decreases below TC, an absorption feature develops at around 1.57 THz at the lowest measurable temperature 4.3 K, and redshifts with increasing temperature. The minimum feature could be associated with the opening up of superconducting gap [Citation24]. Furthermore, within the low frequencies range of our measurements (<0.4 THz), the spectra show a metallic behavior described by the Drude model with large scattering lifetimes for temperatures below Tc. As the temperature is raised, the low-frequency conductance response flattens out, potentially indicating an increased scattering. For low-temperature superconductors, the superconducting gap, Δ plays a crucial role in characterizing the superconductor and its properties. The ratio (2Δ(T)/kTC) is ≈ 3.5 for low-temperature superconductors [Citation25], from the BCS theory. Deviations from the value have been attributed to strong coupling effects [Citation26], while the precise nature of the gap is not well known. From the BCS theory and Mattis-Bardeen formulae, the frequency signature in the THz spectra at 1.57 THz (at 4.3 K) would correspond to 2Δ(T) value, resulting in 6.4 meV. The gap feature value is rather smaller and could potentially be affected by macroscopic orientation or faceting details of the sample. However, a more detailed investigation, such as THz measurements in the presence of a magnetic field, is necessary to underpin the exact nature and value of the gap.
Conclusions
The in-plane and out-of-plane texture of the YBCO film grown by the CSD technique onto LaAlO3 substrate was studied. The scanning electron micrographs and XRD analysis demonstrate the growth of compacted granular YBCO film on the substrate mainly containing c-axis oriented crystallites (with a c-axis oriented fraction was 0.81). A Rocking curve taken over the (005) reflection was fitted with more than one Gaussian profile, meaning that the film consists of multilayers tilted with the c-axis. The in-plane texture analysis revealed one colony of c-axis oriented grains with a fraction value of 0.92, meanwhile, two colonies of a-axis oriented grains were observed with a fraction value of 0.08. The sample becomes a superconductor below the critical temperature of 90 K and the impurity phases paramagnetic contribution is observed from the diamagnetic signals up-turn in lower temperatures. THz spectroscopy reveals that the absorption feature develops at 1.57 THz at 4.3 K, corresponding to 2Δ(T) value 6.4 meV which redshifts with increasing temperature. The overall results indicate that it is possible to obtain textured YBCO films onto LaAlO3 substrates by the CSD technique.
Disclosure statement
No potential conflict of interest was reported by the author(s).
Additional information
Funding
References
- Koster G, Huijben M, Rijnders G, editors. Epitaxial growth of complex metal oxides. Cambridge, UK.: Woodhead Publishing; 2015.
- Vogt T, Buttrey DJ, editors. Complex oxides: an introduction. New Jersey, USA: World Scientific Publishing Co. Pte. Ltd; 2019.
- Schwartz RW. Chemical solution deposition of perovskite thin films. Chem Mater. 1997;9:2325–2340.
- Schneller T, Waser R. Chemical solution deposition of ferroelectric thin films – state of the art and recent trends. Ferroelectrics. 2002;267:293–301.
- Van Bael MK, Nelis D, Hardy A, et al. Aqueous chemical solution deposition of ferroelectric thin films. Integr Ferroelectr: Int J. 2002;45:113–122.
- Yeo HG, Trolier-McKinstry S. {001} oriented piezoelectric films prepared by chemical solution deposition on Ni foils. J Appl Phys. 2014;116:014105.
- Kosec M, Mandeljc BMM. Chemical solution deposition of PZT thin films for microelectronics. Mater Sci Semicond Process. 2002;5:97–103.
- Pham K-N, Gaukas NH, Morozov M, et al. Epitaxial K0.5Na0.5NbO3 thin films by aqueous chemical solution deposition. R Soc Open Sci. 2019;6:180989.
- Saji VS, Choe HC. Chemical solution deposition of CaCu3Ti4O12 thin film. Bull Mater Sci. 2010;33:203–207.
- Obradors X, Puig T, Pomar A, et al. Chemical solution deposition: a path towards low cost coated conductors. Supercond Sci Technol. 2004;17:1055–1064.
- Pinto V, Vannozzi A, Armenio AA, et al. Chemical solution deposition of YBCO films with Gd excess. Coatings. 2020;10:860.
- Moriya K, Igarashi K, Watanabe H, et al. Growth of YBa2Cu3O7 superconductor thin films using ethanolamine-based solutions via simple spin coating. Results Phys. 2018;11:364–367.
- Li M, Cayado P, Erbe M, et al. Rapid pyrolysis of SmBa2Cu3O7-δ films in CSD-MOD using extremely-Low-fluorine solutions. Coating. 2020;10:31.
- Pop C, Villarejo C, Pino F, et al. Growth of all-chemical high critical current YBa2Cu3O7-δ thick films and coated conductors. Supercond Sci Technol. 2018;32:015004.
- De Los Santos Valladares L, González JC, Bustamante Domínguez A, et al. Superconductors. In: A Gabovich, editor. Rijeka: Intech Open; 2015. p. 35–53.
- Sanchez Cornejo H, De Los Santos Valladares L, Barnes CHW, et al. Texture and magnetic anisotropy of YBa2Cu3O7-x film on MgO substrate. J Mater Sci: Mater Electron. 2020;31:21108–21117.
- Alloul H, Ohno T, Mendels P.. 89Y NMR evidence for a fermi-liquid behavior in YBa2Cu3O6+x. Phys Rev Lett. 1989;63:1700.
- Bustamante Domínguez A, Osorio AM, De Los Santos Valladares L, et al. Advances in Science and technology. Adv Sci Technol. 2006;47:37–42.
- Bustamante Domínguez A, León Félix L, Garcia J, et al. Epitaxial growth of YBa2Cu3O7 films onto LaAlO3 (100) by using oxalates. Phys Procedia. 2012;36:526–531.
- Powder diffraction file PCPDFWIN, Version 2.1. JCPDS, The international Centre for Diffraction Data; 2000.
- Puig T, Puig-Molina A, Mestres N, et al.. Texture analysis of coated conductors by Micro-Raman and synchrotron x-ray diffraction. Mat Res Soc Symp. 2001;659.
- Zanetti SM, Leite ER, Longo E, et al. Preparation of ferroelectric bi-layered thin films using the modified polymeric precursor method. Mater Res. 2001;4(3):157–162.
- Ikebe Y, Shimano R, Ikeda M, et al.. Vortex dynamics in a NbN film studied by terahertz spectroscopy. Phys Rev B. 2009;79:74525.
- Hong T, Choi K, Ik Sim K, et al. Terahertz electrodynamics and superconducting energy gap of NbTiN. J Appl Phys. 2013;114:243905.
- Clayman BP, Frindt RF. The superconducting energy gap of NbSe2. Solid State Commun. 1971;9:1881–1884.
- McMillan WL, Rowell JM. In superconductivity. In: RD Parks, editor. Superconductivity. New York: Marshall-Dekkar; 1969. p. 561.