
 ?Mathematical formulae have been encoded as MathML and are displayed in this HTML version using MathJax in order to improve their display. Uncheck the box to turn MathJax off. This feature requires Javascript. Click on a formula to zoom.
ABSTRACT
A novel Ti–2Al–1.3V (wt.%) alloy was prepared by thermomechanical consolidation of a composite powder produced by high-energy ball milling of a mixture of TiH2 granules with a low oxygen content (0.1wt.%) and Ti–6Al–4V machining chips with a high oxygen content (0.8wt.%) at a mass ratio of 2:1. The microstructures and mechanical properties of the alloy in as-extruded state and after different heat treatments were investigated. The as-extruded alloy exhibits a martensite microstructure consisting of ultrafine and nanometer sized α’ laths and aciculae and domains of layered structure containing δ(TiH) layers. The alloy in this state is brittle and fractures prematurely before yielding due to the ultrafine martensitic microstructure and hydrogen embrittlement associated with the high hydrogen content of the alloy. After vacuum annealing at 700°C for 6 h followed by furnace cooling, the alloy is further dehydrogenated with the hydrogen content being reduced to 0.008wt.%, the microstructure of the alloy changes into a full α/β lamellar microstructure with the continuous and discontinuous β layers being only 80–90 nm thick and the lamellar colony sizes being 10–30μm. The fine structured alloy in this heat treatment condition shows an excellent combination of high tensile yield strength of 996 MPa and ductility of 13.9%. After a further heat treatment of 980°C for 1 h followed by air cooling, the microstructure of the alloy consists of equiaxed α grains and α/βt lamellar structured domains (βt = β transformed structure), and unfortunately, this microstructure leads to a significant decrease of both the tensile yield strength (to 876 MPa) and the tensile ductility (to 7.4%). The fracture behavior of the alloy in different states is also studied, and the correlation between the microstructure and mechanical properties is discussed.
Introduction
Titanium and titanium alloys are widely used in aerospace, petrochemical, and biomedical fields because of their low density, high specific strength, low thermal conductivity, paramagnetic properties, good heat resistance, good toughness at cryogenic temperatures, high corrosion resistance and biocompatibility [Citation1–4]. However, the currently popular titanium alloy ingot metallurgy (IM) method is a multi-step, high energy consumption, and costly processing method, which severely limits the commercial applications of titanium alloys. Therefore, the development of new processes and new technologies to reduce energy consumption and production costs has become one of the hotspots of titanium alloy research. Powder metallurgy (PM) technology is considered to be the most feasible method for producing titanium alloy components [Citation5–7], and is widely respected for its near-net-shape capability and a small amount of processing. It is well known that oxygen is the central problem in the manufacture of titanium and titanium alloys. The strong and short-range repulsion between interstitial oxygen and screw dislocation core enhances the strength of titanium but reduces the tensile ductility and toughness of titanium and high oxygen content is easy to cause brittle fracture. It has been reported that the elongation of pure titanium is only 2% when the oxygen content reaches 0.85wt.% [Citation8]. In Ti–7.5Mo alloy, the elongation to fracture decreases from 28% to 6% as the oxygen content increases from 0.2 to 0.5wt.% [Citation9]. Similarly, according to the literature reports, in order to maintain a ≥6% elongation to fracture, the upper limit of the oxygen content of a Ti–6Al–4V (wt.%) alloy is 0.6 wt.% [Citation10]. Meanwhile, in conventional casting and metal injection molding processes, increasing the oxygen content causes a sharp decrease in plasticity due to the non-uniform distribution of oxygen solid solution atoms and the aggregation of oxygen at the coarse grain boundaries during solidification, leading to embrittlement of the Ti matrix [Citation11]. PM Ti alloys with a high oxygen content obtained by thermomechanical processing are composed of fine equiaxed α-Ti grains with uniform distribution of oxygen solute atoms, and exhibit a good combination of tensile strength and elongation at room temperature [Citation12]. Luo et al. [Citation13] prepared a nano-heterostructured high-oxygen Ti–6Al–4V alloy by powder metallurgy process. By refining the microstructure, the high-oxygen Ti–6Al–4V alloy can also maintain good mechanical properties. Recent research results show that high-oxygen Ti can be prepared by mixing Ti and TiO2 through high-energy ball milling and selective laser melting, breaking through the trade-off between the tensile strength and ductility of Ti [Citation14].
In this study, low oxygen TiH2 granules and high oxygen Ti–6Al–4V machining chips were mixed with a mass ratio of 2:1, and then processed by high-energy ball milling to produce a composite powder with a nominal composition of Ti–2Al–1.3V. The milled powder was thermomechanically consolidated using hot extrusion process. It was found that in an optimum heat treatment condition, the titanium alloy with a low alloying element content showed an excellent combination of high tensile strength of 1059 MPa and good ductility of 13.9%. Through this study, we achieved the goal of fabricating a high performance and low cost titanium alloy by solid state recycling of titanium alloy chips with a high oxygen content.
Experimental procedure
The raw materials used are TiH2 granules and high-oxygen content Ti–6Al–4V machining chips (both from Shenyang Jinda Titanium Industry Co., Ltd.). lists the H, O and N contents of the TiH2 granules and Ti–6Al–4V machining chips. TiH2 granules and Ti–6Al–4V machining chips were mixed a mass ratio of 2:1, and then placed inside a ball milling vial together with milling balls. The ball-to-powder mass ratio is 5:1, The vial was sealed in a glovebox filled with argon with an oxygen content of less than 0.1 ppm. The ball milling of the material in the sealed vial was performed for 6 h with a planetary ball mill rotated at a speed of 500 rpm. The ball-milled powder was uniaxially die pressed using a 200-ton hydraulic press (a pressure of 750 MPa) to obtain a cylindrical powder compact with a diameter of 52 mm, a height of 55 mm, and a relative density of 86%. In a protective atmosphere filled with argon, the powder compact was rapidly induction heated to 1000°C at a rate of 80°C/min, and then induction heated to 1200°C at a rate of 20°C/min, and held at the temperature for 5 min. Subsequently, the powder compact was transferred to a preheated H13 steel (400°C) extrusion die and extruded with an extrusion ratio of 16:1 to produce a cylindrical rod with a diameter of 14 mm. The relative density of the rod was measured by Archimedes drainage method to be 99.95%. The as-extruded rod is named as TMC sample. A portion of the as-extruded rod was annealed in a vacuum furnace at 700°C for 6 h and then furnace cooled to room temperature. The vacuum annealing completes the dehydrogenation, and causes microstructure changes of the as-extruded rod. This sample is called 700-FC sample. In addition, part of the vacuum-annealed rod was heat treated at 980°C for 1 h and the air cooled. This sample is called a 980-AC sample. shows a schematic diagram illustrating the thermal history of the titanium alloy in different conditions.
Figure 1. Schematic diagram showing the thermal history of the PM Ti–2Al–1.3V alloy fabricated by thermomechanical consolidation and heat treatments.
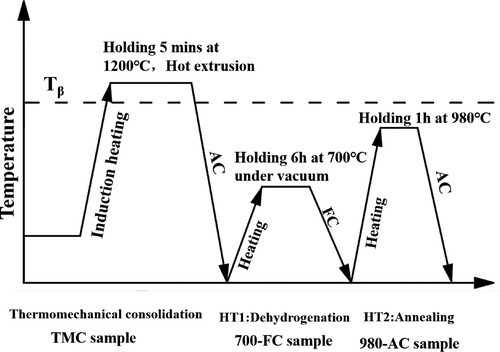
Table 1. H, O and N contents (wt.%) of TiH2 granules and Ti–6Al–4V machining chips.
The β transus temperature of the TMC sample was calculated by JmatPro software and determined by metallographic method to be 1030°C. The H, O and N contents of the samples were determined by gas chromatography. The phase structures of the samples were characterized by X-ray diffraction (XRD, model SmartLab, Rigaku) with a scanning angle of 30-90° and a scanning speed of 5°/min. Electrolytic polishing was performed for 90–120 s using a 6% perchloric acid + 34% n-butanol + 60% methanol solution at –5°C, a voltage of 22 V and a current of 0.7A. Observations of the microstructures were performed using an optical microscope (OM) (Zeiss Axio Lab. A1) and a field emission scanning electron microscope (SEM) (JMS-7001F) equipped with an electron backscatter (EBSD) detector. The grain sizes and lamellae thickness were measured by image analysis using Image Pro Plus software. Transmission electron microscopy (TEM)(JEM-2100F) was utilized to observe the microstructure. Circular disks with a thickness of approximately 60 μm and a diameter of 3 mm were prepared by mechanical polishing, and electrolytically polished using a double-jet electrolytic polishing machine operated at –25°C and 25 V and with a 6% perchloric acid + 34% n-butanol + 60% methanol solution. Tensile tests of the specimens from the samples were performed at room temperature using an AG/X Plus 100N electronic universal testing machine with an initial strain rate of 5 × 10⁻⁴s. The dog-bone shaped tensile test specimens with a rectangular cross sections of 10 × 3 mm2 and a gauge length of 2 mm were cut from the samples along the extrusion direction using an electrical discharge wire cutter. The strain distribution of the tensile test specimens within the gauge length during tensile testing was measured using a digital image correlation (DIC) equipment (VIC-3D). Three specimens of each sample were taken for testing and the average value was calculated.
Results
Microstructure
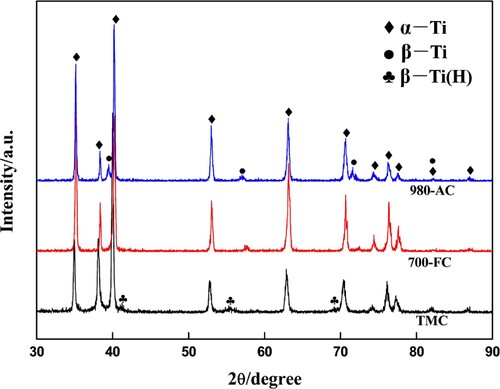
As shown by the XRD patterns in , the TMC sample is composed of mainly α’-Ti and a small amount of β-Ti(H), while the 700-FC and 980-AC samples are composed of mainly α-Ti phase and a small amount of β-Ti. Compared with the α’-Ti peaks of the TMC sample, the α-Ti peaks of the 700-FC samples shifted to slightly larger angles. The β-Ti(H) peaks also shifted to large angles due to the significant reduction of hydrogen content. Since hydrogen atoms are interstitial atoms, the lattice will contract after dehydrogenation, so the β-Ti peaks will be shifted to larger angles [Citation15]. The dehydrogenation process can be described as: β(H) → δ + α(H) → α + β + H2. On the other hand, the shift of α-Ti peak is due to the increase of Al content [Citation16], which is due to the fact that the radius of Al atoms is smaller than that of Ti atoms and the crystalline surface spacing decreases after the formation of replacement solid solution.
Figure 2. XRD patterns of the TCM, 700-FC and 980-AC samples.
shows the H, O and N contents of the TMC, 700-FC and 980-AC specimens. It can be seen from that the content of H in the TMC sample is significantly lower because of the in-situ dehydrogenation of the powder compact during induction heating. Compared with the TMC sample, the H content in the 700-FC sample was further reduced, and this is likely due to the decomposition of β(H) → δ + α(H) → α + β + H2 and the escape of hydrogen in the form H2 gas in a vaccum environment.
Table 2. H, O and N contents (wt.%) of the TMC, 700-FC and 980-AC samples.
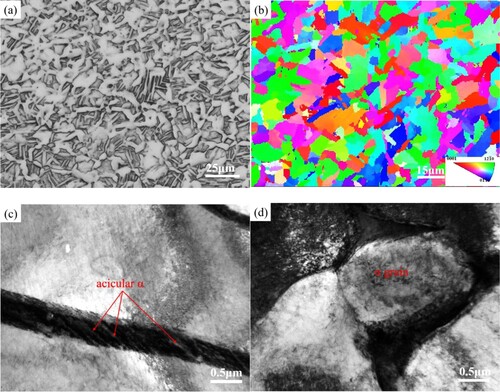
As shown in , the TMC sample exhibits a typical martensite microstructure composed of ultrathin α’ laths and aciculae and grain boundary α with an average prior β grain size of 15.5 μm. (b,c) shows that there are also layer structured domains containing nanometer sized δ-TiH needles in the microstructure. With the increase of hydrogen content, hydrogen penetrates into the β-phase first and precipitates at the interface of the two phases, as shown in (c). δ-TiH needles preferentially grow in β-Ti. In other words, hydrides originate at the interface of α-Ti and β-Ti phases and grow in β-Ti, which leads to hydride aggregation at the interface of α-Ti and β-Ti. show the microstructure of the 700-FC sample. As shown in (a), the 700-FC sample has a regular α/β lamellar microstructure with an average a lamella thickness of 0.9 μm and an average lamellar colony size of 15.4 μm. shows the microstructure of the 980-AC sample. As shown in (a,c,d), the microstructure of the 980-AC sample consists of equiaxed α grains and domains of a/βt lamellar structure (βt is the β transformed structure containing nanometer sized a aciculae within a matrix of β phase).
Figure 3. (a) SEM image and (b) and (c) TEM bright-field images showing the microstructure of the TMC sample.
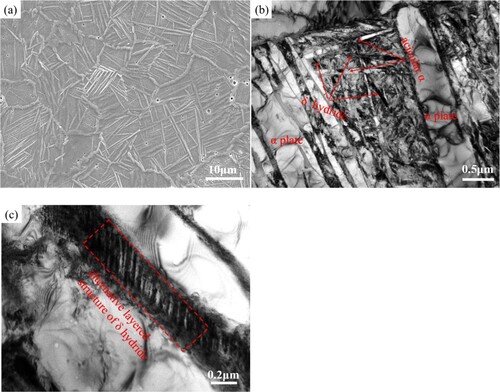
Figure 4. (a) and (b) SEM images, (c) EBSD IPF map and (d) TEM bright-field image showing the microstructure of the 700-FC sample.
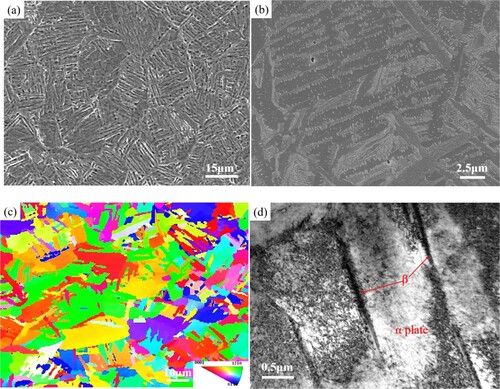
Figure 5. (a) OM image, (b) EBSD IPF map, (c) and (d) TEM bright-field images showing the microstructure of the 980-AC sample.
(c) and (b) show the EBSD inverse pole figure (IPF) contrast maps of the microstructures of the 700-FC and 980-AC samples respectively. It can be seen that the sizes and morphologies of the α grains in the two samples are significantly different. The volume fraction of the globular α grains is significantly higher in the 980-AC sample. For the 700-FC sample, the IPF map ((c)) shows that there are a large number of α lamellae, and the crystal orientations of adjacent α lamellae are different, verifying the formation of different α grains within a single prior β grain. Compared with the 700-FC sample, the α gains in the 980-AC sample are obviously globular, and only a small amount of α plates exist, indicating that the heat treatment temperature has a significant effect on the α phase morphology. At the same time, the color change of the α phase in each prior β grain is reduced, indicating that the α orientation variation that occurs in its formation from the β phase is reduced.
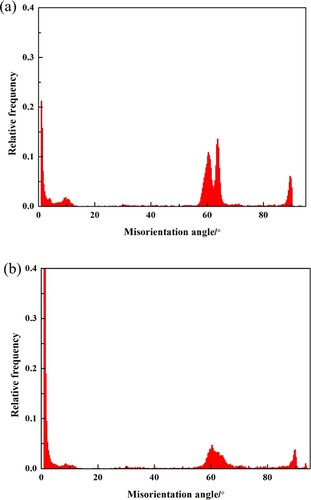
Theoretically, during the phase transition from β phase (bcc) to α phase (hcp), each prior β grain can produce 12 different α variants [Citation17]. By comparing all 12 variants, 11 misorientation angles/ axis can be calculated. Due to crystal symmetry [Citation17], some variants are identical, such as V1-V2 and V1-V3. Thus, the 12 variants can be reduced to 5 independent variants. In the 700-FC sample, the misorientation angle distribution of the α phase is shown in (a). It shows five peaks in the angle ranges 2°–5°, 8°–13°, 55°–70° (two peaks) and 85°–92°. The misorientation angle/axes corresponds to the theoretical value [Citation17]. The peaks of misorientation at 55°–70° include 60°/[1 1 –2 0], 60.83°/[–1.377 –1 2.377 0.359] and 63.26°/[–10 5 5 –3] misorientation angle/axis. The peaks corresponding to 8°–12° and 88°–92° belong to the misorientation angle of 10.53°/[0 0 0 1] and 90°/[1 –2.38 1.38 0], respectively. In addition, the peaks corresponding to the misorientation angle of 63.26°/[–10 5 5 –3] and 60°/[1 1 –2 0] are significantly higher than that of other intervariant boundaries, which is consistent with Hos-sein Beladi's findings are consistent[Citation18]. The lowest inter-variant orientation angle deviation is 10.53°/[0 0 0 1], which is formed by the intersection of two lamellae α of different crystal orientations[Citation18]. In contrast, the misorientation angle distribution of 980-AC ((b)) only shows three distinct peaks in the angular ranges 2°–13°, 55°–70° and 85°–92°. The proportion of small angle grain boundary increases obviously, the possible reason is that obvious variation selection occurs in the phase transition process.
Figure 6. Misorientation angle distribution of α grains in (a) 700-FC and (b) 980-AC samples.
Tensile properties and fracture behavior
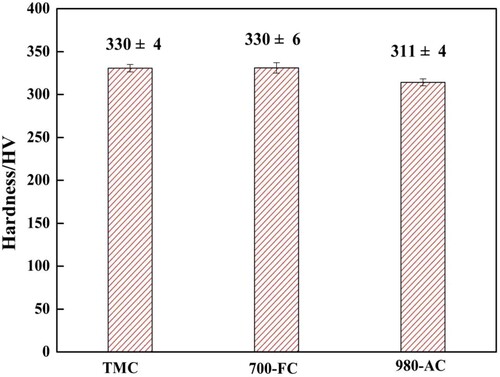
shows the Vickers hardness of samples under different heat treatments. It can be seen from that the Vickers hardness of the extruded sample TMC is basically the same as that after vacuum dehydrogenation at 700°C, both of which are 330HV, while the Vickers hardness of the 980-AC sample is reduced to 311HV. According to the Hall-Petch relationship [Citation19]. it can be seen that the lower hardness value of the 980-AC sample than that of 700-FC sample is mainly caused by the coarsening of the α plate. This is consistent with the previous analysis results.
Figure 7. Vickers hardness of the TMC, 700-FC and 980-AC samples.
The tensile engineering stress–strain curve of the TMC, 700-FC and 980-AC specimens are shown in . lists the values of the corresponding tensile properties. It can be seen that the TMC sample has a brittle fracture in the elastic stage before reaching the yield stage, and the sample has no plastic deformation ability. After 700°C vacuum dehydrogenation treatment, the 700-FC sample has a yield strength (YS) of 996 MPa, ultimate tensile strength (UTS) of 1059 MPa, and elongation to fracture of 13.9%, showing a good combination of tensile strength and plasticity. After heat treatment at 980, the YS and UTS of 980-AC specimen decreased significantly from 996 and 1059 MPa to 876 and 994 MPa, and the elongation to fracture decreased significantly from 13.9% to 7.4%.
Figure 8. Tensile engineering stress–strain curves of the TMC, 700-FC and 980-AC samples.
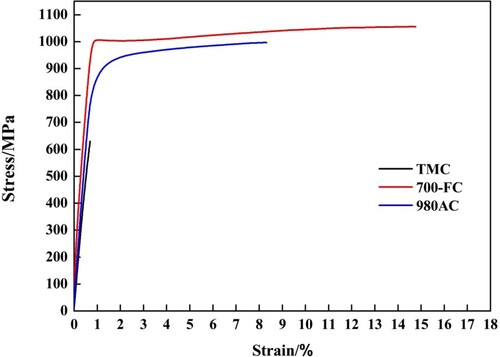
Table 3. Room temperature tensile properties of the PM Ti–2Al–1.3V alloy in different heat treatment conditions.
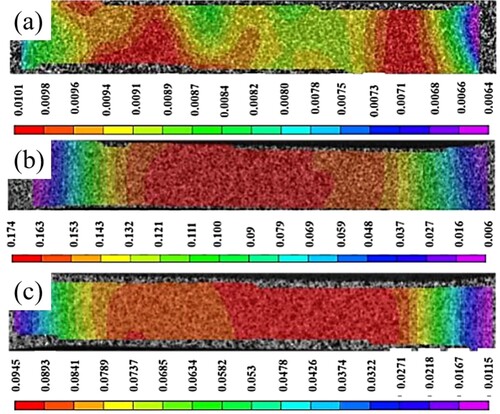
shows the DIC strain distribution before fracture for the TCM, 700-FC and 980-AC tensile specimens, respectively. It can be seen that the strain distributions of 700-FC and 980-AC specimens are relatively uniform before fracture occurs, indicating that 700-FC and 980-AC have a large uniform deformation capacity during deformation. It is also calculated that the ratios of maximum strain to minimum strain before fracture are 1.56, 29 and 8.2 for TMC, 700-FC and 980-AC tensile specimens respectively, implying that 700-FC has a significantly higher resistance to strain localization than TMC and 980-AC specimens.
Figure 9. DIC strain distribution maps of the tensile tested specimens deformed to different strains: (a) TMC at a strain of ∼0.69%, (b) 700-FC sample at a strain of ∼13.9% and (c) 980-AC sample at a strain of ∼7.4%.
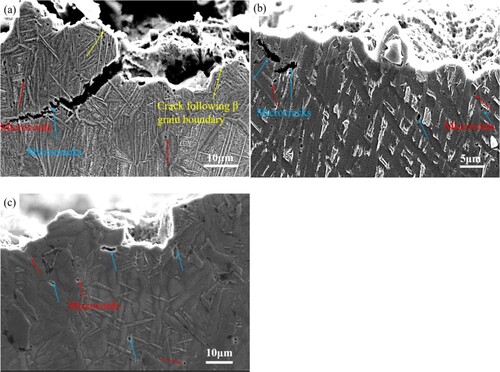
The fracture surface of the TMC specimen is shown in (a), and there are a large number of cleavage facets on the fracture surface, most of which are along the grain boundaries, and this is typical intergranular fracture. At the same time, it can be seen from (a) that there are a few microcracks in the longitudinal section near the fracture surface of the TMC tensile specimen, and the microcracks extend along the grain boundaries, accompanied by the transition from transgranular fracture to intergranular fracture. (b) shows the fracture surfaces of the 700-FC specimen with partial dimples and partial cleavage facets of α lamellar, which is a mixed fracture mode of ductile fracture and cleavage fracture. (b) shows the longitudinal section near the fracture surface of the 700-FC tensile specimen, there are a few microcracks and more microvoids, and these microcracks and microvoids are generated during the deformation process, and the microcracks do not extend along the α lamellae. (c) shows the fracture surface of the 980-AC tensile specimen. The majority of the fracture surface is the cleavage fracture of the α lamellae, and the smaller sized dimples are distributed in the cleavage facets of the α lamellae, which is a quasi-cleavage fracture. (c) shows that a small number of microcracks and micropores are generated in the 980-AC tensile specimen during deformation.
Figure 10. Fracture surfaces of the tensile tested specimens from (a) TMC, (b) 700-FC and (c) 980-AC samples.
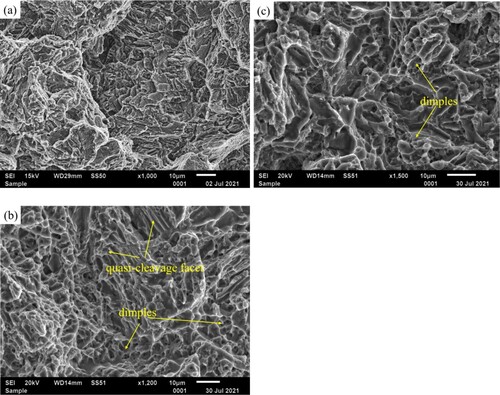
Figure 11. Longitudinal sections near the fracture surfaces of the tensile tested specimens from (a) TMC, (b) 700-FC and (c) 980-AC samples.
Discussion
Microstructural evolution during heat treatments
During vacuum annealing at 700°C, the metastable β(H) phase in the TMC sample shows a discontinuous distribution of β-phase through β(H) → δ + α(H) → α + β + H2 decomposition due to the low pressure of the hydrogen part around the sample. At the same time, due to the small cooling rate of furnace cooling, the α/β interface area is large and the α/β interface energy is high, and this interface can promote the growth of needle-like α in the β-transformed tissue, leading to the transformation of the β-transformed tissue to the β phase.
After solid solution in the biphasic region and air cooling, nano-needle α will be precipitated in the sub-stable β-phase due to suitable cooling, which will eventually exist in the β-phase in the form of needles and form the β-transition organization. Therefore, compared with the 700-FC specimen, the 980-AC specimen completes the transition from α/β lamellar organization to α/βt organization. Meanwhile, it is clear from (a,d) that part of the α lamellae become globular, which is due to the spheroidization of the α grains during annealing at 980°C to reduce the grain boundary and α/β interface energies [Citation20].
Correlation between the microstructures and tensile deformation behavior
It has been reported that continuous αGB adversely affects the tensile ductility of titanium alloys [Citation21,Citation22]. αGB layers provide a softer region, and the soft region yields first during deformation, which adversely affects the tensile ductility. During deformation, microcracks not only nucleate at grain boundaries [Citation23], but also nucleate along the α lamellae in the lamellar microstructure [Citation22]. The fracture surfaces of the TMC specimen is shown in (a), and there are a large number of cleavage facets on the fracture surface, most of which are along the grain boundaries, which is typical intergranular fracture. At the same time, it can be seen from (a) that there are a few microcracks in the longitudinal section near the fracture surface of the TMC tensile specimen, and the microcracks extend along the grain boundaries, accompanied by the transition from transgranular fracture to intergranular fracture. This is because of the high hydrogen content in the TMC specimen and a large amount of hydride aggregation at the grain boundaries, as well as the presence of a large amount of needle-like δ(H) in the β-phase. Hydrogen forms local atmosphere near grain boundary, which leads to local stress concentration and inhibits stress relaxation at grain boundary during deformation. Hydride acts as crack source and path of crack propagation, eventually leading to brittle fracture [Citation24].
(b) shows the fracture surfaces of the 700-FC specimen with partial dimples and partial cleavage facets of α lamellar, which is a mixed fracture mode of ductile fracture and cleavage fracture. (b) shows the longitudinal section near the fracture surface of the 700-FC tensile specimen, there are a few microcracks and more microvoids, and these microcracks and microvoids are generated during the deformation process. The propagation of microcracks is at an angle to the lamellar α phase. The higher fracture elongation may be related to the different misorientation of lamellar α variant. The more α variants in the prior β grain, the more interleaved structures are formed when α of different crystal orientations meet, such interleaved structures may hinder crack propagation. The fracture surface of the 980-AC specimen is somewhat similar to the fracture surface of the 700-FC specimen, as shown in (b,c). However, compared with the longitudinal section near the fracture surface of the 700-FC specimen, during deformation, the microcracks mainly propagate along the α/βinterface, as shown in (c), which may be related to the coarsening of the α phase.
The oxygen content of vacuum annealed sample is 0.36wt.% (equivalent to 1.0 at.%). The main strengthening mechanisms of vacuum annealed sample include Hall-Petch interface strengthening () and solid solution strengthening (
) with oxygen. To clarify the contribution of these two strengthening mechanisms, a quantitative analysis was performed, which defined as follows:
(1)
(1)
Based on the Labusch model [Citation25], the solid solution strengthening of oxygen is described as Equation (2), which is as follows:
(2)
(2) where
is the Schmid factor (0.34–0.38), G is the shear modulus (4.45 × 10 N/m2), b refers to Burger's vector (2.95 × 10⁻¹⁰m) and w (∼5b) is the width of the edge dislocation and Fm is maximum interaction force between an edge dislocation and solid solution atoms (O:5.38 × 10⁻¹⁰ [Citation14]). The estimated
of 700-FC sample is 458 MPa. In addition, it is known that high energy ball milling can refine grains. It was revealed that α grain size decreased from 300 um (CP–Ti, 0.038wt.% O, no high energy ball milling) to 0.9 um (Ti–2Al–1.3V, 0.36wt.%, high energy ball milling), which can contribute to the increase σy through the grain refinement strengthing. The effect can be described by the Hall-Petch equation [Citation26,Citation27]:
(3)
(3) where k is the grain boundary strengthening coefficient (15.7 MPa/mm2 [Citation28]) and d0 is the initial grain size (300μm), d is the refined grain size (0.9um), which were about 495 MPa. According to formula (1), the Δσy calculated value is 953 MPa, the theoretical value is lower than the actual measured value, which may be due to the neglect of solid solution strengthening of a small amount of solute atoms such as Al and V.
Compared with the 700-FC specimen, the yield strength, tensile strength and elongation to fracture of the 980-AC specimen were reduced because the heat treatment in the α+β two-phase region causes the α lamellae to become globular, and the microstructure of the 980-AC sample contained fewer α/β interfaces, resulting in lower α/β interface strengthening of the 980-AC specimen than the 700-FC specimen. In addition, compared with the 700-FC specimen, there is the precipitation of needle-like α phase in the β phase. During the tensile deformation, it is difficult for the dislocation motion to proceed freely due to the shortening of the average free distance of dislocation slip [Citation29]. The grains undergo obvious coarsening, and with the increase of deformation, a large number of dislocations will accumulate at the grain boundaries, and this local accumulation of dislocations will cause a large stress concentration along the grain boundaries, thus leading to early crack initiation and low plasticity.
Conclusions
A novel PM Ti–2Al–1.3V alloy was prepared from low-oxygen TiH2 particles and high-oxygen Ti–6Al–4V machining chips by a thermomechanical powder consolidation. Due to the high hydrogen content and ultrafine martensitic microstructure which has a low capacity for dislocation movement and accumulation, the alloy in the as-extruded state (TMC sample) is brittle and fractures prematurely during tensile testing.
Vacuum annealing of the alloy at 700°C causes the residual hydrogen content of the alloy to a very low level, the microstructure is changed to a full α/β lamellar microstructure with the continuous and discontinuous β layers being in nanometer scale in thickness. In this heat treatment state, the alloy exhibits an excellent combination of strength and tensile ductility with a yield strength of 996 MPa, tensile strength of 1059 MPa and an elongation to fracture of 13.9%. This is due to the interfacial strengthening and solid solution strengthening of oxygen and high resistance to the strain localization.
After further annealing at 980°C followed by air cooling, a large fraction of the α lamellae in the microstructure of the alloy become coarsened and globular, so the microstructure consists of globular α grains and α/βt lamellar domains. With such a microstructure, both the tensile strength and tensile ductility are reduced, which might be attributed to weaker interface strengthening and a lower tolerance of the coarsened α grains to strain localization.
This study shows that a novel Ti–2Al–1.3V alloy with a low alloying content and a highly desirable combination of strength and tensile ductility can be fabricated by a PM route.
Disclosure statement
No potential conflict of interest was reported by the author(s).
Additional information
Funding
References
- Zhu Y, Liu D, Wang X, et al. Polydopamine-mediated covalent functionalization of collagen on a titanium alloy to promote biocompatibility with soft tissues. J Mater Chem B. 2019;7:2019–2031.
- Gao W, Lv X, Xie J, et al. Corrosion resistance of titanium alloy OCTG in severe environment. Rare Met Mater Eng. 2018;47:151–156.
- Mirgorodskiy SI, Lyubomudrov SA, Bitsoyev GD, et al. Application of titanium alloy and titanium-based coatings in a gate valve during oil production. Mater Sci Forum. 2021;1022:159–167.
- Jin HX, Wei KX, Li JM, et al. Research development of titanium alloy in aerospace industry. Chinese J Nonferrous Met. 2015;25:280–292.
- Fang ZZ, Paramore JD, Sun P, et al. Powder metallurgy of titanium – past, present, and future. Int Mater Rev. 2017;63:1–53.
- Paramore JD, Fang ZZ, Sun P, et al. A powder metallurgy method for manufacturing Ti–6Al–4V with wrought-like microstructures and mechanical properties via hydrogen sintering and phase transformation (HSPT). Scrip Mater. 2015;107:103–106.
- Yang F, Gabbitas B. Feasibility of producing Ti–6Al–4V alloy for engineering application by powder compact extrusion of blended elemental powder mixtures. J Alloys Compd. 2016;698:1455–1461.
- Zheng Y, Yao X, Su Y, et al. High strength titanium with a bimodal microstructure fabricated by thermomechanical consolidation of a nanocrystalline TiH2 powder. Mater Sci Eng A. 2017;686:11–18.
- Xin J, Emura S, Liu T, et al. Effect of oxygen addition on microstructures and mechanical properties of Ti–7.5Mo alloy. J Alloys Compd. 2017;737:221–229.
- Luo SD, Song T, Lu SL, et al. High oxygen-content titanium and titanium alloys made from powder. J Alloys Compd. 2020;836:155526.
- Snizhko O, Ryabtsev A, Troyanskyy A, et al. Influence of oxygen addition on structure and properties of titanium produced by electroslag remelting. Mater Sci Appl. 2016;7:139–149.
- Chen B, Shen J, Ye X, et al. Advanced mechanical properties of powder metallurgy commercially pure titanium with a high oxygen concentration. J Mater Res. 2017;32:1–8.
- Luo Y, Zhang Z, Xie Y, et al. The role of nanoscale heterogeneous structure in simultaneously enhancing strength and ductility of high-oxygen Ti–6Al–4V alloy. Powder Metall. 2020;64:1–7.
- Kondoh K, Ichikawa E, Issariyapat A, et al. Tensile property enhancement by oxygen solutes in selectively laser melted titanium materials fabricated from pre-mixed pure Ti and TiO2 powder. Mater Sci Eng A. 2020;795:139983.
- Luo YF, Xie YH, Cao L, et al. Harmonically structured Ti–6Al–4V alloy with ultrahigh strength fabricated by thermomechanical consolidation of mechanically milled TiH2 /Al 60V 40 powder blend. Mater Sci Eng A. 2020;787:139493.
- Wu XG, Zhang DL, Zhang Y, et al. Correlation between microstructures and tensile deformation behavior of a PM near α Ti–6Al–2Sn–4Zr–2Mo–0.1Si alloy. Mater Sci Eng A. 2021;825:0921–5093.
- Wang SCA, Starink M. Effect of self-accommodation on α/α boundary populations in pure titanium. Acta Mater. 2003;51(9):2485–2503.
- Beladi H, Chao Q, Rohrer GS, et al. Variant selection and intervariant crystallographic planes distribution in martensite in a Ti–6Al–4V alloy. Acta Mater. 2014;80:478–489.
- Dariusz G, Piotr S, Adrian M. Effect of compaction pressure and heating rate on microstructure and mechanical properties of spark plasma sintered Ti6Al4V alloy. Arch Civil Mech Eng. 2016;16(4):702–707.
- Zhao YQ, Chen YN, Zhang XM, et al. Phase transformation and heat treatment of titanium alloy. Changsha: Central South University Press; 2012.
- Liu C, Lu Y, Tian X, et al. Influence of continuous grain boundary α on ductility of laser melting deposited titanium alloys. Mater Sci Eng A. 2016;661:145–151.
- Hui S, Zhao Y, Peng G, et al. In-situ SEM observations of tensile deformation of the lamellar microstructure in TC21 titanium alloy. Mater Sci Eng A. 2013;559:515–519.
- Sauer C, Lütjering G. Influence of α layers at β grain boundaries on mechanical properties of Ti-alloys. Mater Sci Eng A. 2001;319:393–397.
- Zhao JW, Ding H, Hou HL, et al. Influence of hydrogen content on hot deformation behavior and microstructural evolution of Ti600 alloy. J Alloys Compd. 2010;491:673–678.
- Labusch R. A statistical theory of solid solution hardening. Basic Solid State Phys. 1970;41(2):659–669.
- Hall EO. The deformation and ageing of mild steel: III discussion of result. Proc Phys Soc. 1951;64:747–753.
- Petch NL. The cleavage strength of polycristal. Iron Steel Inst. 1953;174:25–28.
- Kobayashi Y, Tanaka Y, Matsuoka K, et al. Effect of forging ratio and grain size on tensile and fatigue strength of pure titanium forgings. Mater Sci. 2005;54:66–72.
- Niu HZ, Zhang HR, Sun QQ, et al. Breaking through the strength-ductility trade-off dilemma in powder metallurgy Ti 6Al 4V titanium alloy. Mater Sci Eng A. 2019;754:361–369.