
 ?Mathematical formulae have been encoded as MathML and are displayed in this HTML version using MathJax in order to improve their display. Uncheck the box to turn MathJax off. This feature requires Javascript. Click on a formula to zoom.
ABSTRACT
A Ti–6Al–4V (wt%) alloy was prepared by laser powder bed fusion (LPBF) of a coarse powder with particle sizes in the range of 50–200 μm. The effect of volume energy density (VED) on cavities/pores, microstructure and mechanical properties of the LPBF-fabricated samples was investigated. The results showed that with the increase of VED, the content of cavities/pores decreased. When the VED was 100 J/mm3 and above, the content of cavities/pores decreased to below 0.3%, and the yield strength (YS), ultimate tensile strength (UTS) and elongation to fracture reached 1032, 1052 MPa and 7.0%, which are close to the tensile properties of Ti–6Al–4V alloy prepared by LPBF of a fine powder (particle sizes: 15–53 μm). The microstructure of the samples consisted of β-columnar crystals containing acicular α′ martensite. After vacuum annealing at 800°C and 900°C respectively, the microstructure of the fabricated samples changed to an α+β lamellar structure, with a substantial decrease in YS and UTS to 836 and 919 MPa, respectively, but a significant increase in elongation to fracture to 15.9%, resulting in very good overall tensile properties. This study shows that with a sufficient VED and proper heat treatment, a Ti–6Al–4V alloy with good metallurgical quality and excellent overall tensile properties can be fabricated by LPBF of a coarse powder.
Introduction
Laser powder bed fusion (LPBF) is an additive manufacturing (AM) technology which is widely used to produce workpieces with complex shapes and for various applications in aerospace, marine, medical and other industries [Citation1]. For LPBF, fine powders with particle sizes in the range of 15–53 μm are generally used, but they are usually more than three times more expensive than conventional metal powders with the same composition and larger particle sizes. In producing metal powders by gas atomization, normally only less than 40% of the particles fall into the particle size range of 15–53 μm, and 50% or more of the powder particles have sizes greater than 53 μm. The powder consisting of such large powder particles is termed as a coarse powder and needs to find applications. In recent years, some efforts have been made in reducing the raw material cost of LPBF mainly by increasing the powder reuse rate and regulating the ratio of fine and coarse powders. Sara et al. [Citation2] used 17-4 PH stainless steel recycled powder in the LPBF manufacturing process and found the internal porosity decreased by increasing the number of reuses. Gu et al. [Citation3] investigated the effect of powder particle size distribution on the mechanical properties of LPBF-fabricated Ti–6Al–4V (wt%) alloy, and the results showed that the specimens prepared from metal powders with a bimodal size distribution had a higher relative density and better mechanical properties. Yang et al. [Citation4] showed that with the increase of the coarse powder proportion, the scanning trajectory morphology changed from smooth to undulating, and the LPBF-fabricated 316 stainless steel samples still had good mechanical properties (tensile strength: 662 MPa, elongation to fracture: 47%) with the introduction of 20% of coarse powder. It is expected that metal parts fabricated by LPBF of a coarse powder would have some difference in metallurgical quality from those fabricated by LPBF of a fine powder, but good mechanical properties can still be obtained by optimizing process parameters, such as laser power, scan speed, scan spacing, etc. Yu et al. [Citation5] used LPBF of a coarse Fe-Ni-Al alloy powder with particle sizes of 110–180 μm to prepare samples and found that with optimal process parameters, samples with a desired geometry and low level of porosity (0.02–0.08%) and other defects such as microcracks or unmelted particles were obtained.
The microstructure of LPBF-fabricated Ti–6Al–4V alloy consists of fine acicular martensite (α′ phase) [Citation6] with a high strength but limited ductility (elongation to fracture: normally less than 10%). To improve the ductility of the LPBF-fabricated Ti–6Al–4V alloy, heat treatment is performed. Bey et al. [Citation7] found that annealing at 850°C which falls in the α+β phase zone for 2 h and followed by furnace cooling caused the acicular martensite structure to decompose into an α+β lamellar structure, and the elongation to fracture of the alloy significantly increased from 7.4% to 12.8%. Wu et al. [Citation8] observed that annealing at temperatures below 600°C had almost no effect on the microstructure of the LPFB-fabricated Ti–6Al–4V alloy. With the heat treatment temperature in the range of 750°C-990°C, the acicular martensitic structure decomposed, and the volume fraction of the α phase decreased with increasing temperature. When the temperature exceeded 1000°C, the pristine β grains transformed to larger equiaxed β grains. Singla et al. [Citation9,Citation10] also showed that the microstructural changes of the LPBF-fabricated Ti–6Al–4V alloy produced by annealing at a temperature near the β-transition temperature caused a significant improvement in mechanical properties.
Titanium alloys are widely used in many fields such as aerospace, marine, and biomedical because of their good corrosion resistance, high specific strength, and good overall performance [Citation11]. However, the applications of LPBF-fabricated titanium alloy parts are severely limited by the high cost of fine alloy powders. If it is proven that a coarse titanium alloy powder with large particle sizes (50–200 μm) and a cost which is only a fraction of that of a fine powder can be used in fabricating parts using LPBF, the range of the applications of LPBF in producing titanium alloy parts with complex shapes would become much wider. Based on this consideration, this work investigates the microstructure and tensile properties of a Ti–6Al–4V alloy fabricated by LPBF of a coarse powder with various process parameters and before and after heat treatment. The findings from this investigation would provide a knowledge base for further research and applications of LPBF of titanium alloy coarse powders to the manufacture of low-cost titanium alloy materials and parts in the future.
Materials and methods
A Ti–6Al–4V alloy spherical powder of 50–200 μm was used as the raw material for LPBF, and the powder particle morphology and size distribution are shown in . The chemical composition of the powder is shown in . The LPBF was performed using an LPBF equipment of model FS271M manufactured by Huashu Hi-Tech, China.
Figure 1. Morphology and particle size distribution of the Ti–6Al–4V alloy powder.
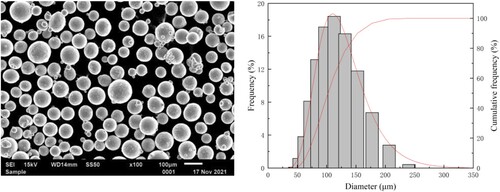
Table 1. Composition of Ti–6Al–4V titanium alloy powder (wt%).
The process parameters are shown in . The scanning strategy is rotational scanning in blocks with a rotation angle of 67° per layer. For LPBF, the laser VED is calculated by Equation (1):
(1)
(1) where P is the laser power, V is the scanning speed, h is the scanning spacing which is 100 μm in this study, and t is the layer thickness of the powder spread which is 40 μm in this study. The powder was dried in a vacuum oven at 200°C for 2 h. Argon was used as the protective gas. The LPBF-fabricated samples are shown in , and they were cut off the substrate by electric discharge wire-cutting. The size of the metallographic blocks is 10 × 10 × 3 mm3, and the tensile test specimens have a dogbone shape with a total length of 40 mm and a gauge section size of 13 × 3 × 2 mm3, as shown in .
Figure 2. LPBF-fabricated samples.
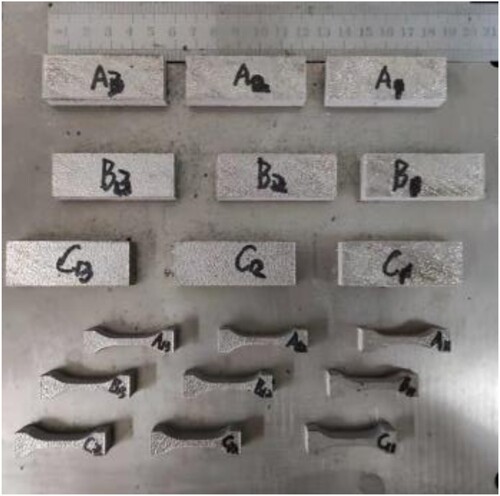
Figure 3. Drawing of the tensile test specimen.
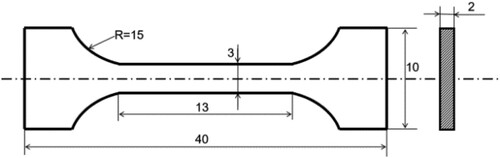
Table 2. Process parameters of LPBF.
The metallographic sample blocks were ground, polished and etched on the XOZ and XOY surfaces with a solution of hydrofluoric acid and nitric acid (HF: HNO3: H2O ratio: 1:3:3) for 30 s. The microstructures of the samples were examined using an optical microscope (Axio Lab. A1 Mat) and a scanning electron microscope (SEM) (JMS-7001F and JSM-6510A). The phase constitute of the samples was characterized by X-ray diffractometer (XRD) (Rigaku Smartlab 9) with Cu Kα radiation, operating current and voltage of 30 mA and 40 kV, respectively, and a step size of 5°/min. The Vickers microhardness of the samples was measured with a load of 200 g and load holding time of 10 s. The tensile testing was performed using an electronic universal testing machine (AG/X Plus 100N) and a strain rate of 5 × 10⁻⁴ s−1. Three specimens were tested for each sample.
The α + β→β (Tβ) transus temperature of Ti–6Al–4V alloy is 995°C [Citation12], and based on this, two temperatures, 800 and 900°C, were used to investigate the effect of annealing in the two-phase region on the microstructure and mechanical properties of the LPBF-fabricated samples. The samples fabricated using the optimal process parameters were heated in a vacuum at a rate of 5°C/min to 800°C or 900°C, held at the temperature for two hours, and then air-cooled to room temperature. The microstructure and tensile properties of the heat-treated samples were characterized in the same way as the as-fabricated samples.
Results and discussion
Cavities and pores
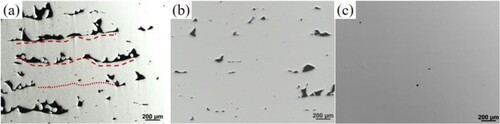
shows the morphologies of cavities and pores on the XOZ planes of three samples fabricated by LPBF with different VED. As shown in (a), in A1 sample which was prepared using a low energy density of 50 J/mm3, there are a large fraction of cavities which are unfilled gaps between powder layers. There are also isolated spherical metal powder particles which were not molted. This is due to the fact that when the laser VED is low, the melting is insufficient. In contrast, in B2 sample which was prepared using a higher energy density of 75 J/mm3, the content of cavities is significantly reduced, and they are no longer connected. For the C3 sample which was prepared using the highest energy density of 120 J/mm3, the cavities are eliminated, and there are only a small number of fine pores in the sample, as shown in (c). It can be seen that with a sufficient laser VED, samples with a very small amount of defects and very small defects can be prepared by LPBF of a coarse powder.
Figure 4. Morphologies of cavities and pores on the XOZ planes of (a) A1 sample, (b) B2 sample, and (c) C3 sample.
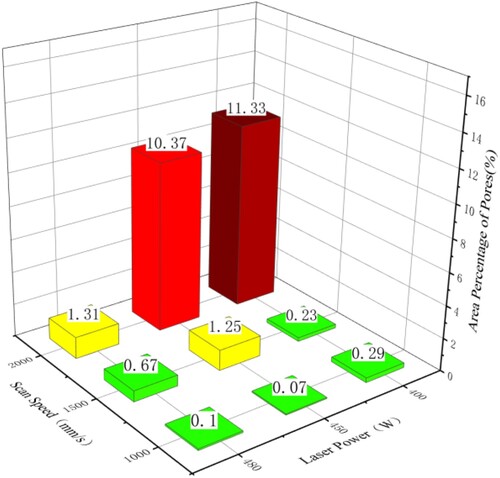
The contents of cavities and pores viewed on the XOZ planes of the samples were statistically analyzed by performing image analysis on 30 optical microcopy images taken in an area of 10 × 10 mm2 using the ImageJ software. As shown in , with a low scanning speed of 1000 mm/s, the fraction of cavities and pores in all three samples fabricated with a laser power of 400–480 W is very low, being less than 0.3%. With the scanning speed increasing to 1500 mm/s, the fraction of cavities and pores in the samples is not high either, being less than 1.5%. However, when the scanning speed increases to 2000 mm/s, the samples can contain a larger amount of cavities and pores, with their fraction being more than 10%.
Figure 5. Area percentages of cavities and pores in the XOZ planes of the LPBF-fabricated samples
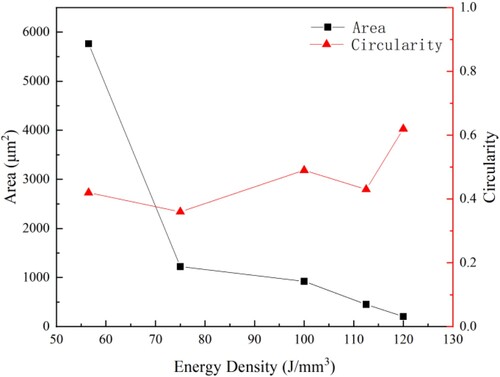
shows the average area and circularity of cavities and pores as functions of laser VED. It can be seen that the average area of the cavities and pores decreases rapidly when the laser energy density increases from 56.5 to 75 J/mm3, and then it decreases slowly with increasing laser energy density. With the energy density being below 112.5 J/mm3, the average circularity of the cavities and pores basically fluctuates around 0.4, meaning that most of them are irregularly shaped. When the energy density exceeds 112.5 J/mm3, the average circularity of the cavities and pores increases rapidly to 0.62, showing that their shapes are close to be rounded. The reason for this change is likely that with a high laser energy density, melting is sufficient to nearly eliminate the cavities formed by unfilling gaps between particles, and the defects are mainly pores formed by trapping gas produced from metal evaporation ().
Figure 6. The average area and circularity as functions of laser energy density.
Cavities and pores are the main defects in the LPBF-fabricated samples, and it is clear from this work that the laser energy density has a significant influence on them. The explanation for the formation of cavities and pores is given in references [Citation13,Citation14]. The defects are roughly categorized into irregular cavities and circular pores. Often, the spheroidization effect is again present in cavities at low energy density, where metal powder particles form mutually isolated metal spheres under the combined effect of surface tension, gravity, and the surrounding medium after laser irradiation, as shown in (a). The spheroidization effect is also an important factor for forming defects in the LPBF process [Citation15,Citation16]. When the energy density is increased, the content of cavities is significantly reduced. With the increase of laser energy density, the amount of molten metal in the liquid pool is larger, so there is more liquid to spread and fill the gaps between the powder particles, leaving no cavities between particles. However, when the laser power is too high and the scanning speed is too small, that is, when the laser energy density is very high, the powder particles would absorb too much heat and the liquid pool reaches a very high temperature. In this case, the components in the powder with lower melting and boiling points vaporize, and the resulting gas remains inside the solidified melt pool, forming round pores. In addition, the high energy density laser beam quickly melts powder, the inert protective gas in the molding cavity does not react chemically and overflows from the melt pool. Once the solidification rate of the melt pool is greater than the overflow rate of the inert gas, the gas would be trapped, forming bubbles which become pores after the liquid solidifies. Studies have shown that when the volume of the porosity defect in the part is less than 1% of the overall volume, it has a small effect on the mechanical properties of the part, and only when it is greater than 5%, it has a significant effect on the mechanical properties of the manufactured part [Citation17]. Other than cavities and pores, cracks can also form during LPBF of metal powders, as explained by Wei et al. [Citation18]. It is interesting to note that such type of defects is not prevalent in the LPBF-fabricated Ti–6Al–4V alloy samples in this study, even though a coarse powder is used. This suggests that titanium alloy powders are favorable for LPBF [Citation19].
Microstructure
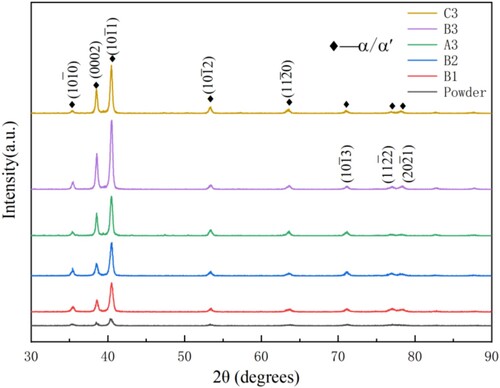
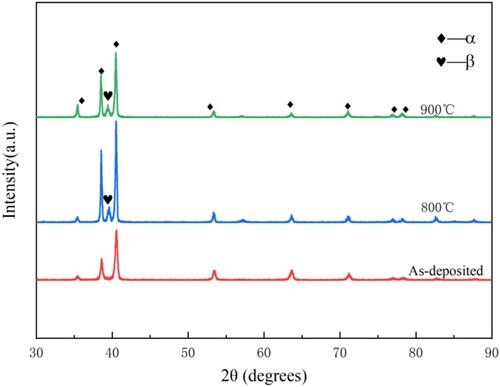
From the XRD patterns shown in , it can be seen that the microstructures of the samples are all composed of α/α′ phases. The α and α′ phases in the titanium alloy both have HCP structures with very similar lattice parameters, and α′ is a supersaturated solid solution structure of the α phase, so they cannot be distinguished by XRD patterns alone. However, it can be seen that with the increase of energy density, the relative intensity of the {0002{ peak shows a significant increase first and then a slight decrease, indicating that the samples have a strong {0002{ texture. This should come from the {110{ texture of the prior β phase formed during solidification.
Figure 7. XRD patterns of Ti–6Al–4V alloy powder and printed samples.
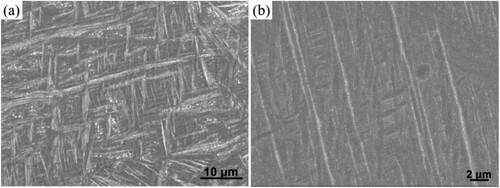
shows the optical microscopy images of samples B1, B2, B3, and C3 in XOY and XOZ planes respectively. All samples have a columnar prior β grain structure parallel to the deposition direction, and the β-columnar crystals contain acicular α′ martensite inside. Parallel α′ martensitic acicula form colonies and are mostly at an angle of 45° to the deposition direction. There is also a mutually perpendicular acicular martensititic structure, which is due to the different laser scanning directions in the overlap zone and the accumulation of heat flow in different directions in this region after cyclic heating and cooling. The coarser acicular martensite in the lap zone with larger lamellar spacing, which provides more favorable conditions for the nucleation growth. (a) shows a magnified SEM image of the lap zone of sample B3, which shows the morphology of the shorter and coarser acicular martensite crisscrossed with similar net basket shape martensite. (b) magnified the observation of the interior of the elongated acicular martensite, showing that there are even finer acicular martensite α′ phase. Based on the work by Yang et al. [Citation20], there are secondary, tertiary or even quaternary martensite due to multiple thermal cycles.
Figure 8. Optical microscopy images o the microstructures of samples observed on the XOY and XOZ planes: (a) and (b) B1 sample, (c) and (d) B2 sample, (e) and (f) B3 sample, (g) and (h) C3 sample.
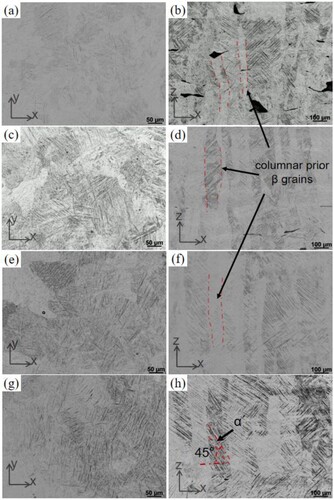
Figure 9. SEM images of the microstructure of B3 sample: (a) Overlap zone (b) elongated martensite enlargement.
It has been established [Citation21,Citation22] that during solidification of the liquid pool in the LPBF process, the β phase of bcc structure preferentially grows in the <100> direction, producing prior β-columnar crystals with <100> directions almost parallel to the deposition direction. During post-solidification cooling, β→α′/α phase transformation occurs, and follows the Burgers’ orientation relationship which can be described as (110)β∥ (0001)α, [11–1]β∥ [11–20]α. According to previous studies [Citation23,Citation24], increasing the cooling rate promotes diffusionless phase transformation, leading to the formation of martensitic structure. Due to the high cooling rate (>105 K/s) in the LPBF process, which is greater than the minimum cooling rate (104 K/S) required for the complete transformation of Ti–6Al–4V alloy into martensitic structure, a pinchy α′ martensitic structure is obtained, as shown in .
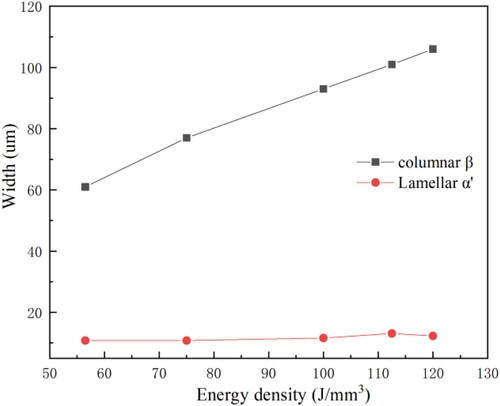
shows the average width of the prior β columnar crystal and the thickness of the α′ martensite lamellae as a function of the laser VED. It can be seen that the width of the columnar crystal is between 60 and 110 μm, and it gradually increases with the laser energy density. The reason for this is likely that with a higher laser energy density, the liquid pool is larger, and the width of the β columnar crystal grown during the directional solidification of the liquid pool correlates with the size of the liquid pool. In contrast, the average thickness of the α′ martensite lamellae does not change much with the change of laser energy density, being around 12 μm. This is not surprising, as the thickness of α′ martensite lamellae is influenced by post-solidification the cooling rate which is not sensitive to the laser energy density into the powder particles prior to melting.
Figure 10. The average width of prior β-columnar crystals and α′ martensite lamellae as functions of laser energy density.
Tensile properties
shows the tensile engineering stress-engineering strain curves of the LPBF-fabricated samples, and their tensile properties are summarized in . It can be seen that the changes in the process parameters did not significantly change the yield strength (YS) and ultimate tensile strength (UTS), with the average YS being around 1040 MPa and the average UTS being around 1150 MPa. The elongation to fracture (EL) of the LPBF-fabricated samples ranges from 4.5% to 7%, with the lowest elongation to fracture of 4.6% for sample A1, which was fabricated with the smallest laser energy density and contains the largest content of cavities and pores. The highest average EL is 7.0% which is well within the 5–10% value range for EL of Ti–6Al–4V alloy samples prepared by LPBF and fine powder (15–53 μm) [Citation25–27].
Figure 11. Tensile engineering stress-engineering strain curves of the LPBF-fabricated samples.
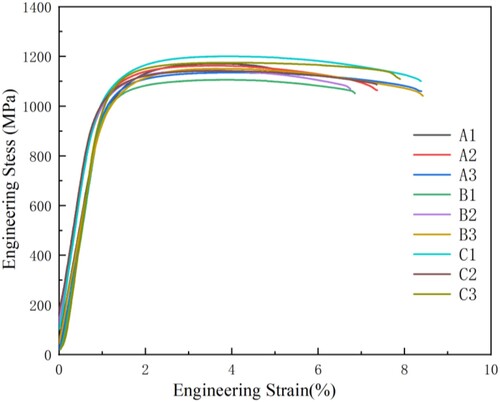
Table 3. Tensile properties of the LPBF-fabricated Ti–6Al–4V samples.
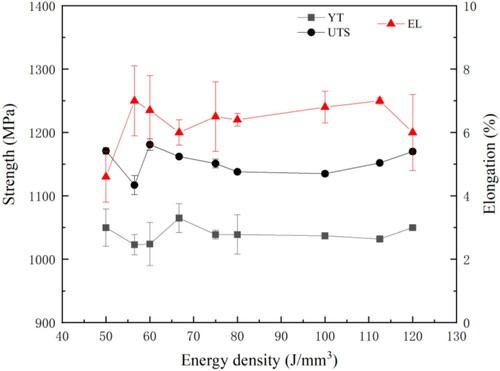
shows the YS, UTS and EL of the samples as functions of laser energy density. It can be seen that the change of energy density has no obvious effect on the YS and UTS. When the laser energy density is as low as 50 J/mm3, the EL is low, being only 4.6%. As the laser energy density increases to 60 J/mm3, the EL increases substantially to 7%, but then it fluctuates in the range 6–7% with the laser energy density increasing from 75 to 120 J/mm3.
Figure 12. Tensile mechanical properties of the LPBF-fabricated samples as functions of the laser energy density.
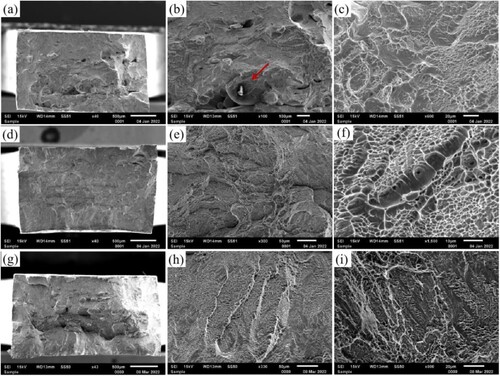
As can be seen from the fracture surfaces of the tensile tested specimens shown in , the fracture surfaces are flush, showing no necking, and mainly composed of small cleavage planes and rough nests. As shown in ) at lower laser energy density, cavities and unmelted powder particles present on the fracture surfaces. As shown in (d–f), with the increase of laser energy density, the cavities disappear, and the number of rough nests increases. As shown in (g–i), with a further increase in laser energy density, pores are present in the fracture surfaces which also show a river-like pattern. The river-like pattern is a typical characteristic of brittle fracture.
Figure 13. SEM images of fracture surfaces of tensile test specimens from (a)–(c) A1 sample, (d)–(f) B3 sample and (g)–(f) C3 sample.
Effects of heat treatment
Parts of the B3 sample were vacuum annealed at 800 and 900°C respectively for 2 h and then cooled in air. The XRD patterns in show that β phase forms in the annealed samples, and the relative intensity of the {0002} peak is also increased, indicating that the α′ martensite decomposed into α and β phases during vacuum annealing and the {0002} texture was enhanced at the same time.
Figure 14. XRD patterns of as-fabricated B3 sample and the samples after vacuum annealing at 800 and 900°C respectively.
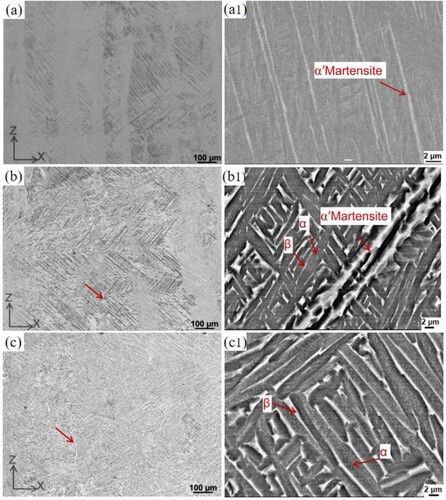
shows the optical microscopy and SEM images of as-fabricated and annealed samples. It can be seen that after annealing at 800°C, the prior columnar β grain boundaries still exist, but the α′ martensitic structure mostly decomposes into an α/β lamellar structure. After annealing at 900°C, the decomposition of α′ martensite becomes complete, and most of the prior β columnar grain boundaries disappear. At this point, the microstructure of the sample is composed of fine α/β lamellar colonies without obvious α plates at prior β grain boundaries. It is observed that as the annealing temperature increases, and the lamellae become obviously thicker and the β-phase content increases.
Figure 15. Optical microscopy and SEM images of the microstructure of as-fabricated B3 sample and the samples after annealing at different temperatures: (a) and (a1) As-fabricated, (b) and (b1) annealed at 800°C, (c) and (c1) annealed at 900°C.
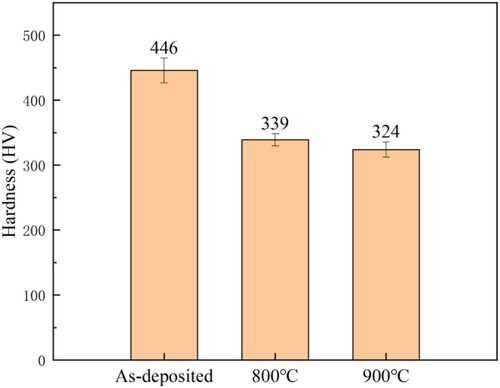
shows the hardness of the as-fabricated B3 sample and the heat-treated samples. It can be seen that the hardness of the sample decreases significantly after annealing. After annealing, the α′ phase gradually decomposes into α phase, and the hardness decreases after annealing because the α′ phase is a supersaturated solid solution, and its hardness is significantly higher than that of the α phase. With the further increase of annealing temperature, the hardness is further reduced. As the α lamellae gradually coarsen with the increase of annealing temperature, the α/β interface strengthening effect is weakened, leading to a reduced hardness.
Figure 16. Hardness of as-fabricated B3 sample and samples after heat treatment at different temperatures.
shows the tensile engineering stress-engineering strain curves of the as-fabricated B3 sample and heat-treated samples, and summarizes the tensile properties of the samples. The YS and UTS of the sample decrease significantly after annealing at 800°C, but at the same time the EL increases significantly to 11.7%. When the annealing temperature is increased to 900°C, the YS is further reduced slightly to 836 MPa, and the EL continues to increase significantly to 15.9%, resulting in good overall tensile properties.
Figure 17. Engineering stress-engineering strain curves of specimens from the as-fabricated B3 sample and heat-treated samples.
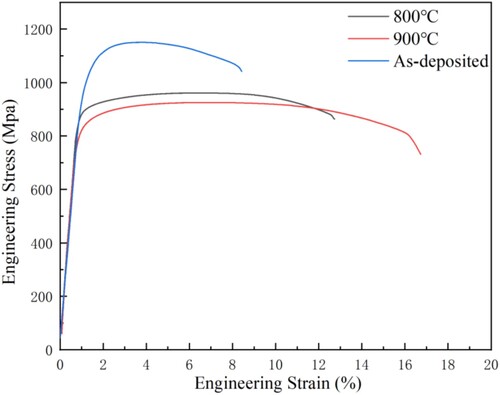
Table 4. Tensile properties of the as-fabricated B3 sample and heat-treated samples.
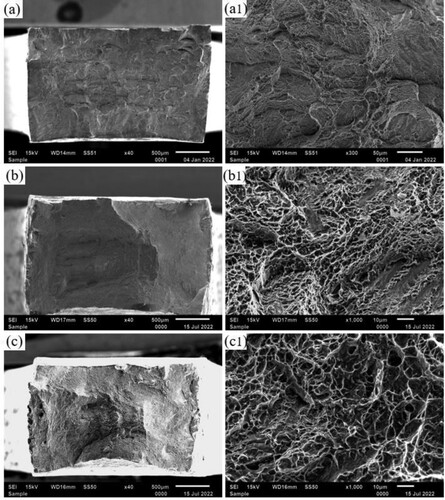
As shown , after annealing at 800°C, the number density of rough nests increases significantly, and the number of unraveling planes and steps clearly decreases. After annealing at 900°C, necking occurs prior to fracture, as evidenced from the engineering stress-engineering strain curve of the sample. In the meantime, the fracture surfaces exhibit a large number density of dimples which are the typical feature of ductile fracture. The large number of dimples on the fracture surface suggest that cavities form during plastic deformation in tensile testing, and they coalesce to form cracks which lead to the fracture of the material. The ductile fracture of the annealed sample shows that the ductility of the LBPF-fabricated Ti–6Al–4V alloy is greatly improved by vacuum annealing at 900°C. Overall, by combining optimized laser energy density and proper heat treatment conditions, Ti–6Al–4V alloy with good combination of strength and ductility can be fabricated by LPBF of a coarse powder with a particle size range of 50–200 μm.
Figure 18. SEM images of fracture surfaces of tensile test specimens from the as-fabricated B3 sample and heat-treated samples: (a) and (a1) as-fabricated, (b) and (b1) annealed at 800°C, (c) and (c1) annealed at 900°C.
Conclusions
Ti–6Al–4V alloy samples were prepared by LPBF of a coarse powder with particle sizes in the range of 50–200 μm with various process parameters, and parts of the sample fabricated with a low level of cavities and pores were annealed at 800°C and 900°C, respectively. The cavities/pores, microstructures and tensile properties of the as-fabricated and heat-treated samples were investigated. The following are the main conclusions from the investigation:
When the energy density is 100 J/mm3 or above, the fraction of the cavities and pores reaches a very low level, being less than 0.3%. Irregular cavities form between powder layers at low energy density, and round pores form at high energy density.
The microstructure of all as-fabricated samples consists of prior β-columnar crystals containing acicular α′ martensite, and the width of the β-columnar crystals increased with increasing energy density.
There is no significant change in yield strength and ultimate tensile strength with different process parameters, which are about 1040 and 1150 MPa, respectively. With a very low energy density, the large fraction (>10 vol.%) of the cavities makes the as-fabricated sample to possess a quite low elongation to fracture (4.5%), but once the energy density is sufficiently high, and the fraction and sizes of cavities sufficiently low, the elongation to fracture fluctuates between 6.0% and 7.0%. Overall, the tensile properties of the good quality samples prepared by LPBF of a coarse powder are comparable with those of the samples prepared by LPBF of a fine powder.
After the LPBF-fabricated sample with a low level of cavities and pores is vacuum annealed at 800oC and 900°C, respectively, its microstructure is transformed into α/β lamellar structure, and a combination of good strength and ductility is achieved, with the yield strength, ultimate tensile strength and elongation to fracture being 836, 919 MPa and 15.9% respectively. This shows that by combining optimum process parameters and heat treatment, a very good combination of tensile properties can be obtained in the Ti–6Al–4V alloy prepared by LPBF of a coarse powder.
Acknowledgements
The powder used in this study was provided by Jiangsu Weilali New Materials Co. Ltd, China, and we thank this company for their support in this work.
Disclosure statement
No potential conflict of interest was reported by the author(s).
Additional information
Funding
References
- Liu S, Shin YC. Additive manufacturing of Ti6Al4V alloy: a review. Mater Des. 2019;164:107552. doi: 10.1016/j.matdes.2018.107552
- Giganto S, Martínez-Pellitero S, Barreiro J, et al. Influence of 17-4 PH stainless steel powder recycling on properties of SLM additive manufactured parts. J Mater Res Technol. 2022;16:1647–1658. doi: 10.1016/j.jmrt.2021.12.089
- Gu H, Gong H, Dilip JJS, et al. Effects of powder variation on the microstructure and tensile strength of Ti6Al4V parts fabricated by selective laser melting. 25th Annual International Solid Freeform Fabrication Symposium; 2014 August 16; Austin, Texas: International Journal of Powder Metallurgy; 2015. p. 35–42.
- Yang X, Ren Y, Liu S, et al. Microstructure and tensile property of SLM 316L stainless steel manufactured with fine and coarse powder mixtures. J Cent South Univ. 2020;27(2):334–343. doi: 10.1007/s11771-020-4299-9
- Kaplanskii YY, Sentyurina ZA, Loginov PA, et al. Microstructure and mechanical properties of the (Fe,Ni)Al-based alloy produced by SLM and HIP of spherical composite powder. Mater Sci Eng A. 2019;743:567–580. doi: 10.1016/j.msea.2018.11.104
- Thijs L, Verhaeghe F, Craeghs T, et al. A study of the microstructural evolution during selective laser melting of Ti-6Al-4V. Acta Mater. 2010;58(9):3303–3312. doi: 10.1016/j.actamat.2010.02.004
- Vrancken B, Thijs L, Kruth J, et al. Heat treatment of Ti6Al4V produced by selective laser melting: microstructure and mechanical properties. J Alloys Compd. 2012;541:177–185. doi: 10.1016/j.jallcom.2012.07.022
- Wu SQ, Lu YJ, Gan YL, et al. Microstructural evolution and microhardness of a selective-laser-melted Ti-6Al-4V alloy after post heat treatments. J Alloys Compd. 2016;672:643–652. doi: 10.1016/j.jallcom.2016.02.183
- Singla AK, Singh J, Sharma VS, et al. Impact of cryogenic treatment on HCF and FCP performance of β-solution treated Ti-6Al-4V ELI biomaterial. Materials. 2020;13(3):500. doi: 10.3390/ma13030500
- Singla AK, Singh J, Sharma VS. Impact of cryogenic treatment on mechanical behavior and microstructure of Ti-6Al-4V ELI biomaterial. J Mater Eng Perform. 2019;28:5931–5945. doi: 10.1007/s11665-019-04338-y
- He B, Wu W, Zhang L, et al. Microstructural characteristic and mechanical property of Ti6Al4V alloy fabricated by selective laser melting. Vacuum. 2018;150:79–83. doi: 10.1016/j.vacuum.2018.01.026
- Yan X, Yin S, Chen C, et al. Effect of heat treatment on the phase transformation and mechanical properties of Ti6Al4V fabricated by selective laser melting. J Alloys Compd. 2018;764:1056–1071. doi: 10.1016/j.jallcom.2018.06.076
- An C, Zhang YM, Zhang JS, et al. Study on the effect of process parameters on the density of selected laser melting molded parts and the formation mechanism of pore defects. Laser J. 2018;39(07):68–71.
- Verhaeghe F, Craeghs T, Heulens J, et al. A pragmatic model for selective laser melting with evaporation. Acta Mater. 2009;57(20):6006–6012. doi: 10.1016/j.actamat.2009.08.027
- Zhao CL, Li W, Wang Q, et al. Study on the internal defects and their evolution law of titanium alloy formed by laser-selective melting. Chin J Rare Metal Mater Eng. 2021;50(08):2841–2849.
- Peng L, Zheng ZJ. Overview of defect types and characterization methods for laser-selective melting of formed metal parts. Chin J Mater Guide. 2023;8:1–14.
- Qiu CL, Adkins NJE, Attallan MM. Microstructure and tensile properties of selectively laser-melted and of HIPed laser-melted Ti-6Al-4V. Mater Sci Eng A. 2013;578:230–239. doi: 10.1016/j.msea.2013.04.099
- Wei Q, Xie Y, Teng Q, et al. Crack types, mechanisms, and suppression methods during high-energy beam additive manufacturing of nickel-based superalloys: a review. Chin J Mech Eng Addit Manuf Front. 2022;1:100055. doi: 10.1016/j.cjmeam.2022.100055
- Cai C, Wu X, Liu W, et al. Selective laser melting of near- titanium alloy Ti-6Al-2Zr-1Mo-1V: parameter optimization, heat treatment and mechanical performance. J Mater Sci Technol. 2020;57:51–64. doi: 10.1016/j.jmst.2020.05.004
- Yang JJ. Organizational evolution and regulation of laser-selective melting and forming of Ti-6Al-4V alloy [PhD thesis]. Wuhan (China): Huazhong University of Science and Technology; 2017.
- Gusarov AV, Malakhova-Ziablova IS, Pavlov MD. Thermoelastic residual stresses and deformations at laser treatment. Phys Procedia. 2013;41:896–903. doi: 10.1016/j.phpro.2013.03.164
- Tan X, Kok Y, Tan YJ, et al. Graded microstructure and mechanical properties of additive manufactured Ti-6Al-4V via electron beam melting. Acta Mater. 2015;97:1–16. doi: 10.1016/j.actamat.2015.06.036
- Beladi H, Chao Q, Rohrer GS. Variant selection and intervariant crystallographic planes distribution in martensite in a Ti-6Al-4V alloy. Acta Mater. 2014;80:478–489. doi: 10.1016/j.actamat.2014.06.064
- Rotella G, Dillon OW, Umbrello D, et al. The effects of cooling conditions on surface integrity in machining of Ti6Al4V alloy. Int J Adv Manuf Technol. 2014;71(1-4):47–55. doi: 10.1007/s00170-013-5477-9
- Gao JB. Study of microstructure and mechanical properties of TC4 titanium alloy box-shaped components at different forming positions by laser-selective melting [masters thesis]. Shenyang (China): Northeastern University; 2019.
- Chang K, Liang E, Huang W, et al. Microstructural feature and mechanical property in different building directions of additive manufactured Ti6Al4V alloy. Mater Lett. 2020;267:127516. doi: 10.1016/j.matlet.2020.127516
- Nguyen HD, Pramanik A, Basak AK, et al. A critical review on additive manufacturing of Ti-6Al-4V alloy: microstructure and mechanical properties. Mater Res Technol. 2022;18:e4661.