
ABSTRACT
CCTV is associated with reductions in property crime and narcotics crime, but mainly in parking lots and residential areas. Recent findings from Sweden have suggested that the association of CCTV with crime may be different in deprived neighbourhoods where criminal networks exert alarge influence. In addition, much less research has been done on the impact of CCTV on crime clearance. The present study follows up on this by considering changes in crime, and crime clearance, associated with CCTV in three deprived neighbourhoods in Gothenburg. Changes in recorded crime for seven crime types and their clearance rate is followed. The changes are compared with changes at similar locations in six other deprived neighbourhoods. The results show that relative to controls, violence was significantly reduced at treatment areas. No significant change was noted for property crime. Crime clearance rates increased at treatment areas relative to controls for both property crimes and violent crimes, but no change was significant. This suggests aneed for further study on contextual differences of different locations for CCTV, to ascertain whether the effect on violence in deprived neighbourhoods can be replicated. It also raises questions on whether the CCTV is cost-effective.
Introduction
The use of CCTV among police and other actors interested in security have continuously increased throughout the last few decades (Piza, Citation2018). It is now fairly well established that CCTV cameras can reduce crime, but mainly for some crime types, and on some types of locations (Piza et al., Citation2019). CCTV appear to exhibit crime reduction effects in residential areas and car parks, but not in other types of locations. It appears to reduce problems of drug and property crime, but not violence or disorder. Perhaps most importantly, however, crime reduction effects from CCTV appear to mostly result from interventions when the cameras are actively monitored, and when they are combined with other interventions such as police patrols, lighting or community outreach (Piza et al., Citation2019). This means that CCTV has the potential to be an important tool in crime reduction, but it needs careful analysis and appropriate resources to reach its full potential, and whether it is resource-effective compared to alternative approaches to reduce crime is less certain. The present paper adds to the literature by providing evidence on whether CCTV appear to reduce violent or property crimes in residential areas in deprived neighbourhoods in a Swedish city.
An additional potential benefit of CCTV is that it may increase crime clearance, but on this topic much less is known. While the Swedish police do state the importance of CCTV as an investigative tool to clear crimes (Polisen, Citationunknown), the only Swedish study on the topic to date found that it rarely was of great value in trials (Brå [National Council for Crime Prevention], Citation2015a). There is surprisingly little research on CCTV as a tool for investigative work internationally too, as noted by Ashby (Citation2017; Also Honovich, Citation2008). A few studies have identified substantial increases in clearance of crime when CCTV footage is available, but those studies are from trains and train stations, and findings may not be generalizable to other contexts (Ashby, 2018; Morgan & Dowling, Citation2018). CCTV in a cramped indoors environment such as a train is very different from outdoors CCTV covering a large area, not least in respect of the possibility to identify suspects. The roof of a train is less than 3 metres up, a distance that rarely is achieved with outdoors CCTV.
Meanwhile, CCTV has become one of the main go-to solutions for politicians and police in Sweden in their struggle to reduce crime and other problems in deprived neighbourhoods where criminal networks impact on community life. This has led to a rapid expansion of police operated CCTV in such neighbourhoods across urban areas of Sweden, but to date very little research exist on those surveillance systems. The only study published regarding such a location is a case study by Kronkvist et al. (Citation2019) who found associations with reduced violence, and improved police ability to combat narcotics crime. The present study will follow up on those findings, by studying the introduction of 28 cameras in three different neighbourhoods of northeastern Gothenburg. All three neighbourhoods are classified by the national police as among the 61 vulnerable neighbourhoods of Sweden, deprived neighbourhoods where criminal networks have a large impact on the local community (Polisen, Citation2019). They will be compared to the six other neighbourhoods classified as vulnerable in the city of Gothenburg, three of which are located in the same part of the city, and three in other parts of the city.
The aim of the paper is to ascertain whether the introduction of CCTV in these three neighbourhoods is associated with (a) less crime and (b) more suspects identified for six crime types commonly taking place in public environments; outdoors assaults, personal robberies, theft from a motor vehicle, bicycle theft, vandalism and arson. To answer these questions the CCTV-monitored areas are compared to similar areas in similar neighbourhoods.
It should be noted however that this is a short-term follow-up – with 11-month follow-up for two of the neighbourhoods and 7 months for one of the neighbourhoods. The present study thus only gives an indication on the potential effects of CCTV in the months following its installation, and future studies will need to consider long-term effects of the CCTV.
Research on CCTV and crime prevention
While CCTV use for security purposes is widespread, the effects it has on crime and related topics is fairly small. The pooled effect size for CCTV across all types of locations and crimes was a 13% reduction in crime in the latest meta-study (Piza et al., Citation2019). Broken down to crime types the effects were significant for two types of crime, property crime (−14%) and narcotics (−20%). There was no effect identified on violence. For differing types of locations it was noted that significant effects were found for residential areas (−12%) and car parks (−37%). There was no effect identified in city centres or public transport, nor in housing. The difference between the place categories of housing and residential area are not self-evident. Housing means surveillance only affecting the buildings and courtyard of residential buildings, while residential areas has a wider application to capture streets and other public areas (Piza et al., Citation2019). In practice, this could be interpreted as saying that public places in residential neighbourhoods appear to be a better location for CCTV than the actual housing of such neighbourhoods.
In the meta-study there were four studies from Sweden included (Piza et al., Citation2019), but a few more exist, and Sweden now has a fairly decent knowledge base on CCTV and crime. Two studies that were not included in the meta-study found significant positive effects of CCTV on disorder at football stadiums (Priks, Citation2014) and on crime in the Stockholm subway (Priks, Citation2015). The latter is of particular interest for the study at hand since the subway system covers both the city centre and deprived neighbourhoods similar to the ones studied here. In general, the subway CCTV was associated with 20% less pickpocketing and 60% less robbery, with some displacement to nearby areas identified (Priks, Citation2015). Notably however, the crime reducing effects of CCTV in the Stockholm subway was only identified for the city centre, not for the deprived neighbourhoods.
A study that directly deals with CCTV in deprived neighbourhoods with a presence of criminal networks found that violence went down, but not property crime (Kronkvist et al., Citation2019). While none of the changes were significant, the direction of change is at odds with the general findings from CCTV as discussed above. It was suggested that the change may have been related to CCTV impacting on narcotics sales by local gangs, with the same gangs also being responsible for violence, and impact on narcotics therefore spilling over into an effect on violence. The present study will build on those findings by considering similar types of neighbourhoods after CCTV was installed.
CCTV and crime clearance
The effect of CCTV on crime clearance can as suggested by Jung and Wheeler (Citation2019) be related both to real time monitoring leading to quick apprehension of suspects, and to identifying suspects after the fact through considering recorded video. Some earlier research on CCTV in investigative work noted that the video quality at times was insufficient for it to be useful, especially at night and for residential areas (Gill & Spriggs, Citation2005). While quality issues certainly persist, the rapid technology development is likely to have alleviated such issues to some extent.
In recent years, studies have indeed found that CCTV can be effective. Morgan and Dowling (Citation2018) found that the police requested CCTV footage from the New South Wales rail network on average 17 times per day, suggesting that the footage is highly sought after for criminal investigations. Morgan and Dowling (Citation2018) found that cases where the police requested footage had an 18% higher clearance rate than cases where footage was not requested in the New South Wales, Australia, rail network. An even bigger effect was noted by Ashby (2018) who studied the British rail network, and found that cases where useful CCTV footage was available had on average more than twice the clearance rate than cases where it was not. The biggest effect was noted for robberies, where only 9% of cases were cleared when useful CCTV footage was absent, as compared to 56% with useful footage. There was however no effect on fraud, nor on drugs and weapons crimes. For weapons and drugs, this is not very surprising, considering they usually are registered when the police find the contraband on a person, and thus can arrest that person immediately on site.
Dowling et al. (Citation2019) also considered how investigators used CCTV. They found that the investigators valued the CCTV material, but also that it varied by crime type how useful it was, with assault offences having the best use of CCTV material in investigative work. These studies all considered crimes taking place within the train or train station context however, which typically are fairly small and enclosed locations, which facilitates the identification of suspects. This raises some doubts as to the generalizability of the findings. There are, however, a couple studies on CCTV and crime clearance in more general contexts. Piza et al. (Citation2014) noted that the share of cases where an arrest were made was more than twice as high for crimes that was discovered through actively monitored CCTV as compared to those that were reported by the public. Coupe and Kaur (Citation2005) similarly found that clearance for burglary was significantly higher when the crime took place at a CCTV monitored location. Jung and Wheeler (Citation2019) similarly showed that the introduction of CCTV was associated with an additional 2% of crimes cleared, but only significantly so for thefts. In total, they found that the introduction of 293 cameras was associated with 277 more thefts cleared, but considering that theft is a fairly low cost crime they concluded that it was dubious if the cameras were cost effective. Overall, the international body of research seem to suggest that CCTV can increase crime clearance, although it is uncertain if this is cost effective.
In a Swedish context, the only study considering crime clearance to date (Brå, Citation2015a), found that CCTV evidence had a major impact in some trials, which suggests it can be of importance. This was however rare, suggesting that its importance was limited. There were 1188 crimes in the CCTV area. About 20% of the investigations in the area requested CCTV footage (n = 228), and of these about 70% mentioned the footage in the police investigation (n = 150), of which then 30% made it clear that the footage was important to follow the incident and identify the suspect (n = 45). In the end, half of those resulted in a prosecutor pressing charges (n = 21), and the CCTV material was considered of importance in the trial for eight cases, seven of which were convictions and one of which where the suspect was considered not guilty due to acting in self-defence.
Study setting and national context
Both police and politicians have highlighted CCTV as a prominent tool to reduce crime and increase clearance rates (Polisen, Citationunknown; Regeringen, Citation2019). In particular, this has been brought up in relation to deprived neighbourhoods of Sweden where criminal networks have a large impact on local communities (Polisen, Citation2017, Citation2019). Compared to other urban areas in Sweden, such neighbourhoods are characterized by higher levels of fear, more open air drug markets, more burning cars, and elevated levels of gang violence in the form of shootings and explosions (Brå, Citation2017; Polisen, Citation2017; Malmberg et al., Citation2013; M. Gerell, Citation2017; Sturup, Gerell, et al., Citation2019a). In particular, gun violence has increased substantially the past 20 years (Sturup et al., Citation2019b), to a large extent driven by increases in deprived neighbourhoods (Brå, Citation2015b), and this has led to a strong focus nationally from policymakers and police to combat these problems.
For the above specified reasons Sweden has seen a large increase in CCTV surveillance of deprived neighbourhoods. The surveillance typically covers the central parts of deprived residential neighbourhoods where local businesses are clustered in addition to a varying amount of housing areas surrounding the centre. Arguably this corresponds to residential areas in the Piza et al. (Citation2019) meta-study, which was one of the location types that were found to be associated with crime reductions.Footnote1 The cameras have the potential to be actively monitored, but the extent to which this happens is unknown, and likely to be fairly minor. CCTV is combined with multiple other measures to reduce crime, such as increased police patrols, community policing and situational crime prevention. Both the potential for active monitoring and the use of multiple types of interventions were factors that was found to be associated with better crime prevention potential of CCTV (Piza et al., Citation2019). Based on the international findings then these cameras could potentially be in a good position to achieve crime reduction (Piza et al., Citation2019). It is yet to be determined if this is the case in Sweden where CCTV surveillance has been noted for positive results in closed locations, subway stations and football stadiums (Priks, Citation2014, Citation2015), but more mixed results in open settings (M. Gerell, Citation2016; Brå, Citation2015a; Kronkvist et al., Citation2019).
The present study aims to produce more knowledge on the effects of CCTV on crime in deprived neighbourhoods with a strong presence of criminal networks, and in particular on whether the addition of CCTV has contributed to increased clearance rates.
In this paper, the introduction of 28 camera points across three neighbourhoods is studied. The camera points are mostly installed at the roof of buildings. They typically include five cameras at each camera point, with four of them being fixed in different directions to provide a 360 view. The fifth camera is movable, so that the police can control it in real time through both pan and zoom, and so that it can be given a default setting which it returns to if not actively controlled. Although the cameras provide a good overview of events in the areas they cover, it is typically difficult to identify faces with them unless zoom is used. This means that even if a crime is caught on tape, it is often not possible to identify a suspect based on that footage itself. Some cameras however are positioned at a smaller distance to the ground level and provide a much better possibility to ID suspects. Since the cameras cover a continuous area it is sometimes possible to follow a criminal event backwards or forwards in time to a location where a camera can be used to identify perpetrators. In practice this will however mostly be done for serious crimes that are given sufficient investigative resources. Based on this we expect any difference to clearance rates associated with the introduction of CCTV to be larger for serious crimes such as robberies or aggravated assaults as opposed to crimes such as bicycle theft or vandalism.
Methods
The present study is a short-term follow-up of changes to crime and crime clearances in three areas where CCTV was installed during 2018. The three CCTV locations comprise continuous areas around central squares with businesses and services in three vulnerable neighbourhoods. Crime and crime clearance is followed from 2016 to 2018, with the focus being on any changes taking place after CCTV was installed (January 29, 2018 and April 23, 2018) relative to similar control areas. Below we will detail the methods used. For the analysis ARCMap, excel and R with Rstudio was used.
Data
Crime data was requested from the Gothenburg police for three police districts 2016–2018. The three police districts comprise the one where the CCTV was installed in 2018 (the Northeastern district) and the two other police districts of Gothenburg which have neighbourhoods that are labelled as vulnerable by the national police (South district and Hisingen district). Data was requested for crimes that take place in public settings that plausibly could be impacted by the surveillance: Theft from motor vehicle; Bicycle theft; Vandalism against government property; Graffiti, Personal robbery (including purse snatching), Assault in public environment, and Arson.
The data totalled 43 384 crimes over 39 514 incidentsFootnote2 across the full extent of the police districts. The 39 514 incidents comprised 3890 public environment assaults, 1763 robberies, 6577 bike thefts, 14,296 theft from motor vehicle, 16,681 vandalism and 322 cases of ‘homicidal arson’.Footnote3 The request was for vandalism through arson, but unfortunately, the data delivered was for the more serious version ‘homicidal arson’. It has been included in vandalism in the main models since only 20 cases were reported across the control and treatment areas for the entire period, but it should be noted that it is a far more serious crime than the other crimes coded as vandalism.
For each crime the police district, street, coordinate, crime code, date and whether there was a suspect in the case was provided. The geocoding is done automatically by the police IT systems, and the police excluded incidents that could not be geocoded. As noted on prior research for Swedish crime data the locations will not be completely accurate, but the error is mostly random from a spatial point of view so should not have a systematic impact on results (M. Gerell, Citation2018).
The only other data source used in the present paper is the boundaries of deprived neighbourhoods (as recorded by the national police) and the camera surveillance areas (as recorded by the Gothenburg police). According to Swedish law, the police need to get permission to use CCTV, and in the application for permission they draw up the areas that are visible with CCTV, taking buildings and other obstructing objects into account. The boundaries of CCTV monitored areas were re-drawn from that material as shapefiles using ARCMap. The police was unable to provide other documentation of when the cameras were activated and/or installation begun, and thus the date of decision from the CCTV application was used to define treatment time.
Research design
The CCTV to be studied have been installed in central areas of three deprived neighbourhoods where criminal networks have an impact the local community, which Swedish police label vulnerable neighbourhoods. As such, the present study will compare changes in crime and crime clearance of those locations with similar locations elsewhere in the city of Gothenburg. There are six additional vulnerable neighbourhoods in the city of Gothenburg, three in the northeastern district where the CCTV was installed, two in the Hisingen district and one in the southern district. As only small parts of the treatment neighbourhoods, in essence the most central parts where a large share of the services are located, are covered by CCTV it was necessary to identify similar locations in the other vulnerable neighbourhoods to use as control areas. This will be discussed below.
We study two main outcomes in this study. In the first step, we consider if crime changed at treatment locations relative to control locations after the introduction of CCTV using the weighted displacement difference (WDD) test (Wheeler & Ratcliffe, Citation2018). WDD compares the total change at locations with CCTV and the surrounding environment (displacement area) with the change at control areas and their surrounding area to generate a total measurement of change associated. WDD relies on similar counts of crime in the treatment and control areas. In the present study the treatment and control areas are similar on violence, while the control areas have more property crime. The displacement areas were chosen to match with the neighbourhoods, with two of the treatment areas capturing almost the whole corresponding neighbourhood when using a 500-metre buffer. With displacement areas so much bigger, they do however capture more crime. As noted by Wheeler and Ratcliffe (Citation2018) higher counts in the displacement areas do not affect the test statistic, but it does affect the WDD value of the number of crimes in difference. The WDD has therefore been estimated both using the real counts of crime, and a weighted count where the displacement numbers have been indexed to the treatment and control numbers.Footnote4 With the WDD analysis we get an overall view of how crime has changed with the CCTV. We set the before treatment time period to the same length as the after treatment time period, resulting in two different values for the control areas, and for the main results we use the mean of the two.
We also replicate the analysis of Kronkvist et al. (Citation2019) for each of the neighbourhoods separately to get a more nuanced picture of how crime has changed in each of the three neighbourhoods. We estimate relative effect sizes (RES) by comparing the before and after rates (Gill et al., Citation2014) while considering overdispersion based on the model proposed by Farrington et al. (Citation2007). RES is calculated by taking the count of crime before treatment in treatment areas times the count of crime in the after period at control areas divided by after-treatment times before-control. The variance is then used to adjust for overdispersion according to the formula proposed (Farrington et al., Citation2007),Footnote5 and 95% confidence intervals are calculated based on ± 1.96 times the square root of the natural logarithm of the variance. When effect sizes are positive, we also test whether the change was associated with a diffusion of benefits – crime reductions nearby – or a displacement of crime. We do this by calculating the weighted displacement quotient (WDQ) as suggested by Bowers and Johnson (Citation2003). The WDQ is calculated by considering before and after counts of crime in treatment, control and displacement areas and produces a number that gives a summary measurement of displacement- or diffusion effects.Footnote6 For both sets of calculations we use the spreadsheets by Karl Kronkvist (Citation2019).
To further consider changes in crime we also test whether the pre-intervention trends are parallel in order to fit difference in difference regression models.Footnote7 For property crimes the trends are not parallel, but for violence they are, and we therefore also fit difference in difference models which take the full 2016–2018 data into account.
In the second step, we consider if a measure of crime clearance changed in the treatment locations compared to controls. The measure for crime clearance here is not a legal decision, but rather whether the police have any suspect in the case or not. On average, this should increase in locations where CCTV footage is readily available to facilitate identification of suspects. We expect such a difference to be greater for crimes that are more serious since they are more likely to have the footage properly considered as part of the investigation. We use chi square tests to consider if any changes are significant.
While we have data for 2016–2018, our main effects estimates will be based on a comparison of the parts of 2018 with CCTV in each treatment area and the same period in 2017. For two of the treatment areas we thus compared January 29th to December 31st of 2018 with the same dates in 2017, and for the third treatment area the time period is from April 23rd to December 31st. In the difference in difference models we however make use of the whole time period which gives better statistical power.
Identification of appropriate control areas
Swedish police publish analysis on neighbourhoods they consider having problems with criminal networks impacting on local communities and label such neighbourhoods vulnerable. Such neighbourhoods are characterized by local gangs that typically sell drugs openly and engage in violence, extortion and threats. The neighbourhoods tend to be poor, and with much higher levels of fear among residents than in other residential neighbourhoods (Brå, Citation2017; Polisen, Citation2017, Citation2019). Since these neighbourhoods differ a lot from many other locations, we compare changes in the three CCTV neighbourhoods to the other six vulnerable neighbourhoods in the city.
But the whole neighbourhoods are not covered by CCTV, rather it is the central squares with businesses and services and some areas surrounding it. To identify similar locations in the control areas all vulnerable neighbourhoods in the city of Gothenburg were visited on November 11 and 12 of 2019. The presence of different services and businesses in each neighbourhood centre was catalogued to establish how to draw the control areas. This is not to be considered a perfect count of services and facilities, but rather as an estimate to give an idea of the amount of services, and how they are placed in the physical environment. This was done to understand which locations that are similar to the CCTV monitored areas in order to generate appropriate control areas.
For each location, typically around a named square, the number of physical spaces for three different types of services was identified through visual inspections of signage and similar. Based on the site visits control areas were drawn for the central parts of each neighbourhood to cover the locations where most services are located, similarly to how the CCTV have been positioned in the three neighbourhoods of interest (see ). The control areas were drawn based on buildings with an aim to cover a similarly sized area as the treatment areas.
Figure 1. Treatment (light grey) and control (dark grey) areas, with displacement areas in same shade and vulnerable neighborhoods in black.
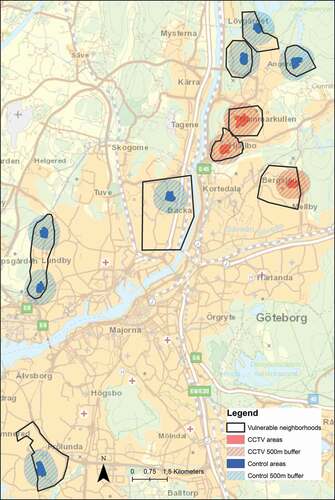
Of the three neighbourhoods with CCTV monitoring, two are almost entirely covered by a 500-metre buffer around the CCTV, and this was therefore considered a reasonable displacement area. The third, Bergsjön, is only partially covered by the buffer, and have two squares that are outside of the 500-metre buffer. For our preferred specification based on the observations outlined above, we thus use seven squares of vulnerable neighbourhoods as main control areas, and a 500-metre buffer around each treatment and control area as displacement areas.
Results
Across the total study period, 2016–2018, 1414 crimes were reported in the treatment and control areas. As shown in , the most common crime type was vandalism/arson, followed by public environment assault and theft from car. This was a fairly constant pattern across the different locations, with some differences. The treatment areas have on average 145 reported crimes, as compared to 119 for the control areas. The difference is mainly made up of higher counts of violent crime, with a mean of 34 assaults and 13 robberies at the treatment locations compared to just 15 and 8 respectively for the control areas. This means that the treatment areas are not entirely comparable with the control areas, but they at least share three characteristics that arguably means they are reasonable; same city, same type of neighbourhood, and same type of location within the neighbourhoods.
Table 1. Summary statistics, reported crimes per location 2016-2018
For the main estimate, we use the relative change of crime at treatment areas to control areas after CCTV was installed. As we have two different treatment times we use the mean of these two time periods for control areas to yield an overall measure. This gives a reasonable estimate for the average effect on crime across the three treatment areas. shows the relative changes to crime in treatment areas after CCTV was installed compared to the control areas. Violent crime is significantly down, while both property crime and total crime is non-significantly up.
Table 2. Crime in treatment areas, control areas and displacement areas before and after CCTV. Control areas are the mean for two control/treatment times
To replicate the analysis of Kronkvist et al. (Citation2019) we also estimate relative changes and weighted displacement quotients (WDQ) for each neighbourhood separately. In Hjällbo, crime has increased relative to controls for both property crime and violent crime. The increase is significant for property crime and total crime. Property crime increased in the displacement area as well, while violence was down slightly. This would suggest a negative effect of the CCTV (Appendix ). In Bergsjön, property crime and total crime has increased relative to controls. Violent crime has decreased but increased in nearby areas and with a negative WDQ that suggests the violence was displaced to nearby locations. No change is however significant (Appendix ). In Hammarkullen, crime has dropped both in the treatment area and in the displacement area, with WDQ values near one, which indicates a positive, but minor, diffusion of benefit. The drop is not significant for violence but is significant for property crime and total crime (Appendix ).
While it is possible that the CCTV has different effects in each neighbourhood, a more plausible hypothesis is that this mostly is driven by random noise and/or other factors that influence crime, which highlights the difficulty of drawing conclusions from low-powered studies. The pooled findings from the WDD analysis has better power and suggests that violence has dropped somewhat with the introduction of CCTV in the neighbourhoods.
The above method uses the same time period of the prior year as comparison, and while this is reasonable, it means that we lose statistical power by not having the full 2016–2018 data, in addition to not having any controls for prior trends. To further explore the impact of CCTV on crime in the treated neighbourhoods we therefore move on to consider monthly rates with a Difference in Difference (DiD) model. The CCTV was introduced in the end of January and April, so we consider the treatment time periods to start in February and May. There are no parallel trends for property crime or total crime, so only violent crime is appropriate for a difference in difference analysis. While it is possible to fit DiD models in spite of violation of the parallel trends assumption (Mora & Reggio, Citation2012), it will generate biases, and in this case the growth of the trends (the derivate of the trend) differ as well. shows the monthly violent crime for treatment and control areas.
Figure 2. Monthly violent crime counts in treatment and control areas, with trendline for the pre-CCTV time period.
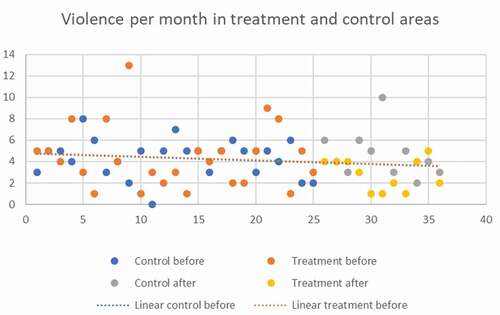
Both the intercept and the slope are near identical for pre-CCTV violence, making it a great candidate for a difference in difference.
Since we have two different treatment times, we estimate the DiD regressions using both cut offs to estimate the models. The results for the difference in difference regression is shown in appendix and appendix Table 5. The results are very similar for the two different time cut-offs. There are more violent crimes in the treatment areas, but no significant general time trend. The difference in difference coefficient is negative (−.6 and −.7) significant (p =.03 and p = .02) in both cases, and we can therefore conclude that the CCTV was associated with a reduction of about .6 violent crime events per area and month. For the whole time period this results in an estimated reduction of 19 violent crimes associated with the CCTV. While this is a positive finding, it should be noted that this to some extent is driven by a single month. In July of 2018 there were 10 violent crimes in the control areas, and only 1 in the treatment areas.
Crime clearance
Next, we turn to crime clearance, and we begin by considering the relative rate to which the police have an identified suspect by having CCTV installed or not. shows descriptives for the whole 2016–2018 time period with the share of crimes that were cleared for the different crime types and for different types of geography. The final row shows the clearance rates for the CCTV monitored areas after CCTV was installed. It should be noted that the number of cleared crimes tend to be very low, so for instance, the 5% cleared in CCTV-treated areas for theft from motor vehicle corresponds to one crime cleared out of 20 committed. Comparing the final two rows gives a first indication as to whether the introduction of CCTV is associated with increased crime clearance. There is a slightly higher clearance rate in the treatment areas after CCTV was introduced, driven by higher clearance for assaults and the one cleared theft from motor vehicle.
Table 3. Clearance rates for crimes at different times and locations
To explore the changes in clearance associated with CCTV further we will now focus only on same length time periods for control and treatment times. Since treatment times start at January 29th and April 23rd in 2018 for our experiment areas, we will employ the same time periods in 2017 as control times. This results in almost half the crimes being dropped, with 717 crimes committed in treatment and control areas between the 30th of January 2017 and the 31st of December in 2017 and 2018.
We will compare change in treatment areas compared to change in the control areas for the same time period, done in two separate analyses since we have two different treatment times. We will only consider the full property and violent crime categories as there are few crimes cleared.
shows the clearance rate for total, violent and property crime broken down to before and after CCTV was installed in treatment and control areas. Two different time periods for the control areas are tested, corresponding to the two different times of CCTV installation. The final column shows the relative improvement in treatment areas after CCTV was introduced compared to the control areas. The values are positive everywhere, though it is hard to draw any conclusions for property crime considering the very low clearance rate and thus very low N. For violent crime, the increase is 8 percentage points higher clearance associated with the CCTV in Bergsjön and Hjällbo, and 16 percentage points in Hammarkullen. No change in clearance rate is significant using a chi square test. Note that since the relative distribution of crime has changed, and the clearance rate is much higher for violence, this means that the total column does not add up to a mean of the property crime and violent crime column.
Table 4. Clearance rates at treatment and control areas before and after CCTV
The relative increase in clearance for property crimes consist of two things. The first factor is the clearance of one theft from motor vehicle. In the treatment there was one such crime cleared after CCTV was installed, and none before. The second factor is that the control areas have a reduced clearance rate in the treatment time. This too is however just a handful less crimes solved, and overall it is very difficult to draw any conclusions from the changes in clearance of property crime. For violence crime the differences are more substantial, but there are too few cases for any change to reach significance in a chi square test.
Discussion
The present paper analyses the short-term effects of CCTV that was introduced into three deprived neighbourhoods in the Swedish city of Gothenburg in 2018. It finds that the introduction of CCTV was associated with a reduction in violence, but no significant change to property crime, nor to crime clearance.
In general, property crime tends to be reduced by CCTV, but not violent crime (Piza et al., Citation2019). In this study the direction of change, while to a varying degree significant, is for violence to be reduced but not property crime. This is similar to the findings by Kronkvist et al. (Citation2019) who also studied a vulnerable neighbourhood in Sweden.Footnote8 This points to the possibility that CCTV has a different impact on vulnerable neighbourhoods in Sweden than what has been found for CCTV in residential areas in international research (Piza et al., Citation2019). A potential mechanism is that the CCTV can improve the police work against narcotics dealing, thus displacing some of the criminal networks that deal drugs. Since the same criminal networks also are responsible for a fair share of the public violence, in addition to some violence potentially being directly linked to drug dealing, this then leads to reduced violence. Kronkvist et al. (Citation2019) suggested this type of mechanism, and the police in the neighbourhoods covered in the present study have highlighted similar ideas (Thorén & Tolsheden, Citation2019).
Regarding crime clearance, indications of positive effects are noted, but no change is significant. Relative to control areas the share of crimes with a recorded suspect increased after the introduction of CCTV in the treatment areas. In practice this was mostly driven by violent crime, as property crimes have very low clearance rates making any interpretation of the results difficult. For violence, the clearance rates increased 8–16 percentage points. If we assume that the effects identified indeed represent some sort of true value of the CCTV for investigations into robberies and assaults, it means that about three more violent crimes were cleared with the introduction of 28 new CCTV cameras. Re-calculated to a total yearly rate this would be about four more crimes cleared, and although these are serious crimes it is unclear whether the investigative improvements can motivate the cost.
An interesting finding comes from the disaggregated results. The change in crime in the three neighbourhoods differs a lot. While not all the changes here are significant, some are, and as a point of discussion, it is interesting to consider the heterogeneous change in crime across the treatment areas. One neighbourhood saw both property and violent crime drop substantially, alongside a notable drop in the buffer area. Taken by itself this would appear to suggest that CCTV in that neighbourhood was effective, and that its effect spread outside of the monitored area. Another neighbourhood saw smaller decreases in crime, but relative to controls a clear drop in violence. That decrease in violence was however met with a similar increase in violence in the buffer area. If interpreted as a true effect the findings from that neighbourhood would thus suggest the CCTV displaced some violence to nearby locations. The third neighbourhood saw relative increases in both violence and property crime and increases in the buffer area as well. Taken by itself this would suggest that the CCTV increased crime. While we cannot rule out that the CCTV in fact had very heterogeneous effects in the three neighbourhoods, a more plausible explanation is that the CCTV had a minor impact and that other factors – and/or random fluctuation – are driving changes in crime. This shows the pitfall of using single cases, especially when statistical power is low. In the present paper this means that single-site results should be interpreted with great caution as random noise can have a great impact. For the full analysis of the combined change for the locations of the 28 camera points the power is better, but more studies are needed to ascertain whether the results hold. The main analysis for this paper would not have been able to detect a reduction of the magnitude found for CCTV in residential areas by Piza et al. (Citation2019), which was about 12%. The fact that the reduction in violence was significant in this study is because it was substantially higher, 35%. As argued by Kronkvist et al. (Citation2019) there is a need for bigger studies that can show effects of CCTV on crime across different contexts and environments. In Sweden it would be plausible to do so using all the police run CCTV in the country since Sweden now only has one police authority.
Conclusion
This study finds that police reported violence decreased where CCTV was introduced relative to controls. Property crime and crime clearance are not noted for any significant change. This paper has several limitations, the most severe of which comes from the short time period studied which means low power and which in turn means that many of the changes studied are non-significant. While this means that any findings need to be interpreted with caution, the results are in line with previous findings on CCTV from Sweden. The only other paper considering CCTV in a deprived neighbourhood found similar directions of change, but non-significantly so for violence (Kronkvist et al., Citation2019).
For crime clearance, there are no significant changes, but all coefficients are positive. If we generously interpret the non-significant changes to clearance as real, they still point to a low number of crime clearances associated with the CCTV. This is in line with the findings from the National council for crime prevention which found that CCTV indeed can be of great importance in trials, but rarely is (BRÅ, Citation2015a). Arguably, there is room for improvement here, as the CCTV should be a usable tool for crime clearance, but apparently is not being very impactful. This is particularly true for property crimes, which has a very low clearance rate. The police can, and should, develop their use of CCTV to make sure it is a cost-effective investment. Based on the current study the CCTV does not appear to add very much to crime clearance, and whether it is cost-effective thus mostly becomes an issue of how to value the reduction in violence associated with the CCTV in the three studied neighbourhoods.
Furthermore, it would be helpful for future evaluations if police kept better documentation of when the CCTV is activated, when it is not functioning and similar. Currently the police, at least locally, appear to lack good documentation, making it harder to follow any effects the CCTV can have. As it seems CCTV will continue to grow, both in Sweden and internationally, efforts should be taken to make sure the CCTV is used in a way that makes sure it is worth the investment. This needs to be balanced with integrity concerns too, and much work remains to be done on the topic.
Disclosure statement
No potential conflict of interest was reported by the author.
Additional information
Funding
Notes
1. It could also be argued to be of the type housing, or even city centre, but residential areas appear to be the best match.
2. The higher count for crimes is due to cases where for instance, an assault against two persons could be coded as one crime incident with two crimes. On average there was 1.1 crimes recorded per incident.
3. The measure of arson is labelled ‘homicidal arson’ in Swedish penal code, implying that it is a case of arson where lives were possibly at stake.
4. Weighted displacement = Displacement * (Treatment+Contro)/(Pre-displacement + Pre-control-displacement)
5. The variance is calculated from the natural logarithm of the odds ratio, Variance of natural logarithm of odds ratio = 1/Treatment before + 1/Treatment after + 1/Control before + 1/Control after
6. WDQ = ((Displacement after/Control after) – (Displacement before/Control Before))/((Treatment after/Control after) – (Treatment before/Control before))
7. The DiD is run with a basic OLS on a dummy for the treatment time period, a dummy for the treatment areas, and a dummy for time*area.
8. When we model this using the same method as Kronkvist et al. (Citation2019), we find non-significant decreases of violence just as they did in their study. Pooling the two studies together in a form of mini-meta fails to achieve significance as well, it results in a RES of 1.64, but the confidence interval includes one (0.98–2.74)
References
- Ashby, M. P. (2017). The Value of CCTV Surveillance Cameras as an Investigative Tool: An Empirical Analysis. European Journal on Criminal Policy and Research, 23(3), 441–459.
- Bowers, K. J., & Johnson, S. D. (2003). Measuring the geographical displacement and diffusion of benefit effects of crime prevention activity. Journal of Quantitative Criminology, 19(3), 275–301. https://doi.org/https://doi.org/10.1023/A:1024909009240
- Brå. (2015a). Kameraövervakning på Stureplan och Medborgarplatsen. Slutrapport. Brå-rapport 2015: 21. Brottsförebyggande rådet, Stockholm. https://www.bra.se/download/18.31d7fffa1504bbffea0bcbc5/1453448148899/2015_21_Kamera%C3%B6vervakning_p%C3%A5_Stureplan_och_Medborgarplasten.pdf
- Brå. (2015b). Skjutningar 2006 och 2014 – Omfattning, spridning och skador. BRÅ, Kortanalys 7/2015. Brottsförebyggande rådet, Stockholm.
- Brå. (2017). Utveckling i socialt utsatta områden i urban miljö. Analys från nationella trygghetsundersökningen. Brå-rapport 2017: 7. Brottsförebyggande rådet, Stockholm.
- Coupe, T., & Kaur, S. (2005). The role of alarms and CCTV in detecting non-residential burglary. Security Journal, 18(2), 53–72. https://doi.org/https://doi.org/10.1057/palgrave.sj.8340198
- Dowling, C., Morgan, A., Gannoni, A., & Jorna, P. (2019). How do police use CCTV footage in criminal investigations? Trends and Issues in Crime and Criminal Justice, 575, 1.
- Farrington, D. P., Gill, M., Waples, S. J., & Argomaniz, J. (2007). The effects of closed-circuit television on crime: Meta-analysis of an English national quasi-experimental multi-site evaluation. Journal of Experimental Criminology, 3(1), 21–38. https://doi.org/https://doi.org/10.1007/s11292-007-9024-2
- Gerell, M. (2016). Hot spot policing with actively monitored CCTV cameras: Does it reduce assaults in public places? International Criminal Justice Review, 26(2), 187–201. https://doi.org/https://doi.org/10.1177/1057567716639098
- Gerell, M. (2017). Collective efficacy and arson: The case of Malmö. Journal of Scandinavian Studies in Criminology and Crime Prevention, 18(1), 35–51. https://doi.org/https://doi.org/10.1080/14043858.2017.1298172
- Gerell, M. (2018). Quantifying the Geographical (Un) reliability of police data. Nordisk Politiforskning, 5(2), 157–171. https://doi.org/https://doi.org/10.18261/issn.1894-8693-2018-02-05
- Gill, C., Weisburd, D., Telep, C. W., Vitter, Z., & Bennett, T. (2014). Community-oriented policing to reduce crime, disorder and fear and increase satisfaction and legitimacy among citizens: A systematic review. Journal of Experimental Criminology, 10(4), 399–428. https://doi.org/https://doi.org/10.1007/s11292-014-9210-y
- Gill, M., & Spriggs, A. (2005). Assessing the impact of CCTV. Home Office Research, Development and Statistics Directorate.
- Honovich, J. (2008). Is Public CCTV Effective? IPVM. Retrieved November 5, 2019, from http://ipvm.com/reports/is-public-cctv-effective.
- Jung, Y., & Wheeler, A. (2019). The effect of public surveillance cameras on crime clearance rates. Socarxiv. https://osf.io/preprints/socarxiv/eh5bg/
- Kronkvist, K. (2019). Relative Effect Size and Weighted Displacement Quotient spreadsheet.
- Kronkvist, K., Nordqvist, S., & Ivert, A. K. (2019). Kamerabevakning i ett särskilt utsatt bostadsområde: Uppfattningar, erfarenheter och effekter av polisiär kamerabevakning med syfte att minska brottsligheten och öka tryggheten. Malmö Universitet, Institutionen för Kriminologi.
- Malmberg, B., Andersson, E., & Östh, J. (2013). Segregation and urban unrest in Sweden. Urban Geography, 34(7), 1031–1046. https://doi.org/https://doi.org/10.1080/02723638.2013.799370
- Mora, R., & Reggio, I. 2012. Treatment effect identification using alternative parallel assumptions. Working Paper 12-33. Universidad Carlos III de Madrid. http://hdl.handle.net/10016/16065.
- Morgan, A., & Coughlan, M. (2018). Police use of CCTV on the rail network. Trends and Issues in Crime and Criminal Justice, (561), 1. https://search.informit.com.au/documentSummary;dn=983683209203954;res=IELHSS
- Morgan, A., & Dowling, C. (2019). Does CCTV help police solve crime? Trends and Issues in Crime and Criminal Justice, 576, 1. https://search.informit.com.au/documentSummary;dn=336908458136101;res=IELAPA
- Piza, E. L. (2018). The history, policy implications, and knowledge gaps of the CCTV literature: Insights for the development of body-worn video camera research. International Criminal Justice Review, 1057567718759583. https://doi.org/https://doi.org/10.1177/1057567718759583
- Piza, E. L., Caplan, J. M., & Kennedy, L. W. (2014). Is the punishment more certain? An analysis of CCTV detections and enforcement. Justice Quarterly, 31(6), 1015–1043. https://doi.org/https://doi.org/10.1080/07418825.2012.723034
- Piza, E. L., Welsh, B. C., Farrington, D. P., & Thomas, A. L. (2019). CCTV surveillance for crime prevention: A 40‐year systematic review with meta‐analysis. Criminology & Public Policy, 18(1), 135–159. https://doi.org/https://doi.org/10.1111/1745-9133.12419
- Polisen. (2017) . Utsatta områden – Social ordning, kriminell struktur och utmaningar för polisen. Nationella Operativa Avdelningen.
- Polisen. (2019) . Kriminell påverkan i lokalsamhället. En lägesbild för utvecklingen i utsatta områden. Nationella Operativa Avdelningen.
- Polisen. (unknown). Polisens råd rörande kameraövervakningssystem. Polisen, Sverige. https://nfc.polisen.se/siteassets/dokument/informationsmaterial/kameraovervakning/kameraovervakning—polisens-rad.pdf
- Priks, M. (2014). Do surveillance cameras affect unruly behavior? A close look at grandstands. The Scandinavian Journal of Economics, 116(4), 1160–1179. https://doi.org/https://doi.org/10.1111/sjoe.12075
- Priks, M. (2015). The effects of surveillance cameras on crime: Evidence from the Stockholm subway. The Economic Journal, 125(588), F289–F305. https://doi.org/https://doi.org/10.1111/ecoj.12327
- Regeringen. (2019). Regeringen underlättar för kamerabevakning i brottsbekämpningen. Regeringen, Stockholm. https://www.regeringen.se/pressmeddelanden/2019/05/regeringen-underlattar-for-kamerabevakning-i-brottsbekampningen/
- Sturup, J., Gerell, M., & Rostami, A. (2019a). Explosive violence: A near-repeat study of hand grenade detonations and shootings in urban Sweden. European Journal of Criminology, 1477370818820656. https://doi.org/https://doi.org/10.1177/1477370818820656
- Sturup, J., Rostami, A., Mondani, H., Gerell, M., Sarnecki, J., & Edling, C. (2019b). Increased gun violence among young males in Sweden: A descriptive national survey and international comparison. European Journal on Criminal Policy and Research, 25(4), 365–378. https://doi.org/https://doi.org/10.1007/s10610-018-9387-0
- Thorén, T., & Tolsheden, I. (2019). Gatuvåldet i nordöstra Göteborg. En skildring av våldsbrottsutvecklingen I LPO Storgöteborg nordost 2014-2018. Kandidatuppsats i kriminologi, Malmö Universitet.
- Wheeler, A. P., & Ratcliffe, J. H. (2018). A simple weighted displacement difference test to evaluate place based crime interventions. Crime Science, 7(1), 11. https://doi.org/https://doi.org/10.1186/s40163-018-0085-5
Appendix
Table A1. Crime before and after CCTV in Hjällbo treatment area, displacement area and control areas
Table A2.
Crime before and after CCTV in Bergsjön treatment area, displacement area and control areas
Table A3.
Crime before and after CCTV in Hammarkullen treatment area, displacement area and control areas
Table A4.
Difference in difference regression estimate for violent crime considering treatment period to start in February 2018
Table A5.
Difference in difference regression estimate for violent crime considering treatment period to start in May 2018