
ABSTRACT
The objective of this article is to assess whether, how and why young people’s safety perceptions vary along the trip. Informed by principles of environmental criminology, this study makes use of a dataset recently collected among young riders of public transportation (1,122 university students) in Stockholm, Sweden. Geographical Information Systems (GIS) and logistic regression models underlie the methodology of the study. Findings indicate that safety perceptions of young riders are affected by previous experience of sexual crimes but are not affected by overall victimization. More importantly, being exposed to high crime environments on the way to the metro significantly reduces young people’s safety perceptions (but not on the way to bus stops), especially for men. Drunk people tend to affect women’s safety perceptions, especially in bus systems. The article finishes by discussing the implications of the results for future research and helps advocate more inclusion of young people’s safety needs when implementing safety and transportation policies.
Introduction
The majority of the victims of sexual crimes and assaults on public transportation are young people (Beller et al., Citation1980; Tripathi et al., Citation2017). They also constitute the most active segments of the population having special daily and nocturnal routine activities, often relying more extensively on public transportation than many other groups of travellers (Ceccato & Loukaitou-Sideris, Citation2020). Mobility patterns differ among young people and so do their victimization and safety needs during their journeys, from home to university, work and recreation (Natarajan et al., Citation2017).
Gender is an important factor that affects both mobility and safety (Dunckel Graglia, Citation2016; Kalpana & Surabhi Tandon, Citation2007; Law, Citation1999; Loukaitou-Sideris & Fink, Citation2008; Lubitow et al., Citation2020; Mellgren et al., Citation2018; Moreira & Ceccato, Citation2021; Whitzman, Citation2007). The #MeToo! Movement has helped to reveal that a particular hindrance to young women’s mobility is their fear of sexual harassment while travelling, especially when using public transport. Yet, research has been lacking on safety among young people along the trip (but see Wiebe et al. (Citation2014)) as well as on how and why it varies by types of public transportation and on the way to transportation (but see Evans, Citation2009; Natarajan et al., Citation2017).
The present study aims to improve understanding of the safety perceptions of university students onboard or on the way to or from bus stops or train stations. We first investigate whether and how young people’s perception of safety varies along the trip in relation to a series of crimes, but with particular focus on the impact of sexual crimes, within the spectrum of sexual harassment. Then, we adopt a door-to-door approach to safety (‘whole journey’ approach) to be able to assess the impact on young people’s safety perceptions of the conditions experienced at these transport nodes and on the way to them. Sexual harassment is a multifaceted phenomenon that encompasses a variety of sexual behaviours that may vary along the trip. For instance, the environments in train carriages or buses may promote physical sexual violence/abuse, such as groping or kissing. At the station or bus stop or on the way to them may be places where nonverbal sexual violence/abuse, such as stalking or exhibitionism, more often occurs. Finally, there is also verbal sexual violence/abuse, such as sexual comments, jeering or taunting and asking questions about sexual activity.
Informed by principles of environmental criminology, this study makes use of a dataset recently collected among young riders of public transportation (1,122 university students) in Stockholm, Sweden. University students are our focus because they are more similar to each other in age than the general population, and this allows researchers to easily control for some factors in the analysis and to compare patterns of transit use and safety perceptions among students. Geographical Information Systems (GIS) and logistic regression models underlie the methodology of the study.
This article is composed of six sections. First, the literature on crime and safety perceptions in transit environments is presented; then, the current study and research questions in section three are framed, followed by the results and a discussion in sections four and five. The article ends with conclusions and recommendations for research and policy in section 6.
Safety perceptions in transit environments: brief literature review
Basic definitions
Public transportation – is the term that captures what North American readers often call ‘public transit’, ‘mass transit’ or ‘rapid transit’ systems (Newton, Citation2014, p. 709), and in this study it is used to describe young people’s use of buses, trains, the metro and trams that are available to the public, charge set fares and run on fixed routes.
Safety – Safety is a construct with a fluid definition. Some disciplines refer to safety as a subjective feeling (i.e., related to the perceived risk) whereas others consider it as the opposite of actual risk (i.e., safe is something that is non-criminogenic). In this study, we use ‘ safety’ or ‘safe’ to refer both to a non-criminogenic bus stop (as perceived by individual respondents) and/or to the expression of safety by a young person who declares feeling free from the fear of being at risk of crime, not necessarily because the risk of crime is low, but because that particular environment provides signs that make the person feels safe (even when the risk of victimization is high). This definition is based on empirical findings in transit environments that reveal ‘a mismatch’ between perceived environmental cues and risk of victimization (e.g., Ceccato, Citation2013). This evidence indicates the need to consider safety in a wide spectrum of conditions: From transit environments of high risk of victimization but perceived by users as safe to places of low risk of victimization but perceived by them as unsafe. The potential reasons causing this mismatch are considered elsewhere in the literature, see, for example (Gray et al., Citation2008; Pain, Citation1997).
Safety perception – is used here to refer to young people’s report on levels of fear and/or actual risks or feelings affected by other overall anxieties while in transit environments (Loewen et al., Citation1993; Sani et al., Citation2020).
Transit safety – in this study is used more often to indicate young people’s declared safety perceptions along the trip (in train carriages, buses), on transport nodes (bus stops, train or metro stations) or on the way to them, in the immediate transport node’s surroundings (Loukaitou-Sideris et al., Citation2002).
Fear – is ‘an emotion, a feeling of alarm or dread caused by expectation of danger’ (Warr, Citation2000, p. 453).
How an individual perceives transit environments (and may experience fear) depends on its individual characteristics (age, gender, previous victimization) as well as the attributes of these environments (type of station and quality of the environments they spend time in from their home to a train station) and their contexts. While understanding the factors that influence an individual’s safety perceptions is crucial, it is also important to consider the ways by which environmental factors affect safety along the trip. Below, we discuss how these factors affect safety perceptions in transport nodes and/or along the trip, door-to-door.
Individual factors affecting transit safety
While young people are statistically more at risk of being victimized, older and/or disabled individuals tend to be more fearful (Furstenberg, Citation1971; Lagrange & Ferraro, Citation1989). This mismatch between victimization and fear is useful for exemplifying the complexity of fear. Fear may vary over the time of day, between weekdays and weekends, or during different seasons. Scholars have found that transit riders feel less safe in certain environments along the trip, particularly after dark (Smith & Cornish, Citation2012). Previous research also indicates that fear intensifies after dark most likely because more violent crimes happen during the evening/night at transportation nodes when guardianship is poor and settings are empty (Yavuz and Welch (Citation2010). Therefore, it could be expected that university students in Stockholm would declare feeling safer (less fearful) during the day than in the evening and night.
Women, older adults, members of ethnic minority groups, those who belong to the LGBTQI community, those with disabilities and those who are economically disadvantaged report higher levels of fear of crime than the rest of the population (Box et al., Citation1988; Garofalo & Laub, Citation1979; Mellgren et al., Citation2018; Pain & Smith, Citation2008). Other individual factors that also affect safety perceptions are, for instance, frequency of use of public transportation (which leads to more or less familiarity with a particular environment) and disability (Iudici, Citation2015; Iudici et al., Citation2017). In Sweden, Johansson et al. (Citation2012, p. 69) explored gender differences regarding threats people face when moving in public space and found that boys and girls seem to cope with social risks by behaving opposite to the expected gendered norms. In this particular case, the examples were: ‘boys being non-aggressive and girls by acting confidently’. ‘Boys portray themselves as level-headed, skilled and making rational risk assessments. Girls sometimes described themselves as behaving in an unsafe way in traffic, but not in relation to social/sexual threats. In addition, Cops et al. (Citation2012) found that young people who worry about their personal future showed higher levels of fear of crime compared with young people who are optimistic about their future and surprisingly, victimization had no significant impact on fear of crime.
Despite of these findings, scholars have indicated that previous victimization continues to be an important determinant of fear and/or safety perceptions (Hale, Citation1996; Hirtenlehner & Farrall, Citation2014; Otis, Citation2007; Yates & Ceccato, Citation2020). Witnessing other people’s victimization (particularly a family member or friend) also affects an individual’s level of personal safety (for a review, see e g. Skogan, Citation1987). The seriousness of the crime is also relevant to measure its impact (Jackson & Gouseti, Citation2012). Mellgren et al. (Citation2018) show that sexual harassment in the Swedish municipality of Malmö has a major impact on safety perceptions of Swedish female university students. They found that victimization often occurred at clubs or restaurants, and the most frequently reported consequences were anger and worry about being victimized again. It is expected that female university students are more likely to be victimized in public transportation in Stockholm than males, particularly by sexual crimes – therefore gender and previous victimization are expected to affect their safety perceptions.
Transit environments affecting safety perceptions
The interior design of buses and trains as well as the physical and social environment of transport nodes, such as bus stops or train stations, as well as the way to or from them, all have an impact on how we perceive these transit environments (Abenoza et al., Citation2018; Liggett et al., Citation2001). Scholars have long suggested that fear of crime goes beyond buildings and streets and may be a reflection of the state of the community as well as the meaning attached to an environment at a particular time. For instance, mechanisms linking visible deterioration to poor safety perceptions can be likened to Wilson and Kelling’s broken window syndrome (Wilson & Kelling, Citation1982), which suggests that unrepaired damage to property encourages further vandalism and other types of crimes. As Skogan (Citation1996) suggests, this is not only because signs of physical deterioration are often visible but also because they capture a much broader range of underlying (non-visible) problems. Signs that nobody is in control of a particular environment – abandoned buildings, litter, vandalism and loitering – are thought to lead to safety perceptions and overall anxieties (Lewis & Maxfield, Citation1980). Poorly maintained transport environments are often linked to ‘dysfunctional fear’ (Jackson & Gouseti, Citation2014), which in turn negatively affects people’s mobility and health (Branas et al., Citation2011). Therefore it is expected that university students would express lower safety perceptions in poorly maintained stations (showing signs that ‘nobody is in control’) than in those that are well maintained.
Safety perceptions and the whole journey approach
Identifying individual and place-based environmental factors that affect young people’s safety perceptions is important, but equally relevant is to track safety along the trip. In one of the first empirical studies of this kind, Natarajan et al. (Citation2017), informed by a ‘whole journey’ approach (that includes walking to and from the bus/metro stops as well as waiting for and riding on the bus or metro), show extensive patterns of victimization of young college students in New York City during all stages of female students’ metro commute to and from college. Wiebe et al. (Citation2014) also showed in Philadelphia, Pennsylvania, that perception of safety by children varied significantly during night-time and daytime and along the trip, highest being in a car and lowest on foot or on a metro. However, the context in which the trips occur is also important to determining safety perceptions. For instance, Bromley and Nelson (Citation2002) found significant gender differences in the perceived safety of boys and girls in the city centre environment (e.g., where many transportation nodes are located) but no difference in perceived safety in their home areas. This variation in safety by context and groups was confirmed by Ceccato (Citation2013) in Stockholm, Sweden. Using data from a safety survey and spatial cluster analysis, the author found that women declared being more fearful at bus stops or metro stations in the Western periphery of the city, while for older adults the significant cluster of poor safety was in the inner city areas. In addition, passengers declared feeling more unsafe on the way to or from transport nodes (64%) than in bus stops or trains stations (57%) or in their own neighbourhood (45%). It is hypothesized that young people’s safety perceptions vary along the trip and are affected by the neighbourhood context; for instance, high crime areas are bound to reduce young people’s safety perceptions on the way to or from transport nodes.
Research design
The empirical study examines the following research questions:
How many of the respondents feel unsafe? Do they declare feeling safer during the day than during the night while riding in different transport modes?
Do safety perceptions vary by individual characteristics of the young riders (gender, frequent user)? Does previous victimization affect young people’s safety perceptions and how?
Do young people’s safety perceptions vary along the trip and by transportation mode and gender? Does living in high crime areas affect young people’s safety perceptions?
The case study
Just over 14% of the population of Stockholm is between the ages of 20 and 29 years old.Footnote1 The Stockholm region’s population is estimated at 1.6 million in 2020, while the average age is 38.8 years old. Women tend to use public transport more than men, and young adults (16–24 years old) use public transport to a significantly higher degree than middle-aged people do (40–64 years old). More than 800,000 people travel by public transport each day, with a weekday average of 44 minutes spent on commuting by public transport. There are 268 train stations (metro, light rail, commuter train) and 6,587 bus stops (TSL, Citation2017). In Stockholm, nearly 45% of those who are 24 years old have started university. Therefore, the basis for our study consists of university students because they constitute a significant share of the young population who uses public transport in the city.
This survey was part of a global study on sexual crime in transit environments. The study was carried out in 18 universities in six continents with a minimum sample size of 300 students each city (researchers were encouraged to collect a minimum of 150 surveys from male and 150 from female students). The study focus on review trends in university students’ victimization and safety perceptions across countries.
In Stockholm, after approval by the Swedish Ethical Review Authority, data collection took place between May and June 2018. Note that although the sample of Stockholm was composed of 1,122 university students (three times larger than the expected for the global study), the sample was not representative for the university’s undergraduates and post-graduates (from 10,200 active from the total 13,000 students) (KTH, Citation2019), where 34% were female and 66% were male. Because of the limited degree of generalization, we have used quantitative methods to test exploratory research questions rather than hypotheses. In practice, this means that our findings are not applicable to the general population even within the same city. The opportunities that this exploratory research provided, however, far outweighed the sample limitations.
In our sample, 43% of respondents identified as female, 52% as male, 2% as LGBTQI (lesbian, gay, bisexual, transgender, queer or intersex) and 3% as other, which means that women is slightly overrepresented in our sample. The great majority of the respondents were between 18 and 29 years old and born in Sweden, but 16% of the respondents were older than 29 years and 21% of the respondents were born outside of Sweden. The university is located rather centrally in Stockholm, less than 10 minutes by metro from the central station, and with access to several bus routes and a light rail line. The majority (64%) of the surveyed students used the metro at least four days per week, while 32% used buses at least four days per week.
Methods
The questionnaire consisted of 52 questions. In the first part of the questionnaire, respondents were asked about trips by public transportation, including questions on travel frequency, perceived safety and different concerns related to travelling by public transportation. The first part also contained questions about transit victimization by different types of crime on public transportation (with a focus on sexual violence) and about perceived safety. The questions used in this analysis were:
Do you feel safe when using the metro, tram or commuter train (railbound) after it gets dark?
Do you feel safe walking to/from or waiting for the metro, tram or commuter train on the platform after it gets dark?
Do you feel safe when you take the bus in the evening and at night?
Do you feel safe walking to/from bus stops in the evening and at night?
In the final part of the questionnaire, respondents were asked about individual characteristics (age, gender and place of birth). The data from the survey was transferred from the web-based platform, Crowdsignal, via Excel to the statistical software packages SPSS and SAS in which the analyses were carried out (SAS, Citation2017; SPSS, Citation2018).
A set of variables was excluded after testing bivariate correlation between independent variables (r ≥ .6). For the logistic regression models (a dichotomous independent variable for unsafe = 1 was created), the 5% level of significance was considered, and in the case of a statistically significant result the probability value (p-value) has been provided. The independent variables are composed of individual attributes as well as characteristics of the transport node or of the path to it. Examples of individual attributes are gender, place of birth, trip length, frequency of use of public transportation, whether the respondent had been victimized in the preceding three years, victimization by type, victimization by sexual crime, or if they knew someone who had been exposed to serious crime (aggravated assault, robbery, rape, murder) in the past three years. Among the situational contexts, the models include the area’s crime rate, whether the station is perceived as ‘isolated’, details of the transit environment, either station or bus stop, such as presence of drunk people, settings in need of illumination, police patrolling or CCTV. Isolated station, poor surveillance, and empty station were characteristics that were part of the stations, while CCTV, illumination and police patrolling were not enough or respondents wished for more.
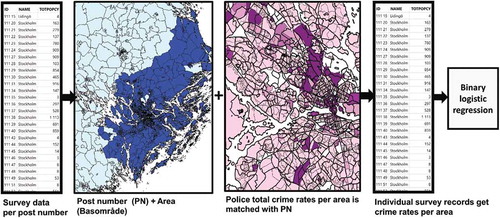
Since we wanted to investigate whether criminogenic environments (where respondents live) influence young people’s perceived safety from home to the station or bus stop, we used Geographical Information Systems (GIS) to map the survey addresses of each respondent to total crime rates by area using postal codes as keys. After matching postal codes with areas (basområde), crime rates were transferred back to each survey/respondent and used in the logistic regression model together with other variables to ‘explain’ the variation in safety perception. illustrates the steps taken when combining crime rates by area with individual answers from the survey using Geographical Information Systems (GIS) as a basis for modelling youth safety.
Figure 1. Steps of combining crime rates by area with individual answers from the survey using Geographical Information Systems (GIS) as a basis for the regression model
Results
Safety perception among young people
More than two-thirds of the respondents from our sample of university students declare feeling ‘always or often’ safe in their journey on public transportation in Stockholm. Only around 2% state that they feel ‘seldom or never safe’ when travelling by bus and 5% for train users (-b)). They feel much safer in buses (76% of the respondents) than they do on the metro and trains (57% of the respondents). This is a consistent pattern throughout day and night, as well as onboard and on the way to or from transportation nodes in Stockholm. A smaller share of women, namely 44% of the female students in the sample declared that they always feel safe in daytime when using metro or when using other types of rail bound transportation compared with 69% of the male students.
Figure 2. Young people’s safety perceptions on (a) metro/train and (b) bus, daytime and night-time, on the bus, at station/bus stop and on the way to/from them – night-time. Sample of university students in Stockholm, 2019
When darkness falls, the experience of travelling by public transport changes, and the safety significantly decreases. Compared to being onboard or waiting for the train, respondents experience the way to or from the station as the most unsafe part of the journey (note that 25% seldom or never feel safe onboard the train, but even more, 32%, seldom or never feel safe on the way to or from the train station). A similar pattern is found for users of buses; it only differs by 3% compared with the train ()).
Previous victimization affects safety perceptions while travellers are in transit. Our study shows that 11% of respondents were victims of crimes, such as thefts or violence. We also asked about a range of sexual violence categories, and 45% declared experiencing different types of sexual violence in the past three years. Sexual violence was categorized as nonverbal, verbal or physical sexual violence. An overview of the sexual violence that female respondents have experienced shows that all three categories are most commonly experienced on the train (). In the category of nonverbal sexual violence, sexual looks and gestures are most common onboard, both on the bus and train, while stalking is the most common at the station and on the way to or from the station. Obscene or abusive language is the most common form of verbal sexual violence onboard the bus and train, while whistling is more common at the station and on the way to or from the station. In the category of physical sexual violence, groping is the most common type of behaviour, especially on the train, where almost one out of five have experienced it, due most likely to crowded conditions during rush hour. Among the respondents who feel unsafe at night when travelling by train, 67% have a long commuting time to the university and as many as 84% are frequent users. An equally large share of the respondents who feel unsafe using the bus at night have a long commuting time (65%), but only 51% are frequent users. Women feel less safe on the way to or from train stations and/or bus stops. Therefore illustrates how women’s safety perceptions is affected by different types of harassment on-board, to/from, bus stop, for example.
Table 1. The most common sexual violence experienced by women, by category along the trip (e.g., onboard, to/from, bus stop) and declared safety perceptions and by transportation mode
Modelling safety perception along the trip
report the results from the logistic regression models for both metro and bus systems.
Table 2. Logistic regression results of Y = Young people’s declared unsafety, rail-bound and on the way to/from station
Table 3. Logistic regression results of Y = Young people’s declared unsafety when using buses or on the way to bus stops
Safety perception during the trip (onboard metro/tram/train and bus or at transport nodes)
Gender is the factor that influences the feeling of safety the most, especially on the metro, tram or commuter train. Women are almost 4 times more likely than men to declare that they feel unsafe using the metro, tram or commuter train after dark (p < 0.001) and 2.4 times more likely than men to declare that they feel unsafe using the bus after dark (p < 0.001). Previous victimization can have an impact on the feeling of safety, but note that only sexual crime has a depreciative effect on safety. Young people who have experienced sexual violence in transit are 1.7 times more likely to declare feeling unsafe using the metro, tram or commuter train (p = 0.017), but it does not explain young people’s feeling of safety on the bus (Note that sexual victimization is less frequent in buses than in the railbound system; similar findings were also found elsewhere, see Ceccato & Loukaitou-Sideris, Citation2020; Natarajan et al., Citation2017). Longer trips also have an impact on the feeling of safety, although it is comparatively small and only significant for the metro, tram or commuter train. People who ride the metro, tram or commuter train for more than 30 minutes are 1.6 times more likely to declare feeling unsafe (p = 0.030) than those who have shorter trips (less than 30 minutes). In all models, being aware that someone close has been a victim of crime has not affected young people’ declared safety perceptions.
The situational factors that influence young people’s feeling of safety vary between metro, tram or commuter train and bus (). Students who requested an increase of CCTV are almost twice as likely to declare feeling unsafe using the metro and bus (p = 0.002 and p = 0.008). In the railbound setting, poor surveillance is the most important factor affecting poor safety perceptions. Young people who complain about poor surveillance and empty stations are 4.6 times more likely to declare feeling unsafe using the metro, tram or commuter train (p < 0.001). However, it is unclear the direction of this relationship.
Isolated stations have an impact on people’s feeling of safety. People who complain about isolated stations are twice as likely to declare feeling unsafe on the bus (P = 0.094 and p = 0.008), which indicates that bus stops/stations located in neighbourhoods more on the outskirts of the city would run a higher chance of being perceived as unsafe than those located in more dense, crowded areas, where natural surveillance is part of the routine activity of such places.
For bus rides or at the bus stops (and not for rail-bound travel), two other situational factors are relevant to explain the variation of declared poor safety perceptions among young travellers. For instance, those who complain about the presence of drunk people at bus stops or requested increased police patrolling in transit environments are almost twice as likely to declare feeling unsafe on the bus (p = 0.010 and p = 0.015).
Safety perception on the way to or from the transportation node (metro station/bus stop)
Young people living in high crime neighbourhoods declare feeling more unsafe than those living in less criminogenic neighbourhoods (note that an area’s crime rate is significant for those using train/metro but not for those using bus). This neighbourhood effect shows that the quality of the environment to which young people are exposed on the way to or from metro/train station affects their overall safety.
Crime in an area also relates to levels of social control and maintenance of an area. Young travellers who requested for increased police patrolling are 1.9 times more likely to declare feeling unsafe on the way to or from the metro station (p = 0.002) and 2.4 times more likely to declare feeling unsafe on the way to or from the bus stop (p < 0.001). Moreover, respondents who requested an increase of CCTV are twice as likely to declare feeling unsafe on the way to or from the metro station (p < 0.001), but only 1.5 times more likely to declare feeling unsafe on the way to or from the bus stop (p = 0.041). In addition, poor surveillance turns out to be a significant factor only on the way to or from the metro station. People who complain about poor surveillance and empty stations are 3.8 times more likely to declare feeling unsafe on the way to or from the metro station (p = 0.001). For bus stops, the larger concerns for people’s feelings of safety are instead isolated stations and drunk people. People who complain about isolated stations (or bus stops) are almost twice as likely to declare feeling unsafe on the way to or from the bus stops (p = 0.013), and those who complain about drunk people are twice as likely to declare feeling unsafe on the way to or from the bus stops (p = 0.007).
Among individual factors, shows again that women are 5 times more likely to declare that they feel unsafe on the way to or from the metro station (p < 0.001) and 4 times more likely to declare that they feel unsafe on the way to or from the bus stops (p < 0.001). Longer trips have a significant, but rather small, impact for people on the way to or from the metro, and it is not significant on the way to or from the bus stops. People who ride the metro for more than 30 minutes are slightly more than 1.8 times more likely to declare feeling unsafe on the way to or from the metro station (p = 0.009). Previous experience of sexual violence has an impact on people’s feelings of safety on the way to or from a transport node (bus stop or metro, for example), but the impact is slightly larger in rail-bound settings. Young people who have experienced sexual violence in transit are twice as likely to declare feeling unsafe on the way to or from the metro station (p < 0.001) and 1.6 times more likely to declare feeling unsafe on the way to or from the bus stop (p < 0.020).
Testing potential differences by gender and modes along the trip
Four set of models were executed to test potential gender differences (men and women separately) in safety perceptions against individual and situational factors (the variables from the previous models). show the variables that are significant in the models for perceived safety split by male and female, by transportation modes and on the station/bus stop and on the way to them (Appendix A).
Note that the variables that are significant in the original model tend also to be significant in the models split by gender, although they differ slightly by transportation mode and stage of the trip. There are variables that are significant both in the female and the male model, such as poor surveillance, empty station, perception of need to increase CCTV. However, the model shows that there are significant differences in safety perceptions by transportation mode and whether it is on the bus/train or on the way to it. For instance, women are more likely to have their safety perception on the bus stop affected by drunk people and stations with none or few CCTV than by men. On the way to the bus stop, safety perceptions are affected by previously sexual violence in transit, isolated station and stations that are perceived to have not enough police patrolling (respondent would wish more patrolling). Note that presence of drunk people was significant for ‘the bus models’ but not for ‘rail-bound mode’ – but for women only. For rail bound (metro/commuting trains), women’s safety perceptions are more likely to be affected by poor surveillance, empty stations, and lack of CCTV, regardless if it is on the train or on the platform or on the way to it. For men, safety perceptions during the train trip are more likely to be affected by previously victimization and in conditions of poor surveillance, among other things. On the way to the stations/platform, men’s safety perceptions are affected by the criminogenic conditions of the area, need of police patrol and CCTV in the station and experiencing longer trips. Compared with the original models, these are based on smaller samples and are therefore less robust: the number of students dropped from around 700 to 330 in each model.
Discussion of results
Safety perceptions by university students in transit environments show a temporal dimension. University students declare feeling safer during the day than in the evening and at night. As expected, this confirms previous evidence that evenings and nights are perceived as less safe, regardless of mode of transportation (Smith & Cornish, Citation2012). This is the time when certain environmental characteristics, such as desolation, darkness, lack of surveillance – are particularly present in transit settings affecting not only victimization (e.g., Liggett et al., Citation2001; Loukaitou-sideris, Citation1999) but also safety perceptions (Ceccato, Citation2013).
As initially hypothesized, university students who had previously experienced sexual harassment declare being more fearful than those who had not. This is an indicator that sexual crime in transit environments is a real problem yet greatly underreported, a nuisance that can reduce a student’s safety along the trip. Despite a link between victimization from sexual harassment and safety perceptions, this evidence should be considered carefully, because previous studies show ambiguous links between victimization and fear of crime (Cates et al., Citation2003; Garofalo & Laub, Citation1979). This is reinforced by the fact that students’ previous victimization by other crimes, such as property and/or other violence, showed no impact on their perceived safety (see also Cops et al., Citation2012). Findings showed that being aware that someone close has been a victim of crime has not affected young people’s declared safety – a finding that goes against previous research (Skogan, Citation1987). However, this finding does not say anything about altruistic fear (Heber, Citation2009): people’s fear of crime as it relates to the safety or wellbeing of others. If victimization of someone close does not affect safety perceptions, future research should explore whether young people who fear for their parents, families and friends also declare being more fearful while in transit.
Although safety perceptions are gendered and determined by situational conditions that vary by mode and along the trip, a few factors are common regardless of gender, such as poor surveillance, empty station and perception of need to increase CCTV. They should be given priority when defining safety intervention measures in Stockholm’s transit environments.
Young people’s safety perceptions are clear indications of risk of victimization along the trip. Note that as students become victims of crimes along the trip, their safety is reduced, their perception of safety is lowest on the way to or from the station/bus stops (see also Wiebe et al., Citation2014). These results are consistent for both rail-bound transport and buses, although rail-bound travel is perceived as less safe than buses. These findings call for an approach to youth’s safety that goes beyond transport nodes and focuses on a multi-temporal whole journey perspective, examining different transit environments, during different hours of the day, weekdays and seasons. For instance, the number of hours of sunlight in the spring may have mediated the effect of poor artificial lighting in some of these transit settings; survey responses may have been different if collected in the darkness of winter. These findings also corroborate the hypothesis that transit environments have a role to play in the perceived safety of young riders, either in transport nodes or in the neighbourhood, or on the way to or from them.
Findings also show that poorly maintained transport nodes depreciate young people’s safety perception in transit environments. Characteristics of the physical and social environment of transit settings frequently associated with ‘social disorder’ are associated with increased levels of fear. As previously mentioned, the mechanisms linking visible deterioration of a setting to reported poor safety perceptions can be associated with Wilson and Kelling’s broken window syndrome (Wilson & Kelling, Citation1982). In addition, university students who walk daily to a bus stop or a train station in a high crime area also express poorer safety perceptions (see e.g., Ceccato, Citation2013; Natarajan et al., Citation2017).
Conclusions and recommendations
This study is informed by a whole journey approach that includes assessing safety perceptions of university students when walking to and from the bus stops/train/metro as well as waiting for and riding on the bus or train/metro, using answers from a survey sent to university students in Stockholm, Sweden. Young people’s safety perceptions are highly affected by gender and previous sexual victimization. Those who declared feeling more unsafe in transit are young women and/or those who in the past three years have been a victim of sexual crime. After controlling for other individual factors, results indicate that young people’s safety perceptions vary along the trip, by transportation mode and over the day. Modelling results also indicate that the types of environments they are exposed to along the trip also influence students’ perceived safety. The location and maintenance of the stations affect safety, as do the neighbourhoods’ criminogenic conditions (e.g., residing in a high crime area). Students’ fear was proportionately lower within the controlled environment of the transit vehicle than in the relatively open and less controlled environment of the street leading to the transit stop or at the transit stop. These findings were consistent for both bus and other types of public modes of transportation, such as metro, so what lessons can be drawn for practice? It is crucial that legislators, the criminal justice system, policy makers and planners take the problem of transit safety seriously, in particular because of the problem of sexual victimization. Only a few countries have started enacting legislation specifically focusing on sexual harassment and designating strict penalties. When legislation is in place, very often the range of sexual crimes included is limited and may not include daily minor nuisances in the range of inappropriate sexual behaviours, such as verbal sexual assault (Ceccato & Loukaitou-Sideris, Citation2020).
Findings call for an approach to students’ safety, in particular for female students, that goes beyond transport nodes and focuses on a multi-temporal whole journey perspective, examining different transit environments, during different hours of the day, weekdays and seasons. This could also involve the design of harassment-free environments, well-guarded streets and pedestrian walkways, strengthening social control and management in transport nodes and on the way to them (well-lit, well-maintained routes on the way to or from transport bus stops/stations), in addition to testing technological solutions, such as real-time digital tables, CCTVs and apps at particular hotspots of victimization. In addition, young people’s extensive use of modern technology such as mobile phones and apps should be further investigated as resources in crime prevention. The promise is that they can play a special role in helping students better plan their trips and ensuring a safer trip as part of precautionary measures students take to promote their own safety (agency). An example has been described by Söderström (Citation2011), who found that safety needs of young (disabled) people were differently supported by the use of mobile phones while on the move.
Our results also call for a specifically tailored set of measures against sexual violence that targets accepted norms of behaviour that are normalized in some of these transit settings, especially in places that are characterized by poor maintenance. In particular in high crime areas, the responsibility for safety in transportation nodes and surrounding areas has to be more in focus. Lack of cooperation between public and private transit stakeholders creates a grey zone in which few actors are willing to take charge of safety problems or share costs beyond their predefined roles.
We know that individual factors such as gender highly affect fear, but research still lacks large intersectional studies that show how characteristics such as ethnicity, sexual orientation and socio-economic conditions interact with gender to increase or decrease levels of fear. We also know little about whether and how these intersections (e.g., between gender, age, disability) interact with the characteristics of transit settings along the trip. Interventions must be sensitive to gender differences in particular but also other dimensions such as age, disability and frequency of transit use. In this process, it is essential to incorporate the voices and views of those who are more targeted for sexual offences while in transit – young women. This study, despite being limited to university students with a limited degree of generalizability, contributes to a better foundation for a large-scale study of safety perceptions and victimization within public transport involving other age groups.
Acknowledgments
We are grateful for Anastasia Koktsidou’s kind assistance in creating the questionnaire in the web-based platform. Thanks also to all researchers involved in the global study, “Transit safety among college students: An international study”, for refining the questions used in this analysis. Thanks also goes to all KTH students who took time to respond the survey in the summer of 2018 and to all participants of the conference Crime and fear in public places that took place at KTH Royal Institute of Technology, in Stockholm, Sweden, 17–18 October 2018, for their comments.
Disclosure statement
No potential conflict of interest was reported by the authors.
Additional information
Funding
Notes
1. http://www.citypopulation.de/en/sweden/admin/01__stockholm/
References
- Abenoza, R. F., Ceccato, V., Susilo, Y. O., & Cats, O. (2018). Individual, travel, and bus stop characteristics influencing travelers’ safety perceptions. Transportation Research Record: Journal of the Transportation Research Board, 2672(8), 19–28. https://doi.org/10.1177/0361198118758677
- Beller, A., Garelik, S., & Cooper, S. (1980). Sex crimes in the subway. Criminology, 18(1), 35–52. https://doi.org/10.1111/j.1745-9125.1980.tb01346.x
- Box, S., Hale, C., & Andrews, G. (1988). Explaining fear of crime. British Journal of Criminology, 28(3), 340–356. https://doi.org/10.1093/oxfordjournals.bjc.a047733
- Branas, C. C., Cheney, R. A., MacDonald, J. M., Tam, V. W., Jackson, T. D., & Ten Have, T. R. (2011). A difference-in-differences analysis of health, safety, and greening vacant urban space. American Journal of Epidemiology, 174(11), 1296–1306. https://doi.org/10.1093/aje/kwr273
- Bromley, R. D. F., & Nelson, A. L. (2002). Alcohol related crime and disorder across urban space and time: Evidence from a British city. Geoforum, 33(2), 239–254. https://doi.org/10.1016/S0016-7185(01)00038-0
- Cates, J. A., Dian, D. A., & Schnepf, G. W. (2003). Use of protection motivation theory to assess fear of crime in rural areas. Psychology, Crime & Law, 9(3), 225–236. https://doi.org/10.1080/1068316021000072184
- Ceccato, V. (2013). Moving safely: Crime and perceived safety in Stockholm’s subway stations. Lanham: Lexington.
- Ceccato, V., & Loukaitou-Sideris, A. (2020). Transit crime and sexual violence in cities: International evidence and prevention. New York and London: Routledge.
- Cops, D., Pleysier, S., & Put, J. (2012). Worrying about the future and fear of crime among young adults: A social psychological approach. Journal of Youth Studies, 15(2), 191–205. https://doi.org/10.1080/13676261.2011.635193
- Dunckel Graglia, A. (2016). Finding mobility: Women negotiating fear and violence in Mexico City’s public transit system. Gender, Place & Culture, 23(5), 624–640. https://doi.org/10.1080/0966369X.2015.1034240
- Evans, G. (2009). Accessibility, urban design and the whole journey environment. Built Environment (1978-), 35(3), 366–385. https://doi.org/10.2148/benv.35.3.366
- Furstenberg, J. F. F. (1971). Public reaction to crime in the streets. The American Scholar, 40(40), 601–610. https://www.jstor.org/stable/41209894
- Garofalo, J., & Laub, J. (1979). Fear of crime - Broadening our perspective. Victomology, 3(4), 242–253. http://www.ncjrs.gov/App/publications/abstract.aspx?ID=57388
- Gray, E., Jackson, J., & Farrall, S. (2008). Reassessing the fear of crime. European Journal of Criminology, 5(3), 363–380. https://doi.org/10.1177/1477370808090834
- Hale, C. (1996). Fear of crime: A review of the literature. International Review of Victimology, 4(2), 79–150. https://doi.org/10.1177/026975809600400201
- Heber, A. (2009). “The Worst thing that Could Happen”: On altruistic fear of crime. International Review of Victimology, 16(3), 257–275. https://doi.org/10.1177/026975800901600302
- Hirtenlehner, H., & Farrall, S. (2014). Is the ‘shadow of sexual assault’ responsible for women’s higher fear of burglary? British Journal of Criminology, 54(6), 1167–1185. https://doi.org/10.1093/bjc/azu054
- Iudici, A. (2015). Sexual Harassment against People with Mental Disabilities in Transit Environments: Implications for Services and Clinics. In V. Ceccato & A. Newton (Eds.), Safety and Security in Transit Environments: An Interdisciplinary Approach (pp. 328–343). London: Palgrave Macmillan UK.
- Iudici, A., Bertoli, L., & Faccio, E. (2017). The ‘invisible’ needs of women with disabilities in transportation systems. Crime Prevention and Community Safety, 19(3), 264–275. doi:10.1057/s41300-017-0031-6.
- Jackson, & Gouseti, I. (Eds.). (2012). Fear of crime: An entry to the encyclopedia of theoretical criminology. Wiley-Blackwell.
- Jackson, J., & Gouseti, I. (2014). Fear of crime. In J. M. Miller (Ed.), The encyclopedia of theoretical criminology. Oxford: Wiley-Blackwell. (accessed 7 August 2020): SSRN: https://ssrn.com/abstract=2118663.
- Johansson, K., Laflamme, L., & Eliasson, M. (2012). Adolescents’ perceived safety and security in public space—A Swedish focus group study with a gender perspective. YOUNG, 20(1), 69–88. https://doi.org/10.1177/110330881102000104
- Kalpana, V., & Surabhi Tandon, M. (2007). ‘Shall We Go out?’ women’s safety in public spaces in Delhi. Economic and Political Weekly, 42(17), 1542–1548. https://www.jstor.org/stable/4419521
- KTH - Kungliga Tekniska Högskolan. (2019). KTH i siffror. https://www.kth.se/en/om/fakta/kth-i-siffror-1.3488
- Lagrange, R. L., & Ferraro, K. F. (1989). Assessing age and gender diferences in perceived risk and fear ofcrime. Criminology, 27(4), 697–720. https://doi.org/10.1111/j.1745-9125.1989.tb01051.x
- Law, R. (1999). Beyond ‘women and transport’: Towards new geographies of gender and daily mobility. Progress in Human Geography, 23(4), 567–588. https://doi.org/10.1191/030913299666161864
- Lewis, D. A., & Maxfield, M. G. (1980). Fear in the Neighborhoods: An Investigation of the Impact of Crime. Journal of Research in Crime and Delinquency, 17(2), 160–189. https://doi.org/10.1177/002242788001700203
- Liggett, R., Loukaitou-Sideris, A., & Iseki, H. (2001). Bus stop–environment connection: Do characteristics of the built environment correlate with bus stop crime? Transportation Research Record: Journal of the Transportation Research Board, 1760(1), 20–27. https://doi.org/10.3141/1760-03
- Loewen, L. J., Steel, G. D., & Suedfeld, P. (1993). Perceived safety from crime in the urban environment. Journal of Environmental Psychology, 13(4), 323–331. https://doi.org/10.1016/S0272-4944(05)80254-3
- Loukaitou-sideris, A. (1999). Hot spots of bus stop crime: The importance of environmental attributes. Journal of the American Planning Association, 65(4), 395–411. https://doi.org/10.1080/01944369908976070
- Loukaitou-Sideris, A., & Fink, C. (2008). Addressing women’s fear of victimization in transportation settings: A survey of U.S. transit agencies. Urban Affairs Review, 44(4), 554–587. https://doi.org/10.1177/1078087408322874
- Loukaitou-Sideris, A., Liggett, R., & Iseki, H. (2002). The geography of transit crime: Documentation and evaluation of crime incidence on and around the green line stations in Los Angeles. Journal of Planning Education and Research, 22(2), 135–151. https://doi.org/10.1177/0739456X02238443
- Lubitow, A., Abelson, M. J., & Carpenter, E. (2020). Transforming mobility justice: Gendered harassment and violence on transit. Journal of Transport Geography, 82, 102601. https://doi.org/10.1016/j.jtrangeo.2019.102601
- Mellgren, C., Andersson, M., & Ivert, A.-K. (2018). “It Happens All the Time”: Women’s experiences and normalization of sexual harassment in public space. Women & Criminal Justice, 28(4), 262–281. https://doi.org/10.1080/08974454.2017.1372328
- Moreira GC, Ceccato VA. (2021). Gendered mobility and violence in the São Paulo metro, Brazil. Urban Studies. 58(1):203–222. https://doi.org/10.1177/0042098019885552
- Natarajan, M., Schmuhl, M., Sudula, S., & Mandala, M. (2017). Sexual victimization of college students in public transport environments: A whole journey approach. Crime Prevention and Community Safety, 19(3), 168–182. https://doi.org/10.1057/s41300-017-0025-4
- Newton, A., 2014. Crime on public transport. In: Encyclopedia of Criminology and Criminal Justice. Springer: London.
- Otis, M. D. (2007). Perceptions of victimization risk and fear of crime among lesbians and gay men. Journal of Interpersonal Violence, 22(2), 198–217. https://doi.org/10.1177/0886260506295346
- Pain, R., & Smith, S. J. (2008). Fear: Critical geopolitics and everyday life. In R. Pain & S. J. Smith (Eds.), Fear: Critical geopolitics and everyday life (pp. 1–24). Ashgate.
- Pain, R. H. (1997). Social geographies of women’s fear of crime. Transactions of Inst of British Geographers, 22(2), 231–244. http://www.jstor.org/stable/622311
- Sani, A., Nunes, L. M., Azevedo, V., & Sousa, H. F. (2020). Campus criminal victimization among higher education students: A diagnosis of local security in porto. Journal of Criminal Justice Education, 31(2), 250–266. https://doi.org/10.1080/10511253.2019.1702219
- SAS. (2017). SAS (Version 9.4).
- Skogan, W. G. (1987). The impact of victimization on fear. Crime and Delinquency, 33(1), 135–154. https://doi.org/10.1177/0011128787033001008
- Skogan, W. G. (1996). The police and public opinion in Britain. American Behavioral Scientist, 39(4), 421–432. https://doi.org/10.1177/0002764296039004006
- Smith, M., & Cornish, D. B. (2012). Secure and tranquil travel: Preventing crime and disorder on public transport. Taylor and Francis.
- Söderström, S. (2011). Staying safe while on the move. YOUNG, 19(1), 91–109. https://doi.org/10.1177/110330881001900106
- SPSS. (2018) . IBM SPSS (Version 25). Armonk.
- Tripathi, K., Borrion, H., & Belur, J. (2017). Sexual harassment of students on public transport: An exploratory study in Lucknow, India. Crime Prevention and Community Safety, 19(3), 240–250. https://doi.org/10.1057/s41300-017-0029-0
- TSL, Trafik Stockholms Län. (2017). Fakta om SL och länet 2016. https://sl.se/contentassets/9314f2e3ea1a4890b5e25d8fa5092c9a/sl_och_lanet_2016.compressed.pdf
- Warr, M. (2000). Fear of crime in the United States: Avenues for research and policy. Criminal Justice, 4(4), 451–489.
- Whitzman, C. (2007). Stuck at the front door: Gender, fear of crime and the challenge of creating safer space. Environment & Planning A, 39(11), 2715–2732. https://doi.org/10.1068/a38449
- Wiebe, D. J., Richmond, T. S., Poster, J., Guo, W., Allison, P. D., & Branas, C. C. (2014). Adolescents’ fears of violence in transit environments during daily activities. Security Journal, 27(2), 226–241. https://doi.org/10.1057/sj.2014.8
- Wilson, J. Q., & Kelling, G. L. (1982). Broken windows. Atlantic Monthly, 249, 29–38.
- Yates, A., & Ceccato, V. (2020). Individual and spatial dimensions of women’s fear of crime: aScandinavian study case. International Journal of Comparative and Applied Criminal Justice, 44(4), 277–292. https://doi.org/10.1080/01924036.2020.1719531
- Yavuz, N., & Welch, E. W. (2010). Addressing Fear of Crime in Public Space: Gender Differences in Reaction to Safety Measures in Train Transit. Urban Studies, 47(12), 2491–2515. https://doi.org/10.1177/0042098009359033
Appendix A
Logistic regression results of Y = Young people’s declared unsafety when using public transportation (bus/train) by gender.
Table A1. On the bus – Young people’s declared unsafety
Table A2. On the way to/from the bus – Young people’s declared unsafety
Table A3. On the rail-bound (metro, tram or commuter train)– Young people’s declared unsafety
Table A4. On the way to/from the station, or on the platform – Young people’s declared unsafety
