
 ?Mathematical formulae have been encoded as MathML and are displayed in this HTML version using MathJax in order to improve their display. Uncheck the box to turn MathJax off. This feature requires Javascript. Click on a formula to zoom.
ABSTRACT
A green alga, Chlorococcum sp. (Chlorococcales, Chlorophyceae), was grown from scrapings of the travertine rocks from the outlet stream of the Emerald Pool, Khlong Thom Nuea, Khlong Thom District Krabi province in Southern Thailand – a classic karstic stream habitat. It was a recalcitrant alga: organic solvents did not extract chlorophyll (Chl) from the algae very well but heated Dimethylsulphoxide (DMSO) was effective. Rapid light curve PAM experiments were used to quantify photosynthetic parameters: Eopt = 275 ± 9.7 µmol photons m–2 s–1, ETRmax = 277 ± 5.99 µmol e– g–1 Chl a s–1, photosynthetic efficiency (Alpha, α0) = 2.248 ± 0.112 e– g–1 Chl a. For Chlorococcum sp. deliberately grown in very low light, Eopt = 290 ± 4.89 µmol photons m–2 s–1 but ETRmax = 109 ± 0.97 µmol e– g–1 Chl a s–1, Alpha (α0) = 1.010 ± 0.192 e– g–1 Chl a. Overall, the amount of Chl b compared with Chl a was relatively low for most Chl a + b organisms (Chl b/a ≈ 0.21) but the ratio was not strongly affected by irradiance. The changes in ETRmax and α0 indicate that the Chlorococcum sp, responded to very low irradiance by increasing total Chl as Chl a, a marginal decrease in Chl b/a ratio but no substantial change in far-red absorption. The spectrum stripping technique confirmed Chlorococcum sp, is a Chl a + b organism albeit with a low Chl b content. Photosynthesis in this species was not very sensitive to pH in the range pH 5–9 but was inhibited at pH 10, indicating that it was very capable of using HCO3– as an inorganic carbon source. Chlorococcum has a carbon concentrating mechanism (CCM), however based on its insensitivity to the depolarizing effects of high [K+], it is unlikely to be dependent on the membrane potential across the cell membrane. The alga is homiochlorophyllous and recovers rapidly from dessication without synthesis of new chlorophyll.
Highlights
The green unicellular alga Chlorococcum was found growing in travertine rock,
Has Chl b/a ratio typical of green algae, contrasting with Ostreobium,
Rapid light curves show optimum irradiance at about 300 µmol photons m–2 s–1,
Chlorococcum has a carbon concentrating mechanism (CCM),
Homiochlorophyllous alga quickly recovering from desiccation without synthesizing new chlorophyll.
Introduction
Endolithic algae are common in rocks, travertine, stonework and in calcified organisms such as corals and mollusc shells often forming a green layer a few mm below the surface (Bellinzoni, Caneva, & Ricci, Citation2003; Gaylarde, Gaylarde, & Neilan, Citation2012; Hodač et al., Citation2015; Macedo, Miller, Dionísio, & Saiz-Jimenez, Citation2009; Matthes, Turner, & Larson, Citation2001; Pernice et al., Citation2020). Typically, these are green algae (with Chlorophyll (Chl) a + b) or cyanobacteria but are often overlooked. Freytet and Verrecchia (Citation1998) and Hodač et al. (Citation2015) give summaries of the types of prokaryotic and eukaryotic algae that are found in freshwater stromatolithic and travertine material within karstic stream habits (for more detail see Pentecost, Citation2005). Physiologically, the most well-known endolithic green algae are marine Ostreobium species, which live in the skeletons of live and dead corals (Del Campo, Pombert, Šlapeta, Larkum, & Keeling, Citation2017; Verbruggen & Tribollet, Citation2011). Ostreobium is an unusual chlorophyte in having very large amounts of Chl b (often Chl b > Chl a) and is known to photoacclimate (by changing its Chl b/a ratio) to the different irradiance conditions in the coral skeleton of live vs. bleached corals (Fine, Steindler, & Loya, Citation2004; Verbruggen & Tribollet, Citation2011). It is also known to transfer at least some photosynthate to the coral host (Del Campo et al., Citation2017; Schlichter, Zscharnack, & Krisch, Citation1995; Verbruggen & Tribollet, Citation2011) and so it is likely that endolithic algae in general do release organic compounds into other calcium carbonate matrices such as travertine, which would encourage calcification (Shiraishi, Bissett, de Beer, Reimer, & Arp, Citation2008).
Endolithic algae may be boring algae that burrow through a calcium carbonate substrate but may not necessarily be contributors to calcification (Del Campo et al., Citation2017; Freytet & Verrecchia, Citation1998; Gaylarde et al., Citation2012; Hodač et al., Citation2015; Pentecost, Citation2005). In the case of travertine habitats, boring algae may or may not be a major contributor to mineralization of calcium carbonate, which is deposited as calcite, not aragonite (Chapter 10, Pentecost, Citation2005). Norris and Castenholz (Citation2006) previously identified two green algae in travertine from Yellowstone National Park in the USA as Bracteacoccus aerius (CCMEE 6027) and Paradoxia multiseta (CCMEE 6038/6039) identified by 16S rRNA. Other studies have recorded no eukaryotic green algae in travertine at all (Pentecost, Citation2005, Citation2011). In a material such as travertine, it might be difficult to establish whether an alga contributes to calcification, has no impact, or is a carbonate-boring species. Based on observations of field material, Freytet and Verrecchia (Citation1998) found that CaCO3 crystalline material was associated with a wide variety of algae from travertine including unicellular green algae.
Carbon Concentrating Mechanisms (CCM) are common in algae. In the course of this study, the photosynthetic Electron Transport Rate (ETR) was measured up to external pH values where essentially no free CO2 was available (Steemann-Nielsen-type experiment). This would be consistent with Chlorococcum sp. having a CCM thereby being able to use HCO3 – as a source of inorganic carbon (Maberly & Spence, Citation1983; Pernice et al., Citation2020; Raven, Citation1997; Raven, Ball, Beardall, Giordano, & Maberly, Citation2005; Verma, Bhatti, Huss, & Colman, Citation2009). Such mechanisms are often proposed to be driven by the electrochemical potential of protons (Pmf) or a mechanism driven by electrochemical potential of Na+ (Namf). Both such mechanisms are governed by the negative plasma membrane electrical potential of plant cells. An approach to test this is to try and measure photosynthetic ETR under conditions where the membrane potential has been depolarized, for instance high external K+ will largely depolarize membrane potentials (Beilby, Citation1986; Britto & Kronzucker, Citation2008).
We have attempted to characterize the photosynthetic parameters of an endolithic alga from a tropical limestone spring environment. Limestone karst environments are common in SE-Asia but their biology is not well documented. The target of this study was the green alga Chlorococcum species (Chlorococcum sp.: Chlorophyta, Chlorococcaceae), derived from dried calcium carbonate oncoids, and it was expected that the alga would be resistant to desiccation. Endolithic algae often inhabit CaCO3 deposits that intermittently dry out and algae and vascular plants that rapidly (in minutes) recover from desiccation are called homiochlorophyllous. Plants whose chloroplasts disintegrate when dehydrated and rebuild their photosynthetic apparatus including Chls upon rehydration, sometimes taking days to recover, are called poikilochlorophyllous (Ritchie & Heemboo, Citation2021). Experiments were run on the alga before dehydration and after rehydration to investigate whether the alga was homiochlorophyllous or poikilochlorophyllous, Chlorococcum sp. was found in travertine stream deposits and light responses, pH, role in calcification, existence of a CCM and resistance to desiccation were all investigated.
Materials and methods
Organisms and culture conditions
Travertine rocks from the outlet stream of Emerald Pool, Khlong Thom Nuea, Khlong Thom District Krabi province in Southern Thailand were used as source material for culture (7.92569°N, 99.26935°E; Supplementary fig. S1). The green alga identified as Chlorococcum sp. (Chlorococcales, Chlorophyceae) was grown from these rocks (oncoids) found in the limestone spring, similar to the habitats described in f ig 1, panels 4 and 5 in Pentecost and Viles (Citation1994). This is a classic karstic stream habitat (Hodač et al., Citation2015; Shiraishi et al., Citation2008) but in a tropical location where the rocks appeared to be an amorphous micrite (Freytet & Verrecchia, Citation1998). The calcium carbonate rocks were air-dried and then internal scrapings were placed on modified BG-11 1.5% washed agar and cultured (Allen, Citation1973; Nichols, Citation1973). The green alga was easy to isolate on agar plates but the blue-green algae that was visibly present in the oncoids did not grow up in culture. For benchmark comparison purposes, the cyanobacterium Synechococcus R-2 PCC7942 (Pasteur Culture Collection, Paris, France) and the green alga Chlorella vulgaris were used (Phuket Marine Biological Centre (PMBC), Phuket, Thailand). All three algae were grown in a modified BG-11 medium with a pH of about 8.1 using a lowered phosphate concentration (0.2 mol m–3 K2HPO4) to avoid any inhibition of calcification in unmodified BG-11.
The cells were grown in 250 and 500 ml conical flasks, which were shaken each day. The light intensity on the shelves in the growth room was about 150 µmol photons m–2 s–1 (PPFD, 400–700 nm) measured using a MQ-200 Quantum Metre, Apogee Instruments, Logan, Utah, USA. Cool white or warm-white fluorescent tubes were used (6500 K, Philips, The Netherlands) and the temperature was maintained between 25°C and 30°C. Some cultures were also grown under dim diffuse light in the culture room (≈ 3 µmol photons m–2 s–1; PPFD, 400–700 nm) because the Chlorococcum is so often found growing under very dim light.
Chemicals
DMSO (Dimethylsulphoxide, dimethyl sulphoxide, (CH3)2SO) was from WINNEX (Thailand) Co. Ltd, Bangkok, Thailand. Acetone (CH3)2CO 99.5 AR/ACS was from LOBA Chemie PVT. LTD, Mumbai, India. The ethanol used was standard laboratory AR grade (Emsure® Merck KGaA, Darmstadt, Germany). Acetone, ethanol and DMSO were neutralized with magnesium carbonate.
Scanning dual beam spectrophotometer
A Shimadzu UV-1601 UV–visible double beam spectrophotometer (Shimadzu Corporation, Kyoto, Japan) was used for routine Chl determinations using standard scanning settings (1 nm bandwidth and 1 nm sampling interval) Chl a and Chl b/a ratio were determined using the algorithms developed for 7:2 acetone/ethanol (Ritchie, Citation2018) and DMSO (Ritchie, Sma-Air, & Phongphattarawat, Citation2021) using 1 cm quartz cuvettes.
Integrating sphere
Hardware and software
UV Vis Spectrophotometer (Model: AE-s90-2D, Serial Number: AT161006, A & E Lab Co. Ltd, UK) fitted with a 60 mm (2 ½ inch) integrating sphere that can be operated in transmission and reflectance modes. Two windows of 1 cm quartz cuvettes supplied by A&E were used. Software was UV-VIS Analyst version 5.43, (prom Version 0.000, Copyright 2013 Macroeasy Technologies Ltd.). In the present study, scans from 400 to 850 nm were used. Minor software bugs alluded to in some of our previous studies (Ritchie & Sma-Air, Citation2020a, Citation2020b) were corrected for manually. In vivo absorbance scans were done routinely on the A&E Integrating Sphere spectrophotometer. The cells were very heavy and fell out of suspension very easily; hence, the cells were suspended in 60% sucrose for the in vivo absorbance readings.
Fluorescence spectrophotometer
Hardware and software
Horiba Scientific Duetta Fluorescence and Absorbance Spectrometer (Horiba Canada Inc., 347 Consortium Court, London, Ontario, Canada. Four window quartz cuvettes supplied with the Horiba were used. The Rayleigh Masking software facility was used to remove reflected photons from the excitation/emission matrix (EEM). The Horiba instrument has an excitation range from 190 nm to 1000 nm and an emission (fluorescence detection) range from 190 nm to 1100 nm. For the organism in the present study 350–750 nm ranges for Excitation and Emission were used.
Measurement procedure
The material used in the present study were cell suspensions with a light scattering optical density of less than 0.2 at 750 nm for the oxygenic organisms (OD750 nm < 0.2) following protocols described previously by Sma-Air and Ritchie (Citation2021). Dilute cell suspensions were used to avoid overloading the detector of the spectrofluorometer. The cells were suspended in 60% sucrose for the in vivo spectrofluorometric measurements using the Horiba Spectrofluorometer to avoid settling out of the cells during the scanning routine.
The emission wavelengths were set for a similar range at 5 nm intervals and processed using the Rayleigh Masking software facility of the instrument. The Rayleigh Masking routine effectively removes simple light scattering (Nephelometry) from the EEM curves because if a material is fluorescent it emits photons of light at different wavelengths from the wavelengths of light absorbed. Experimental results are presented as an excitation/emission matrix (EEM). All scans could be exported as EXCEL.csv files and the graphs prepared as .jpg files using the Horiba software.
Chlorophyll
Chlorococcum cells were centrifuged at 5000 rpm (3914 rcf) in a standard swing-bucket bench centrifuge for 5 min (Hermle Z323K, Hermle Labortechnik, Wehingen, Germany) and the supernatant removed or the cells were filtered onto glass fibre disks using a Millipore glass filtration apparatus with an internal diameter of 16.2 mm. For the Synechococcus (Chl a) a 7:2 Acetone-Ethanol solvent extract was used and the equations of Ritchie (Citation2018). It was very difficult to properly extract Chls from the alga in 7:2 Acetone-Ethanol solvent even after heating at 60°C (Porra, Citation1991, Citation2011). DMSO + 55°C for about 10 min proved to be a better extractant (Ritchie et al., Citation2021). Solvent extracts were cleared by centrifugation. 850 nm was used as the standard blank for all equations because it is a better choice of blank than the more routinely used 750 nm (Ritchie, Citation2018).
Preparation for uniform glass fibre disks of algae
Cells were prepared for PAM fluorometry as described by Ritchie (Citation2008, Citation2014) and Ritchie and Heemboo (Citation2021). We made uniform algal-impregnated disks of cells of known surface area (and measureable Chl a content) for the PAM measurements as done previously for unicellular algal suspensions. The cell suspension (3, 4 or 5 ml) was filtered onto glass fibre disks (Whatman GF/C, Whatman International, Maidstone, England, UK) in a 16.2 mm internal diameter (206.12 × 10⁻⁶ m2) Millipore filter apparatus to create a uniform disk of cells. Typical algae-impregnated disks had 30–50 mg m–2 of Chl a. The disks were kept in the dark for about 10 min before doing PAM rapid light curves in Petri dishes with filter paper lightly moistened with the appropriate experimental medium. The PAM software calculates rETR as µmol e– m–2 s–1 but if the absorptance (Abt465 nm) of the algal disk (Ritchie & Runcie, Citation2014) and the Chl a content of the disk (mg m–2) were both known the ETR could be recalculated as µmol e– g–1 Chl a s–1.
Pulse amplitude modulation (PAM) fluorometry
Chlorococcum is a common inhabitant of endolithic habitats that have very low irradiances: endolithic habitats, (Freytet & Verrecchia, Citation1998; Matthes et al., Citation2001; Norris & Castenholz, Citation2006), stonework, (Gaylarde et al., Citation2012; Macedo et al., Citation2009), tourist limestone caves, Smith & Olson, Citation2007) as well as travertine (Bellinzoni et al., Citation2003; Hodač et al., Citation2015). Rapid light curves were therefore run on some cultures that had been kept in very low light for 4 weeks (≈3 µmol photons m−2 s−1, PPFD). We have used a Junior PAM portable Chla fluorometer (Gademann Instruments, Würzburg, Germany) in various studies. It has a 1.5 mm-diameter optic fibre and a blue diode light source (445 ± 20 nm) with a simple highpass filter (> 695 nm) to protect the detector diode from transmitted blue light and could measure fluorescence from Chl a (Hak, Ritchie, & Dummee, Citation2019; Ritchie, Citation2008; Sma-Air & Ritchie, Citation2020). We used uniform glass fibre filter disks of algae for PAM measurements that therefore had a known Chl a m–2. The PAM parameters (Y, rETR, qP, NPQ) were automatically calculated using the WINCONTROL software (v2.08 and v2.13; Heinz Walz Gmbh, Effeltrich, Germany) using the standard default settings for rapid light curves (default absorptance factor, AbtF = 0.84, PSI/PSII allocation factor = 0.5) to calculate the relative electron transport rate (rETR). The full protocol was based on the most recent published versions (Hak et al., Citation2019; Ritchie & Heemboo, Citation2021; Sma-Air & Ritchie, Citation2020).
Yield (Y) was calculated by the Walz PAM machine software. If Y is plotted against irradiance (E), it follows a simple exponential decay function of the form YE = Ymax e–kE, where YE is the Yield at PPFD irradiance (E) (µmol photons m–2 s–1), Ymax is the maximum Yield at asymptotically zero irradiance and k is an exponential constant. Y½ is the irradiance where Yield is reduced to ½ of maximum (Ymax). The irradiance at which the Y is half maximum is Y½ = -ln2/k.
Photosynthetic electron transport rate (ETR) is proportional to the product of the Yield (Y) × Irradiance (E). The Walz software uses a default absorptance of 0.84 and so calculates the relative ETR (rETR): if absorptance (Abt) is measured experimentally the actual ETR can be calculated. Experimentally measured Absorptance values (Abt465 nm) of plant material are often rather different to the default value of 0.84 (ETR = rETR × Abt465nm/0.84) (Ritchie & Runcie, Citation2014). The electron source in oxygenic photosynthesis is water: 2H2O → 4 H+ + 4e– + O2 and hence 1 μmol O2 m–2 s–1 ≡ 4 μmol e– m–2 s–1) but Electron Transport Rate (ETR) does not take photorespiration into account (Hak et al., Citation2019; Sma-Air & Ritchie, Citation2020) and therefore is a rough estimate of gross photosynthesis (Pg). Here we express photosynthesis as electron flow.
The Waiting-in-Line equation is a good model for rapid light curves of ETR vs. Irradiance (Ritchie, Citation2008; Ritchie & Heemboo, Citation2021; Sma-Air & Ritchie, Citation2020),
where ETR is electron transport rate as a measure of the photosynthetic Electron Transport Rate (μmol e– m–2 s–1), E is the irradiance (µmol photons m–2 s–1 400–700 nm PPFD), Eopt is the optimum irradiance and ETRmax is the maximum photosynthetic Electron Transport Rate. Importantly, the Waiting-in-Line model includes photoinhibition at high irradiance. The maximum photosynthetic efficiency (α0) is the initial slope of the curve at E = 0 (α = ETRmax × e/Eopt). Photosynthetic electron transport rate (μmol e– m–2 s–1) and photosynthetic efficiency (α0) (e− photon−1) were converted into μmol e– g–1 Chl a s–1 and e– g–1 Chl a photon–1 using the known Chl a m–2 of the algal impregnated glass fibre disks.
Non-photochemical quenching (NPQ), as defined by Brestic and Zivcak (Citation2013), was calculated by the Walz software. We found that NPQ vs. irradiance could be fitted to a simple exponential saturation curve of the form NPQ = NPQmax × (1-e–kE) where NPQmax is the maximum NPQ and k is an exponential constant. The shape of the curve can be described by quoting the maximum NPQ (NPQmax) and the irradiance at which ½ of the NPQmax is achieved (-ln2/k = NPQ½). The NPQ concept was developed for vascular plant systems. Some algae, although giving plausible Y and ETR results, may not give satisfactory pQ or NPQ data. We have tried not to over-interpret NPQ data because of these reservations.
Carbonate system
For the experiments investigating the effects of CO2/HCO3 – availability photosynthetic electron transport was measured at a range of pH. A range of buffered modified BG-11 media was prepared using 10 mol m–3 KH2PO4/K2HPO4 (pH 5, 6, 7, 7.5, 8, 8.5 & 9). pH 9.5 and 10 were prepared by adding NaOH to 10 mol m–3 K2HPO4. The equations of Vollenweider (Citation1974) and Golterman, Clymo, and Ohnstad (Citation1978) and the pK1 and pK2 values from Millero (Citation1979) were used to calculate the amounts of CO2, HCO3– and CO32–. The modified BG-11 medium would be in approximate equilibrium with atmospheric CO2 (10 mmol m–3 CO2) at pH 7.86.
Cochran and Snedecor (Citation1989) and Zar (Citation2014) were used as the standard statistical reference texts. All scans are based on means of at least four replicates. All PAM experiments had six or eight replicates. All data are quoted as means ± 95% confidence limits. Yield, ETR and NPQ data are best fitted using least squares fitting routines with asymptotic errors calculated by matrix inversion (Ritchie, Citation2008).
Results
The oncoids from Emerald Pool, Khlong Thom Nuea, Khlong Thom District Krabi province in Southern Thailand resembled Plates 11 A & B p406 in Pentecost (Citation2005). Cyanobacteria were present but they did not grow in modified BG-11. The green algal cells grew slowly but well in modified BG-11 which is alkaline at about pH 8 to 8.5. Supplementary fig. S2 shows a photomicrograph of the unialgal culture (Identified as Chlorococcum sp. Biodiversity Research Centre, Thailand Institute of Scientific and Technological Research, Pathum Thani, Thailand). No calcification or encrustation habit was apparent in the successfully cultured green alga. The alga did not grow well in BBM medium (≈ pH 5): eventually, it died off and so does not appear to be acid tolerant (Verma et al., Citation2009).
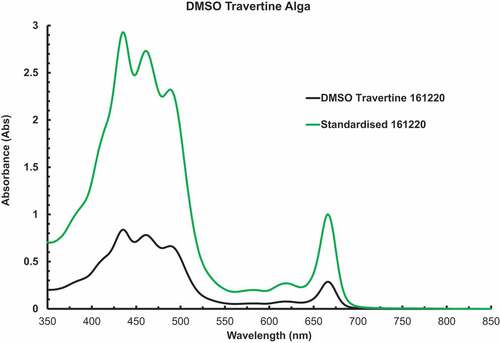
shows in vivo scans using the A&E Integrating sphere spectrometry on Chlorococcum cell suspensions grown under control and dim light conditions (≈ 3 µmol photons m–2 s–1) in 60% sucrose to retard settlement of the cells. The red peak was at 675 nm. The “knee” at about 653 nm is due to Chl b. There was little sign of far-red adaptation in the low-light culture. The alga has a high carotenoid content but there was no spectral evidence of phycobilin pigments or Chl c. These pigments were checked for because the chlorobacterium, Prochloron looks superficially like a eukaryotic Chlorococcalean green alga. Chls extractable in DMSO solvent + heat treatment were scanned in the Shimadzu dual beam spectrophotometer (). The pigments were extracted into 3 ml of solvent (Chl a = 15.12 ± 1.50 µg, 73.35 ± 7.27 mg Chl a m–2 on disk, Chl b/a ratio 0.1788 ± 0.0207, n = 6). Based on three separate PAM experiments the overall Chl b/a ratio was 0.2029 ± 0.0385 (n = 22), Eopt was 275 ± 9.7 µmol photons m–2 s–1 (n = 22), the ETRmax was 277 ± 5.99 µmol e– g–1 Chl a s–1 (n = 22) and photosynthetic efficiency (Alpha, α0) = 2.248 ± 0.112 e– g–1 Chl a (). The measured relative amount of Chl b compared with Chl a is relatively low compared with most Chl a + b organisms (): hence the inconspicuous presence of Chl b in this figure () and in . Carotenoid absorption peaks are very conspicuous at 461 & 490 nm and the blue Chl a peak is at 435 nm.
Figure 1. In vivo scans using A&E integrating sphere spectrometry on cell suspensions in 60% sucrose to retard settlement of the Chlorococcum cells. The red peak was at 675 nm, with a “knee” at about 653 nm due to Chl b in vivo. Cultures kept in dim light (≈ 3 µmol photon m–2 s–1) had similar spectra to control cells with no substantial increase in far-red absorbance but a significant increase in Chl b (653 nm).
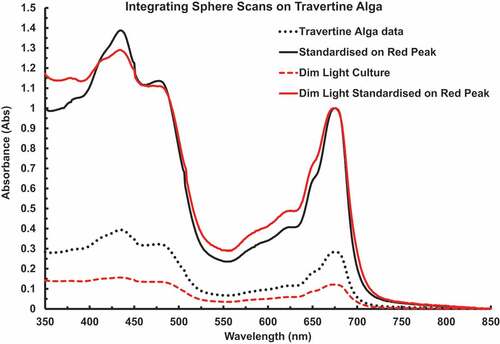
Table 1. Compendium of PAM data for Chlorococcum. Chlorococcum grown in BG-11.
Figure 2. In solvent DMSO extract of DMSO soluble pigments of Chlorococcum cells suspensions filtered onto glass fibre disks for a PAM experiment. The pigments were extracted into 3 ml of solvent.
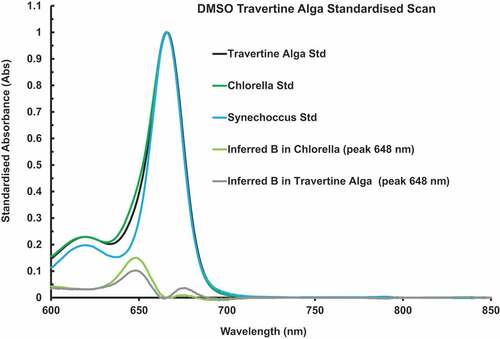
A plot of in vitro DMSO extract of DMSO soluble pigments of Chlorococcum cells standardized onto the Chl a peak at 666 nm based on 6 separate scans is shown in . The measured relative amount of Chl b compared with Chl a is relatively low for most Chl a + b organisms, hence the inconspicuous presence of Chl b in this graph and in (). In this particular sample, the calculated Chl b/a ratio was 0.2002 ± 0.0140. The inferred Chl b spectrum was calculated using the curve-stripping method using a DMSO extract from the cyanobacterium Synechococcus as a Chl a standard (Ritchie & Heemboo, Citation2021). The results of the spectral stripping method for the green alga Chlorella is included for comparison. The Chl b peak is at 648 nm. No evidence for Chl d or Chl c compounds.
Figure 3. In vitro DMSO extract of DMSO soluble pigments of Chlorococcum cells standardized onto the Chl a peak at 666 nm based on 6 separate scans. The relative amount of Chl b compared with Chl a is low, hence the inconspicuous presence of Chl b (648 nm peak) in this graph and in . The inferred Chl b spectrum was calculated using the curve-stripping method using a DMSO extract from the cyanobacterium Synechococcus as a Chl a standard. The results of the stripping method for the green alga Chlorella is included for comparison.
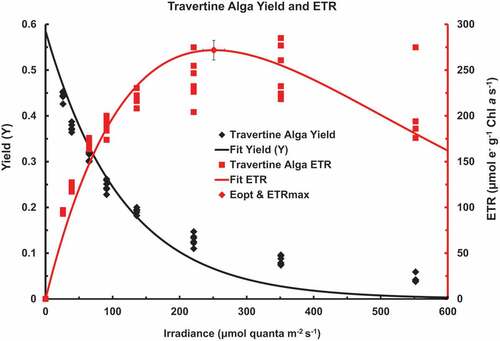
depicts a rapid light curve on the alga grown in BG-11 medium presented as an XYY graph showing Yield vs. irradiance and ETR vs. irradiance up to 552 µmol photons m–2 s–1. The maximum Yield (Ymax) was 0.5851 ± 0.0254, the half point for the decay of Yield vs. irradiance was at 79.7 ± 7.74 µmol photons m–2 s–1, r = 0.9833, n = 6, 54). The fitted Waiting-in-Line ETR vs. Irradiance is also shown. The Optimum Irradiance (Eopt) was 251 ± 16 µmol photons m–2 s–1, ETRmax was 272 ± 11 µmol e– g–1 Chl a s–1, r = 0.9575, n = 6, 54). Based on three separate rapid light curves: 13 → 352, 25 → 551 and 39 → 845 µmol photons m–2 s–1 the overall mean values are shown in .
Figure 4. Rapid light curve on the Chlorococcum travertine alga grown in BG-11 medium as an XYY graph showing Yield vs. irradiance and ETR vs. irradiance up to 552 µmol photons m–2 s–1. The maximum Yield (Ymax) was 0.5851 ± 0.0254, the half point for the decay of Yield vs. irradiance was at 79.7 ± 7.74 µmol photons m–2 s–1, r = 0.9833, n = 6, 54). The fitted Waiting-in-line ETR vs. Irradiance is also shown. The Optimum irradiance (Eopt) was 251 ± 16 µmol photons m–2 s–1, ETRmax was 272 ± 11 µmol e– g–1 Chl a s–1, r = 0.9575, n = 6, 54).
For algae grown in dim light (Supplementary fig. 3, ): six separate rapid light curves, Eopt = 291 ± 4.89 µmol photons m–2 s–1 but ETRmax = 108.9 ± 0.97 µmol e– g–1 Chl a s–1 and photosynthetic efficiency (Alpha, α0) = 1.010 ± 0.192 e– g–1 Chl a so there was little or no change in Eopt but ETRmax and photosynthetic efficiency alpha both decreased. NPQmax was much lower in the cells grown in dim light (control: 1.794 ± 0.059 vs. Dim Light: 0.1415 ± 0.0087) and the ½ point irradiance (NPQ½) for NPQ vs. Irradiance had increased (control: 59.4 ± 4.45 vs. Dim Light: 118 ± 13.7 µmol photons m–2 s–1). There was a marginal decrease in the Chl b/a ratio in dim light ().
Rapid light curves were run on Chlorococcum cells incubated in phosphate buffered (10 mol m–3) BG-11 in the pH range of 5 to 10 for 2 h (). shows the calculated [CO2], [HCO3–] and [CO32–] in buffered BG-11 medium with a nominal total inorganic carbon (TIC) content of 0.5 mol m–3. The cells had been grown in BG-11 medium which has a pH of about pH 8 to 8.1. The rapid light curves all used an irradiance range from 13 to 351 µmol photons m–2 s–1 and were fitted as described for . pH 9.5 & pH 10 BG-11 were prepared by adding NaOH to 10 mol m–3 added K2HPO4 in BG-11. Yield (Ymax) and ½ irradiance point (µmol photons m–2 s–1) for the exponential decay of Yield vs. Irradiance over a range of pH in phosphate buffered BG-11 medium as an XYY graph (). There was little effect of pH upon Ymax but the ½ point irradiance increased beyond pH 7. shows the Optimum Irradiance (Eopt) (µmol photons m–2 s–1) and maximum ETR (ETRmax) (µmol e– g–1 Chl a s–1) for the photosynthetic ETR vs. irradiance over the range of pH in phosphate buffered BG-11 medium as an XYY graph. There was little effect of pH on the Eopt but the maximum ETR was depressed at pH 7 and 7.5 in comparison to pH 5 & 6 and 8 & 9. ETRmax was much lower at pH 8.5, 9 & 10 on a Chl a basis even though the shape of the IETR vs. Irradiance curves (Eopt) were similar.
Table 2. Carbonate system of modified BG-11 medium (10 mol m–3 PO4 buffer, total inorganic carbon 500 mmol m–3) at 25°C.
Figure 5. Rapid light curves were run on Chlorococcum cells incubated in phosphate buffered BG-11 in the pH range of 5 to 10 for 2 h, 6 disks per pH value. The rapid light curves were fitted as described for . Maximum Yield (Ymax) and ½ irradiance point (µmol photons m−2 s−1) for the exponential decay of Yield vs. Irradiance over a range of pH in phosphate buffered BG-11 medium as an XYY graph. There was little effect of pH upon Ymax but the ½ point irradiance increased beyond pH 7.
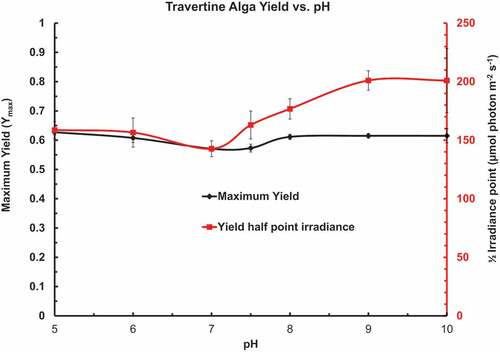
Figure 6. ETR vs. irradiance curves were fitted to rapid light curves of Chlorococcum cells incubated (2 h) in buffered BG-11 with a pH range of 5 to 10. Optimum Irradiance (Eopt) (µmol photons m–2 s–1) and maximum ETR (ETRmax) (µmol e– g–1 Chl a s–1) for the photosynthetic ETR vs. irradiance over a range of pH in phosphate buffered BG-11 medium as an XYY graph. There was little effect of pH on the Eopt but the maximum ETR was depressed at pH 7 and 7.5 compared with pH 5 & 6 and 8. The ETRmax at pH 8.5 to 10 showed a significant decrease even though there was only a small change in the shape of the ETR vs. irradiance curves as indicated by the Eopt.
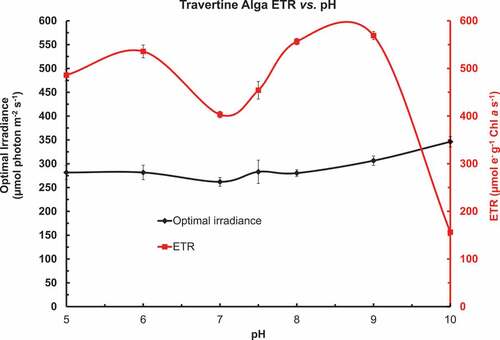
Figure 7. The ETR vs. irradiance rapid light curves were also used to fit the Non-Photochemical Quenching data to simple exponential saturating curves over the pH range from 5 to 10. The asymptotic NPQ Irradiance (NPQmax) significantly decreased with increasing pH: the half-point irradiance (NPQ½) (µmol photons m–2 s–1) for the NPQ vs. irradiance over a range of pH in phosphate buffered BG-11 medium is shown as an XYY graph. There was some trend to the NPQ½ irradiance to increase as the pH increased but the relative errors were large.
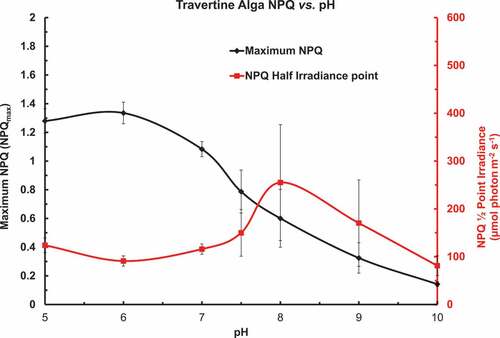
Fittings of the Non-Photochemical Quenching (NPQ) data of the above rapid light curves to simple exponential saturating curves are shown in but should be interpreted cautiously. The asymptotic NPQ Irradiance (NPQmax) significantly, and consistently, decreased with increasing pH. The half-point irradiance (NPQ½) (µmol photons m–2 s–1) for the NPQ vs. irradiance showed some trend to the NPQ½ irradiance to first increase as the pH increased but the relative errors were large at pH > 7 and then decrease at higher pH.
The results of the pH experiments above pointed to Chlorococcum being able to use HCO3−. Photosynthetic ETR was therefore measured under pH 9 conditions where CO2 would not be available and under conditions where the membrane potential would be largely depolarized (Beilby, Citation1986; Britto & Kronzucker, Citation2008). Cells were incubated for 3 h in pH 9 control BG-11 (phosphate buffer as above) and in pH 9 BG-11 medium with Na+ increased to 200 mol m–3 using NaCl and in pH 9 BG-11 with K+ increased to 200 mol m–3 using KCl. After incubation routine PAM rapid light curves were carried out. There were only small effects of both 200 mol m–3 Na+ and 200 mol m–3 K+ upon the photosynthetic parameters (). There was little effect on Yield as Ymax or the half-point for irradiance (Y½). ETRmax in high salt media was decreased by about 15%. There was, however, a conspicuous increase by a factor of about 2 times in the non-photochemical quenching (NPQmax) but not large effects upon the half-point irradiance for NPQ (NPQ½).
Table 3. Effect of depolarizing conditions on photosynthesis of Chlorococcum. Overall values based on rapid light curves: 26→552 μmol photons m–2 s–1 at pH 9.0 with 9 different irradiances 6 replicates each (n = 18).
The results of a desiccation-recovery experiment as shown in . Chlorococcum cells were filtered onto glass fibre disks and Yield, photosynthetic ETR, NPQ quenching parameters and Chl content measured on a set of controls. Replicate disks were placed in petri dishes with filter paper lightly moistened (BG-11) and allowed to dry for 24 h under continuous light in the culture room. The next day PAM experiments were performed on the dry disks and showed zero photosynthetic activity and their Chl content was measured. Dehydrated cells showed no photosynthetic activity (Yield or ETR) but Chl a and the Chl b/a ratio was almost the same as the control material indicating no loss of Chl upon desiccation. Replicate filter disks were then lightly moistened with distilled water and PAM measurements made 10 minutes after rehydration. There was a small but measureable Yield and ETR but the Y1/2 and the optimum irradiance Eopt were both shifted to low irradiances compared with the controls. In another set of moistened disks after 3 h rehydration in the light there had been substantial but not complete recovery of photosynthetic capacity. Maximum yield had increased to about 60% of the controls and the Y1/2 had also shifted to about 60% of that found in the control material. ETRmax, Eopt and photosynthetic efficiency had recovered to that found in the controls but photosynthetic efficiency had not fully recovered (a consequence of the change in optimum irradiance). The Chl a content of the controls, desiccated, 10 minute hydrated and 3 hr hydrated were approximately similar but there was a statistically significant (One-Way ANOVA) increase in the Chl b/a ratio after desiccation and recovery (10 min and 3 h).
Table 4. Dehydration and rehydration of Chlorococcum. Overall values based on rapid light curves: 26 → 552 µmol photons m−2 s−1 with 9 different irradiances 8 replicate disks each (n = 32).
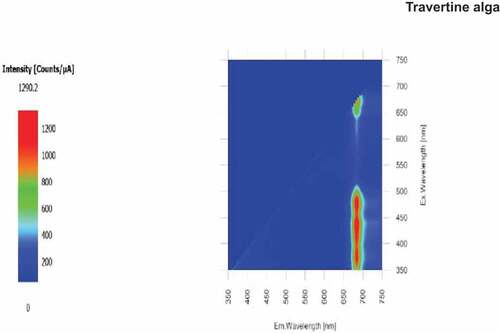
shows a 2D Excitation/ Emission curves for the travertine alga in vivo. The cells were very dense and so the Chlorococcum cells were suspended in 60% sucrose in pH 7.5 BG-11 to slow down settlement. The fluorescence (EM) peak is at about 690 nm and is from the absorption peak located at about 435 nm for Chl a and the fluorescence from the large amounts of carotenoids at about 450 to 520 nm (). As would be expected from a Chl a + b organism, there is substantially no fluorescence from wavelengths between 520 and about 630 nm (green and yellow light). Florescence from the in vivo Chl a red absorption band at 675 nm is not conspicuous compared with the Chl a blue band and the carotenoid absorption/emission bands. The alga is clearly a green alga (Sma-Air & Ritchie, Citation2021).
Figure 8. 2D EEM in vivo emission/fluorescence scan on the Chlorococcum travertine alga. The fluorescence (EM) peak is at about 690 nm and is from the absorption peak located at about 435 nm (Chl a) and the fluorescence from the large amounts of carotenoids at about 450 to 520 nm (). There is substantially no fluorescence from wavelengths between 520 nm and about 640 nm. Florescence from the in vivo Chl a red absorption band at 675 nm is not conspicuous compared with the Chl a blue band and the carotenoids.
Discussion
The travertine alga grew well in modified BG-11 medium culture from scrapings of the rocks from the outlet stream of the Emerald Pool, Khlong Thom Nuea, Khlong Thom District Krabi province in Southern Thailand (Supplementary fig. S1 & S2). Despite experience growing Synechococcus on BG-11 with washed agar (Allen, Citation1973) we had no success in growing the cyanobacteria obviously present (blue phycocyanin band) in cross-section in the travertine. The in vivo and in vitro absorbance and fluorescence scans from the alga () showed that the alga which grew in culture was a eukaryotic green alga (Sma-Air & Ritchie, Citation2021), identified as Chlorococcum sp (Chlorococcales, Chlorophyceae) (Supplementary photomicrograph S2); however, the Chl b/a ratio was rather low for typical Chl a + b eukaryotes ().
Chlorococcum is a common endolithophyte (Bellinzoni et al., Citation2003; Gaylarde et al., Citation2012; Hodač et al., Citation2015; Macedo et al., Citation2009) and is notorious for its very low light requirements (Smith & Olson, Citation2007). show that unlike Ostreobium it does not show strong signs of far-red light adaptation (Del Campo et al., Citation2017; Fine et al., Citation2004; Pernice et al., Citation2020; Schlichter et al., Citation1995; Verbruggen & Tribollet, Citation2011) but is very well endowed with carotenoid accessory pigments (). Chlorococcum does, however, show some signs of in vivo far red (> 700 nm) adaptation () compared to Chlorella (Ritchie & Sma-Air, Citation2020a, Citation2020b; Sma-Air & Ritchie, Citation2021) and in the shade tolerant alga Trentepohlia (Ritchie & Heemboo, Citation2021) but this far-red absorption did not increase in cells grown under very dim light for over 2 months. The spectrum stripping technique ( and ) show that the alga is a Chl a + b organism albeit with a rather low Chl b content (Chl b/a range ≈ 0.18 to 0.26). There is no evidence for Chl c compounds or Chl d both of which would have shown up in the spectrum stripping method (Ritchie & Heemboo, Citation2021) and would have shown up easily in integrating sphere spectroscopy (Behrendt et al., Citation2015; Ritchie & Sma-Air, Citation2020a; Sma-Air & Ritchie, Citation2021). Based on overall mean determinations of Chl pigments, the alga had a slightly higher Chl b/a ratio grown routinely on the culture room shelves compared with those deliberately left in low light (: 0.2100 vs. 0.1909) but this difference is only marginal. This is in contrast to the endolithic marine green alga Ostreobium which has a very high Chl b content in comparison to Chl a, with Chl b often exceeding Chl a content and the Chl b/a ratio varies greatly under various culture conditions (Del Campo et al., Citation2017; Verbruggen & Tribollet, Citation2011). Two dramatic differences between the routinely grown cells and those grown in dim light were a large decrease in ETRmax and consequent decrease in the apparent photosynthetic efficiency (αo) of those grown in dim light (). We did not expect to find no large change in optimum irradiance (: 275 vs. 290 µmol quanta m–2 s–1). Naturally, we had expected cells grown in very dim light would have a much lower Optimum Irradiance (Del Campo et al., Citation2017; Fine et al., Citation2004). In culture, no crystallization of carbonate or encrustation was observed. The cells were always in fragile clumps or in short fragile chains of cells and showed almost no tendency to stick to the glass of the culture flasks (unlike typical cultures of Synechococcus and Chlorella).
show that the optimum irradiance (Eopt) was about 250 to 300 µmol photons m–2 s–1 and shows that it was little affected by the pH of the medium. The optimum irradiance was therefore somewhat higher than the irradiance on the growth room shelves on which it was grown (≈ 150 µmol photons m–2 s–1 PPFD). The optimum irradiance for this alga as grown in our laboratory is not exceptional. It should be noted, however, that Chlorococcum sp are also capable of living under very low irradiance regimes, for example in limestone caves illuminated for tourism where they can become a nuisance alga (Smith & Olson, Citation2007) and are typical components of the endolithic green band in limestones, travertines and stonework (Bellinzoni et al., Citation2003; Freytet & Verrecchia, Citation1998; Gaylarde et al., Citation2012; Hodač et al., Citation2015; Macedo et al., Citation2009; Norris & Castenholz, Citation2006) where it would experience very low irradiances (Matthes et al., Citation2001). Some cyanobacteria growing in comparable dim light limestone habitats have Chl f (Behrendt et al., Citation2015) but we found no evidence for Chl d or f.
That is why some experiments were run in this study on Chlorococcum cultures deliberately grown under very dim light (≈3 µmol photons m–2 s–1 PPFD) (, and see Supplementary fig. S3). It was expected that such cells would have substantial changes in Chl b/a ratio as well as changes in optimum irradiance (Eopt) and ETRmax. There were substantial decreases in ETRmax and photosynthetic efficiency (Alpha, α0) reflecting an increase in Chl content that was obvious from the darker appearance of the cultures but almost no change in Chl b/a ratio. The lack of change in the optimum irradiance compared with the alga grown on the lighted shelves shows that when grown in dim light Chlorococcum does not change the shape of its P vs. E curve but simply manufactures more Chl per cell. As pointed out in the Materials and Methods care needs to be taken not to over-interpret non-photochemical quenching (NPQ) statistics but NPQmax was much lower (< 90%) in the cells grown in dim light and the ½ point irradiance (NPQ½) for NPQ vs. Irradiance had increased. This suggests some important changes in the photosynthetic mechanism under dim light.
Carbon concentrating mechanisms (CCM) are more or less ubiquitous in non-acidic aquatic photo-organisms and so the result shown in which show that constitutively the alga was able photosynthesize well under conditions where only HCO3– was available as a carbon source is not surprising (Raven, Citation1997; Raven, Giordano, Beardall, & Maberly, Citation2011). The cells were able to use CO2 and HCO3 – as carbon sources (Raven et al., Citation2005). However, shows that the response of ETR to extracellular pH was unusual compared with some other algae. The alga had very high ETR at pH 4 & 5 as well as at pH 8 but only at higher pH there was a lowering of ETR. At pH 10, the ETR was the lowest but the Eopt was not greatly different in alkaline pH and so the shape of the ETR vs. Irradiance curves seem to be not affected much by external pH even though the magnitude of ETR at pH 10 was lower. All the experiments were run in BG-11 Phosphate buffer and so this result cannot be due to the effect of different types of buffers. A more usual result in such classical Steemann-Nielsen type experiments (Maberly & Spence, Citation1983; Verma et al., Citation2009) is for photosynthesis of CO2/HCO3 – users to be maximal in acid pH with a point of inflection in the near-neutral pH range and a lower, but nevertheless substantial photosynthesis, in alkaline pH. A contributing factor for the high photosynthesis in alkaline pH might be that the routine 2 h incubation allowed time for the cells to activate a CO2 concentrating mechanism. The short incubation time was chosen to try to avoid such activation. The ETR vs. pH experiment shows that the alga is capable of photosynthesis where free CO2 is not available and has a strong CO2-concentrating mechanism (CCM) (Pernice et al., Citation2020; Raven et al., Citation2005; Verma et al., Citation2009). There are many carbonate-resident algae that are neither calcifiers or carbonate-boring algae (Del Campo et al., Citation2017; Hodač et al., Citation2015). If the CCM was driven by the proton or Na+ electrochemical gradient incubating cells in high [K+] at pH 9 where negligible free CO2 would have been available () should have led to a large decrease in photosynthesis. The results shown in show that high [K+] did not decrease photosynthesis substantially. We conclude that although Chlorococcum is likely to have some type of CCM mechanism that is not dependent on Pmf or Namf.
This algae appears to be an endolithous homiochlorophyllous organism (). Not requiring synthesis of new Chl after desiccation is characteristic of homiochlorophyllous photosynthetic organisms (Ritchie & Heemboo, Citation2021). The recovery response of the travertine alga to desiccation was slower than observed in the terrestrial alga Trentepohlia sp (Ritchie & Heemboo, Citation2021), in the encrusting lichen Dirinaria picta (Ritchie, Citation2014) or in the epiphytic resurrection fern Davallia angustata (Quinnell, Howell, & Ritchie, Citation2017) but an interesting observation was the apparent increase in the Chl b/a ratio of the desiccated alga compared with the controls () and undesiccated algae (). This suggests that synthesis of new Chl b occurs upon rehydration. Endolithic algae in normally dry travertine rock (Norris & Castenholz, Citation2006) and stonework (Bellinzoni et al., Citation2003; Gaylarde et al., Citation2012) would be metabolically inactive most of the time and only active when ephemerally hydrated by dewfall or rainfall.
As pointed out in the Introduction it may be difficult to determine if an endolithic alga is a contributor to calcification or not. We found no evidence of calcification of the alga in culture. It did not grow in acid media suggesting it is not a carbonate-boring species. Thus, this species is endolithic but does not appear to either obviously contribute to calcification nor does it appear to be a carbonate-boring alga (Pentecost, Citation2005; Pentecost & Viles, Citation1994).
Chlorococcum may have biotechnological potential. Physically, chloroccalean algae are promising candidates for biotechnological purposes because they are unicellular and the unique features of their life cycle means that they do not readily grow out of immobilization matrices such as Ca-alginate (de Jesus, Bastos, & Altenhofen Da Silva, Citation2019; Mallick, Citation2002; Moreno-Garrido, Citation2008). Chlorococcum appears to be promising biotechnologically because it lives lithotrophically, is desiccation resistant (dry storage?) and is easily grown in minimal, undemanding, culture media. Some strains such as the strain used in the present study are tolerant of very low irradiances making them very suitable for growth in a bioreactor (Smith & Olson, Citation2007).
Supplemental Material
Download PDF (130.8 KB)Acknowledgments
The Faculty of Environment and Technology of Prince of Songkla University-Phuket provided access to the facilities for the project as part of their policies of promoting environmental programmes in Southern Thailand. The Andaman Environment and Natural Disaster Research Centre (ANED) PSU-Phuket also provided facilities and support. The alga was identified as Chlorococcum sp. by Ms. Chutima Klayprayoon and Mr. Sophon Sirisattha (Biodiversity Research Centre, Thailand Institute of Scientific and Technological Research, Pathum Thani, Thailand, Report No. A-2564/005 (E)). The photos provided as attachments were kindly provided by the Biodiversity Research Centre.
Disclosure statement
No potential conflict of interest was reported by the author(s).
Supplementary material
Supplemental data for this article can be accessed here.
Additional information
Funding
References
- Allen, M. M. (1973). In J. R. Stein (Ed.), Methods for cyanobacteria. In Handbook of phycological methods: Culture methods and growth measurements (pp. 127–138). Cambridge: Cambridge University Press.
- Behrendt, L., Brejnrod, A., Schliep, M., Sørensen, S. J., Larkum, A. W. D., & Michael Kühl, M. (2015). Chlorophyll f-driven photosynthesis in a cavernous cyanobacterium. The ISME Journal, 9, 2108–2111.
- Beilby, M. J. (1986). Factors controlling the K+ conductance in Chara. Journal of Membrane Biology, 93, 187–193.
- Bellinzoni, A. M., Caneva, G., & Ricci, S. (2003). Ecological trends in travertine colonisation by pioneer algae and plant communities. International Biodeterioration & Biodegradation, 51, 203–210.
- Brestic, M., & Zivcak, M. (2013). PSII fluorescence techniques for measurement of drought and high temperature stress signal in plants: Protocols and applications. In R. G.r. & A. B. Das (Eds.), Molecular stress physiology in plants (pp. 87–131). Dordrecht, The Netherlands: Springer.
- Britto, D. T., & Kronzucker, H. J. (2008). Cellular mechanisms of potassium transport in plants. Physiologia Plantarum, 133, 637–650.
- Cochran, W. G., & Snedecor, G. W. (1989). Statistical methods (8 th ed., pp. 503). Ames: Iowa State University Press.
- de Jesus, G. C., Bastos, R. G., & Altenhofen da Silva, M. (2019). Production and characterization of alginate beads for growth of immobilized Desmodesmus subspicatus and its potential to remove potassium, carbon and nitrogen from sugarcane vinasse. Biocatalysis and Agricultural Biotechnology, 22, 101438.
- Del Campo, J., Pombert, J.-F., Šlapeta, J., Larkum, L., & Keeling, P. J. (2017). The ‘other’ coral symbiont: Ostreobium diversity and distribution. The ISME Journal, 11, 296–299.
- Fine, M., Steindler, L., & Loya, Y. (2004). Endolithic algae photoacclimate to increased irradiance during coral bleaching. Marine & Freshwater Research, 55, 115–121.
- Freytet, P., & Verrecchia, E. P. (1998). Freshwater organisms that build stromatolites: A synopsis of biocrystallization by prokaryotic and eukaryotic algae. Sedimentology, 45, 535–563.
- Gaylarde, C. C., Gaylarde, P. M., & Neilan, B. A. (2012). Endolithic phototrophs in built and natural stone. Current Microbiology, 65, 183–188.
- Golterman, H. L., Clymo, R. S., & Ohnstad, M. A. M. (1978). Methods for physical and chemical analysis of fresh waters. In IBP handbook No 8, 58 – 64 & 186–194 (p. 231) Oxford, UK: Blackwell Scientific Publ.
- Hak, K., Ritchie, R. J., & Dummee, V. (2019). Bioaccumulation and physiological responses of the coontail, Ceratophyllum demersum exposed to copper, zinc and in combination. Ecotoxicology and Environmental Safety, 189, 110049.
- Hodač, L., Brinkmann, N., Mohr, K. I., Arp, G., Hallmann, C., Ramm, J., … Friedl, T. (2015). Diversity of microscopic green algae (Chlorophyta) in calcifying biofilms of two karstic streams in Germany. Geomicrobiology Journal, 32, 275–290.
- Maberly, S. C., & Spence, D. H. N. (1983). Photosynthetic inorganic carbon use by freshwater plants. Journal of Ecology, 71, 705–724.
- Macedo, M. F., Miller, A. Z., Dionísio, A., & Saiz-Jimenez, C. (2009). Biodiversity of cyanobacteria and green algae on monuments in the Mediterranean Basin: An overview. Microbiology, 155, 3476–3490.
- Mallick, N. (2002). Biotechnological potential of immobilized algae for wastewater N, P and metal removal: A review. BioMetals, 15, 377–390.
- Matthes, U., Turner, S. J., & Larson, D. W. (2001). Light attenuation by limestone rock and its constraint on the depth distribution of Endolithic algae and cyanobacteria. International Journal of Plant Sciences, 162, 263–270.
- Millero, F. J. (1979). The thermodynamics of the carbonate system in seawater. Geochimica et Cosmochimica Acta, 43, 1651–1661.
- Moreno-Garrido, I. (2008). Microalgae immobilization: Current techniques and uses. Bioresource Technology, 99, 3949–3964.
- Nichols, H. W. (1973). Growth media – Freshwater. In J. R. Stein (Ed.), Handbook of phycological methods: Culture methods and growth measurements (pp. 7–24). Cambridge: Cambridge University Press.
- Norris, T. B., & Castenholz, R. W. (2006). Endolithic photosynthetic communities within ancient and recent travertine deposits in Yellowstone National Park. FEMS Microbiological Ecology, 57, 470–483.
- Pentecost, A. (2005). Travertine (pp. 448). Berlin-Heidelberg: Springer-Verlag.
- Pentecost, A. (2011). Some observations on travertine algae from Stjáni hot spring, Lýsuhóll, Iceland. Nordic Journal of Botany, 29, 741–745.
- Pentecost, A., & Viles, H. (1994). A review and reassessment of travertine classification. Géographie physique et Quaternaire, 48, 305–314.
- Pernice, M., Raina, J.-B., Rädecker, N., Cárdenas, A., Pogoreutz, C., & Voolstra, C. R. (2020). Down to the bone: The role of overlooked endolithic microbiomes in reef coral health. The ISME Journal, 14, 325–334.
- Porra, R. J. (1991). Recent advances and reassessments in chlorophyll extraction and assay procedures for terrestrial, aquatic and marine organisms, including recalcitrant algae. In H. Scheer (Ed.), Chlorophylls (pp. 31–57). Boca Raton: CRC Press.
- Porra, R. J. (2011). A proven simultaneous equation assay for chlorophyll a and b using aqueous acetone and similar assays for recalcitrant algae. In S. Roy, C. A. Llewellyn, E. S. Egeland, & G. Johnsen (Eds.), Phytoplankton pigments: Characterisation, chemotaxonomy and applications in oceanography (pp. 366–371). Cambridge, UK: Cambridge University Press. Appendix 8A. SCOR-UNESCO 2011.
- Quinnell, R., Howell, D., & Ritchie, R. J. (2017). Photosynthesis of an epiphytic resurrection fern Davallia angustata (Wall, ex Hook. & Grev.). Australian Journal of Botany, 65, 348–356.
- Raven, J. A. (1997). Inorganic carbon acquisition by marine autotrophs. Advances in Botanical Research, 27, 85–209.
- Raven, J. A., Ball, L. A., Beardall, J., Giordano, M., & Maberly, S. C. (2005). Algae lacking carbon-concentrating mechanisms. Canadian Journal of Botany, 83, 879–890.
- Raven, J. A., Giordano, M., Beardall, J. & Maberly, S. C. (2011). Algal and aquatic plant carbon concentrating mechanisms in relation to environmental change. Photosynthesis Research, 109, 281–296.
- Ritchie, R. J. (2008). Fitting light saturation curves measured using PAM fluorometry. Photosynthesis Research, 96, 201–215.
- Ritchie, R. J. (2014). Photosynthesis in an encrusting lichen (Dirinaria picta (Sw.) Schaer. ex Clem., Physiaceae) and its symbiont, Trebouxia sp, using PAM fluorometry. International Journal of Plant Sciences, 175, 450–466.
- Ritchie, R. J. (2018). Measurement of chlorophylls a and b and Bacteriochlorophyll a in organisms from hypereutrophic auxinic waters. Journal of Applied Phycology, 30, 3075–3087.
- Ritchie, R. J., & Heemboo, M. (2021). Trentepohlia sp., a terrestrial chlorophyte growing on galvanised iron lamp posts. Phycologia, 60, 48–61.
- Ritchie, R. J., & Runcie, J. W. (2014). A portable reflectance-absorptance-transmittance (RAT) meter for vascular plant leaves. Photosynthetica, 52, 614–626.
- Ritchie, R. J., & Sma-Air, S. (2020a). Solvent-free chlorophyll spectrometry in unicellular algal research. Journal of Applied Phycology, 32, 2711–2723.
- Ritchie, R. J., & Sma-Air, S. (2020b). Using integrating sphere spectrophotometry in unicellular algal research. Journal of Applied Phycology, 32, 2947–2958.
- Ritchie, R. J., Sma-Air, S., & Phongphattarawat, S. (2021). Using DSMO for chlorophyll spectroscopy. Journal of Applied Phycology, 33, 2047–2055. published on-line Jan 2021.
- Schlichter, D., Zscharnack, B., & Krisch, H. (1995). Transfer of photoassimilates from endolithic algae to coral tissue. Naturwissenschaften, 82, 561–564.
- Shiraishi, F., Bissett, A., de Beer, D., Reimer, A., & Arp, G. (2008). Photosynthesis, respiration and exopolymer calcium-binding in biofilm calcification (Westerhöfer and Deinschwanger Creek, Germany. Geomicrobiology Journal, 25, 83–94.
- Sma-Air, S., & Ritchie, R. J. (2020). Photosynthesis in a Vanda sp orchid with Photosynthetic Roots. Journal of Plant Physiology, 251, 153187.
- Sma-Air, S., & Ritchie, R. J. (2021). Spectrofluorometric insights into the application of PAM fluorometry in photosynthetic research. Photochemistry and Photobiology, 97, 991–1000.
- Smith, T., & Olson, R. (2007). A taxonomic survey of lamp flora (Algae and Cyanobacteria) in electrically lit passages within Mammoth Cave National Park, Kentucky. International Journal of Speleology, 36, 105–114.
- Verbruggen, H., & Tribollet, A. (2011). Boring algae. Current Biology, 21, R876–R877.
- Verma, V., Bhatti, S., Huss, V. A. R., & Colman, B. (2009). Photosynthetic inorganic carbon acquisition in an acid-tolerant, free-living species of Coccomyxa (Chlorophyta). Journal of Phycology, 45, 847–854.
- Vollenweider, R. A. (1974). Primary production in aquatic environments. In IBP handbook No 12, 54–59 (pp. 242). London: Blackwell Scientific Publ.
- Zar, J. H. (2014). Biostatistical analysis (5th ed., pp. 761). Edinburgh Gate, Harlow, England, UK: Pearson New International Edition Pearson.