
ABSTRACT
Change in mangrove extent and condition has potential consequences for social disparity in terms of who can adapt to change in ecosystem services and places perceived important for providing them. Participatory GIS can elicit spatial variation in the importance attached to ecosystem service places, but disaggregated research that can reveal difference over the small spatial extents often covered by mangroves is underdeveloped. Using mixed-methods (quantitative, qualitative and spatial) in a rehabilitated mangrove system in Vietnam, this study assesses if and why perspectives about ecosystem services and their providing places vary among households with different capacities to adapt to mangrove change.Three household groups with different adaptive capacities were characterised using quantitative adaptive capacity indicators, demographic and economic data, and trajectory interviews spanning three decades: accumulating, coping and flexible households Coastal protection was identified as beneficial by all, and sediment, habitat provisioning and food services were also frequently associated with mangroves. Only food was identified significantly more or less by different groups. Spatial hotspots generated for each group by quantifying overlap in places perceived important for providing these four services, revealed greatest difference in locations important for food. Interviews indicated change in the characteristics of mangrove localities and different abilities to adapt to them enabled some households to prosper while others struggled. We consider adaptive capacities that helped temper mangrove change, and who might be most impacted by continuing change. We conclude by identifying ways forward for rehabilitation strategies centred on local people’s differential adaptive capacity and multiple ecosystem service needs.
EDITED BY:
Introduction
The latest global assessment by the IPBES (Citation2019) highlights the increasing urgency with which the challenge of fostering sustainable and resilient socioecological systems needs to be addressed, particularly if ecosystem services (ESs) are to continue to underpin the livelihoods and wellbeing of current and future generations. Mangroves present a socioecological system that has seen particularly concerning changes globally in terms of extent, habitat quality and ESs provision (Quinn et al. Citation2017; Friess et al. Citation2019). Estimates quantifying losses vary but indicate up to one-third of global mangrove cover may have been lost by the end of the 20th century (Valiela et al. Citation2001). Deforestation continues, particularly in Southeast Asia (Gandhi and Jones Citation2019), although rates of loss are declining (Hamilton and Casey Citation2016) being offset in some places by mangrove regeneration (Giri et al. Citation2015) often as a result of restoration and rehabilitation.
Millions of people benefit from mangrove ESs, including carbon sequestration (Cummings and Shah Citation2017), seed, feed and nursery grounds for inshore fisheries (Nagelkerken et al. Citation2008), and resources that contribute to subsistence and cash economies (Orchard et al. Citation2015). ESs are produced when people acknowledge the value of ecosystem processes and functions, and invest time, energy, financial resources and/or cognition to obtain benefits from them (Haines-Young and Potschin Citation2010). In Vietnam, it has been estimated that mangroves protect around seven million people and over 3,000 km2 of land from flooding (Menéndez et al. Citation2020), which is attributed in large part to concerted rehabilitation efforts. Hai et al. (Citation2020) calculate that nearly 200,000 ha of mangroves were planted between 1975 and 2018, with objectives in most initiatives since at least 1990 including coastal protection and/or climate change adaptation. Planting mangroves for these purposes can benefit coastal communities by providing protection services that reduce vulnerability to climate change (Kuhl et al. Citation2020) and by the provision of concomitant ESs (e.g. Walton et al. Citation2006; Ahammad et al. Citation2013; Das Citation2017). However, resulting changes to the mangrove landscape can have differential consequences at local scales because ESs benefits are not received equally by individuals or societal groups (Orchard et al. Citation2015; Chaudhary et al. Citation2018), nor do people adapt to change in similar ways (Goldman and Riosmena Citation2013; Cinner et al. Citation2015).
Social differences are particularly important where livelihoods and wellbeing are highly dependent on the benefits mangroves provide. The ability to take advantage of opportunities associated with ESs, and that emerge as ecosystems change, can determine the benefits that households receive, as has been shown in terrestrial reforestation projects (Byg et al. Citation2017). ESs can also influence the capacity to adapt to change (e.g. Ahammad et al. Citation2013). In this research, we consider adaptive capacities as the social and technical skills and strategies of households that are used to respond to changes in the landscape following mangrove rehabilitation and that they manifest in adaptive actions or adaptation (Smit and Wandel Citation2006). Adaptive capacity can influence the ESs available to households, and change in ESs can influence adaptive capacity. Understanding the perspectives about ESs of those with different adaptive capacities following mangrove rehabilitation can provide insights about these dynamics that may improve the social relevance of future mangrove rehabilitation schemes. Factors that can influence adaptive capacity, such as wealth and education, have been linked to ESs beneficiary perspectives, including in disaggregated studies (Rojas et al. Citation2017; Lau et al. Citation2018, Citation2019; Lhoest et al. Citation2019). However, little research has specifically examined the perspectives of households with different adaptive capacities about ESs, or the places perceived to be important for providing them. This latter focus is particularly important because perceptions about ESs and the benefits received are shaped by particular place-based contexts (Potschin and Haines-Young Citation2013).
Participatory mapping or GIS (PGIS) is increasingly used for eliciting spatial variation in socially important ESs places (Brown and Fagerholm Citation2015). However, while PGIS research indicating how social differences shape the importance of particular ESs places is growing at landscape scales (e.g. Plieninger et al. Citation2013; Darvill and Lindo Citation2015; Sherrouse et al. Citation2017; Reilly et al. Citation2018; Muñoz et al. Citation2019), it is underdeveloped at smaller spatial extents, like the areas often covered by mangrove systems. Small-scale mangrove PGIS studies are often aggregated assessments (e.g. Damastuti and de Groot Citation2019; Rakotomahazo et al. Citation2019). A review of empirical participatory GIS (PGIS) research undertaken between 1998 and 2014 shows that only two of 32 studies were conducted in areas <100 km2, and all but three locations were studied using map scales ≥1:100,000 (Brown and Fagerholm Citation2015). At these resolutions, the lack of fine detail on base maps can limit ability to identify variations over small spatial extents, and risks emphasising differences between ecosystems or land covers (e.g. Dasgupta et al. Citation2021) glossing over differences within them. Exploring differences over small spatial scales is important because research mapping ESs at multiple scales has highlighted a mismatch between local- and landscape-scale datasets, with the latter failing to reflect ESs places important locally (Burdon et al. Citation2019). Without more information from smaller areas about the importance of ESs places to those with different capacities to adapt to change, it is difficult to develop governance and management strategies at larger scales that link environmental processes and adaptation considerations to local societal needs.
Our aim is to understand if and why different ESs places in a small case study mangrove socioecological system are important to households with different capacities to adapt to changes linked to mangrove rehabilitation. This information can be used to identify who might be impacted by future changes and inform adaptation and environmental strategies connected with local concerns and priorities to sustain benefits and reduce vulnerability (Adger et al., Citation2005; Kibler et al. Citation2018). To achieve our aim, we: 1) establish how the capacity to adapt to environmental change varies among households; 2) identify which ESs are most frequently associated with mangroves by households grouped based on adaptive capacity and 3) map how ESs places are distributed across the mangrove system, determining how and why different locations are important to different groups. We provide evidence of the utility of small-scale spatial ESs assessments for understanding social differences in perspectives about ESs places, and contribute to ESs and adaptation literature by highlighting the role that the capacity to adapt to spatial change in ecosystem characteristics plays in determining ESs benefits that can be associated with mangrove rehabilitation. We use our findings to suggest leverage points for interventions to improve adaptive capacity and encourage more equitable distribution of benefits. Our findings are of global relevance because of the increasing interest in mangrove rehabilitation to provide nature-based solutions (Van Coppenolle et al. Citation2018), and the growing prominence of mangroves in ESs financing (Locatelli et al. Citation2014; Zeng et al. Citation2021).
Background
Societal capacity to adapt is a latent attribute that enables responses to actual or anticipated changes (Gallopín Citation2006) that may result from specific events (e.g. storms) or broader drivers, such as multiple and interacting stressors (e.g. climate change (Cinner et al. Citation2015), modification of ecosystems by human use (Orchard et al. Citation2015), and environmental management (including mangrove rehabilitation)). Adaptive capacities can allow households exposed and sensitive to change to reduce their vulnerability by responding to its effects, and enable resilience to be built if opportunities are recognised, managed, and harnessed in ways that maintain household functioning and enable adaptations to continued change (Smit and Wandel Citation2006). Adaptations usually reduce vulnerability, but they can also exacerbate vulnerability if actions taken at different times and in different places lead to path dependencies (Stringer et al. Citation2020). Adaptive capacity is nevertheless unevenly distributed (Adger et al. Citation2006; Brown and Westaway Citation2011). Those with less capacity to respond to change associated with mangrove rehabilitation may be heavily burdened by negative impacts, while those with greater capacity may thrive.
Determinants of adaptive capacity are multi-scalar, context specific and interdependent, making them difficult to define (Smit and Wandel Citation2006; Vincent Citation2007). Collectively, they are considered the preconditions that enable adaptive actions (Nelson et al. Citation2007), including access to assets such as financial, human, technological and environmental resources (Adger and Vincent Citation2005), the institutional, social and political contexts in which they are held (Smit and Wandel Citation2006; Pahl-Wostl Citation2009), and the agency to mobilise them by taking deliberate action (Brown and Westaway Citation2011; Spangenberg et al. Citation2014). Recently, and with a focus on coastal communities, Cinner et al. (Citation2018) synthesised research to identify five key adaptive capacity domains: access to assets, flexibility to change, ability to organise and act collectively, ability to recognise and learn from change, and agency to determine if to change. Assessments of adaptive capacity have quantified variables that can be considered indicative of one or more of the domains (e.g. assets available to households or other groups, and indicators of institutional context, trust, social capital, and recognition of impact on natural resources (Vincent Citation2007; Cinner et al. Citation2015; Mai et al. Citation2016; Huynh and Stringer Citation2018). This is often done as a single snapshot, although see Cinner et al. (Citation2015) who quantified indicators at two moments in time.
Household adaptive capacities change over time in relation to economic, social, political and institutional contexts (Smit and Wandel Citation2006). Alternative assessment approaches assess relationship trajectories between ecosystems and adaptive capacity (Ayeb-Karlsson et al. Citation2016; Hoque et al. Citation2017; Quinn et al. Citation2017) enabling consideration of change, adaptive actions, and how they and ESs are linked to social vulnerability and resilience. Using Cinner et al. (Citation2018) dimensions as our framework, we combine these approaches, quantifying adaptive capacity indicators to identify household groups with different adaptive capacity profiles in the current time period, and examining narratives of adaptations to mangrove change within each group since the commencement of a rehabilitation program in the 1980s. This approach allows us to obtain a richer understanding of the relationships between ecosystem and ESs change, adaptation and current adaptive capacities.
Methods
Study area
Vietnam is one of the few Southeast Asian countries where the dramatic rates of loss in mangrove cover seen in the second half of the 20th Century (Thanh et al. Citation2004) have more or less stabilised since the new millennium (Hamilton and Casey Citation2016; Richards and Friess Citation2016), and where mangrove rehabilitation and restoration have contributed to a net increase in forest cover despite concurrent coastal development (Eastman et al. Citation2018). The term restoration is sometimes used in mangrove research to encompass rehabilitation (e.g. Hai et al. Citation2020). Following Field (Citation1999) we distinguish the two, referring to restoration as seeking to recover original biotic community structure and species composition, and rehabilitation as aiming to increase social, economic or ecological value by partially or fully replacing or substituting ecosystem structure and function. Complex land and economic reforms since the 1980s have intensified population and production in low-lying areas, particularly the Mekong and Red River Deltas (RRD) (Thanh et al. Citation2004; Devienne Citation2006) where Vietnam’s three major mangrove systems occur (Veettil et al. Citation2019). High population densities and levels of agriculture and aquaculture have increased the need for coastal climate disaster risk mitigation, tackled in part by mangrove rehabilitation. In contrast to the multi-species plantations in the Mekong Delta where conditions favour greater diversity and natural regeneration, those in the RRD which is more exposed to storms (Thanh et al. Citation2004; Veettil et al. Citation2019), are low diversity polycultures with species selected for attributes that maximise protection (Hong and San Citation1993; International Federation of Red Cross and Red Crescent Societies (IFRC) Citation2011; Veettil et al. Citation2019).
Thai Binh Province is one of the four coastal Provinces in the RRD where the coastline has been transformed by mangrove rehabilitation and conversion to aquaculture. Social differentiation in ESs as a result of mangrove conversion to aquaculture has been demonstrated in northern Vietnam (Adger et al. Citation2001; Orchard et al. Citation2015). Yet, little is known about the influence of mangrove rehabilitation on the places different households identify as important for providing ESs. Thuy Truong, one of the 12 coastal communes in Thai Binh Province, provides an interesting case through which this can be explored. Thuy Truong comprises nine villages (Table A1). We purposely included in this case study all three that are, or were historically, located on the coast ().
Figure 1. Thuy Truong commune is located in the north of the Red River Delta, one of three important mangrove areas in Vietnam (identified in red boxes – modified from Veettil et al. Citation2019). Mangrove data derived from Hamilton and Casey (Citation2016). Image sources (acquired December 2019): Esri, DigitalGlobe, GeoEye, earthstar geographics, CNES/Airbus DS, USGS, AeroGRID, IGN, and the GIS user community.
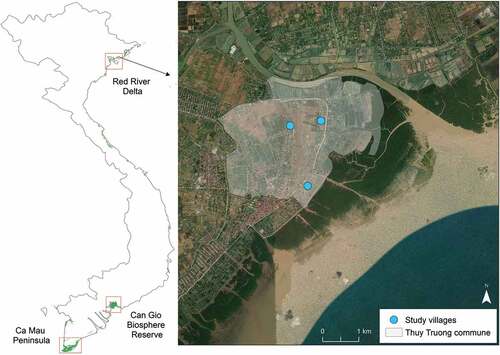
Thuy Truong contains the largest mangrove expanse in the Province. Between 1986 and 2010, the c. 5 ha of extant mangrove were supplemented by >950 ha planted primarily with two species to augment the coastal protection properties of the sea dike as part of the International Red Cross Disaster Risk Programme (International Federation of Red Cross and Red Crescent Societies (IFRC) Citation2011). Other donor-funded and Government rehabilitation programmes continued these efforts. Not all mangroves survived, but approximately 770 ha of mangrove cover was present in 2018 (Thuy Truong commune Vice Chairman, pers. communication, 2019). This included some of the last remaining old growth trees, although most were enclosed in aquaculture ponds constructed on the seaward side of the dike in parallel to planting in the 1990s (Pedersen and Nguyen Citation1996). By 2018, a total of 258 ha of ponds had been constructed, mostly from the conversion of paddy fields and salt farms on the landward side of the dike in the latter two decades. Between 2012 and 2018, clam farming increased to cover approximately 1,266 ha of mudflats, reducing local ability to access these areas. Leases for clam farms were held primarily by non-local actors rumoured to be those with the right connections and financial resources. At the time of study, pond aquaculture, rice, cash crops, and resource collection from mangroves constituted the main components of local livelihoods (Table A1).
Our methodological approach is summarised in and described in detail below.
Figure 2. Methodological approach taken, identifying links between data collection and analysis.
Data collection
Data were collected during July–December 2018 and July 2019 using mixed-methods comprising 1) village focus groups and mangrove walks; 2) household questionnaires, including a paper-based PGIS exercise; and 3) semi-structured livelihood trajectory interviews. Data collection tools (Appendix B) were developed in English and translated into Vietnamese. All data collection was conducted in Vietnamese with data translated into English for analysis, and in accordance with ethical approval.
Focus groups were held to identify the study system boundary, to develop adaptive capacity indicators, and a list of mangrove ESs to be included in a household questionnaire. These discussions were organised in groups to reduce potential conflicts, and focused on the village-level rather than individual-level to enable those raising sensitive issues, such as illegal activities, to do so generally. The first focus group discussed key livelihoods and their links to the mangrove system. Resulting notes were used in-conjunction with literature review of mangrove ESs to compile a list of potential ESs. This was discussed with participants during a second focus group where they selected, removed and/or added ESs to produce a final list and descriptions (). Two mangrove walks were also conducted with village representatives. A third focus group was held with village representatives to discuss adaptive capacity indicators identified from literature (Vietnam: Huynh and Stringer Citation2018; Mai et al. Citation2016; coastal communities: Cinner et al. Citation2015). At the end of the discussion, village heads standardised adaptive capacity indicators for use in the questionnaire (). With the exception of the last discussion between village heads, all focus groups were held with 6–8 representatives from village-level socio-political groups (the Womens’ Union, Farmers’ Cooperative, Veterans’ and Youth Associations) selected by Village Heads to represent village gradients in age, gender and wealth. All engaged with mangroves in everyday life
Table 1. ESs and descriptions included in the questionnaire. ESs were subsequently classified according to IPBES categories (Díaz et al. Citation2018)
Table 2. Indicators used to group households based on data collected during household surveys. Expressions in parentheses refer to adaptive capacity domains identified by Cinner et al. (Citation2018). AS = Assets, FL = Flexibility, SO = Social organisation, L = Learning, AG = Agency
Our questionnaire asked respondents to identify mangrove ESs providing benefits to their households and to describe them, to locate ESs places important for providing household benefits, and collected quantitative demographic, economic and adaptive capacity data. The questionnaire was piloted with 30 households to ensure content was contextually relevant and test mapping approaches. During piloting, participants struggled to identify ESs places using point features (with either pens or stickers) preferring to draw shapes (polygons) around areas they either visited or perceived to be important for the ESs from which their households benefitted. Important ESs places were therefore located using polygon features on laminated colour maps (scale 1:15,000 downloaded from Google Earth in 2018) during a PGIS exercise within the questionnaire. The questionnaire was administered face-to-face with 150 households selected randomly from village lists (every nth household) to cover c. 16% of households present in each of the three villages (Table A1). The sample was large enough to disaggregate spatial analysis given the recommended minimum of 25 participants when undertaking PGIS using polygon features (Brown and Pullar Citation2012). Respondents were requested to draw shapes around ESs places important to their household without restrictions on the number of locations or polygon size or shape. Prior to starting the PGIS exercise, each respondent’s house was located to orientate them and they were asked to locate local landmarks and physical features. Those unable to meet these requests did not complete PGIS (3/150 households) but did complete the rest of the questionnaire.
Livelihood trajectory interviews explored household accounts of and responses to mangrove and ESs change between 1983 and 2018, a period spanning the onset of mangrove rehabilitation and aquaculture promotion. Ten households were interviewed and selected purposely to include three households from each adaptive capacity group, and a fourth from the flexible household group because it was larger. All interviewees lived in the commune since 1983, except one who returned in 1990 after resettlement in the early 1980s. Interviews discussed why locations identified during PGIS were important, how historic mangrove change influenced perspectives about ESs and the importance of ESs places, and household responses to change. Questioning was facilitated by the use of the household PGIS map and Google Earth Engine maps that illustrated change in mangrove cover in 1988, 1998, 2007 and 2018. Interviews were conducted in Vietnamese. English translations were noted verbatim at the time of the interview.
Data analysis
To establish how adaptive capacities varied among households (objective 1), questionnaire and interview data were analysed. Nonlinear principal component analysis (NLPCA) and k-means cluster analysis were conducted on adaptive capacity indicator data () to group households. Depending on data type and distribution, Kruskal–Wallis, ANOVA or Pearson’s chi-square tests with Bonferroni-adjusted post hoc analyses were used on demographic and economic data to analyse associations or differences in count, mean or mean rank values between groups. Interview data were examined to gain a richer understanding of adaptive capacities within the three groups by thematically analysing change over time using five adaptive capacity domains: access to assets, flexibility to change, ability to socially organise, ability to recognise and learn from change, and agency to determine if and how to change (Cinner et al. Citation2018). This analysis enabled insights pertaining to dimensions of adaptive capacity not well captured by the indicators included in the NLPCA. Quantitative analyses were conducted in IBM SPSS Statistics for Windows, version 24 (IBM Corporation, Armonk, New York, USA). Analysis details and illustrative examples of livelihood trajectory data analysis are provided in Appendix C.
For objective 2, the frequency with which ESs were identified as benefitting households within the adaptive capacity groupings was determined by the number of times they were selected by households in each group during questionnaires. Frequencies were analysed across groups using Spearman's Rank correlations and tested for association using Pearson’s chi-squared tests and post hoc analysis. Benefits from ESs were identified by considering responses to an open-ended question about how each of the ESs contributed to the household (Appendix B, question 2.1 and 2.2 final column of table). Because the number of respondents identifying ESs as benefitting households sometimes differed from the number of respondents mapping ESs places, chi-squared tests were repeated to test for differences in the proportion of groups locating them.
Spatial data was analysed in ArcMap, version 10.4 (ESRI, Redlands, California) to determine how ESs places were distributed across the mangrove system, and to identify locations of most importance to each adaptive capacity group (objective 3). Polygons were digitised and organised according to the IPBES framework (Díaz et al. Citation2018) and adaptive capacity groups. Important ESs areas were identified by counting polygon overlaps separately for each of the ESs for each disaggregated group, following the approach of Martinez in Ramirez-Gomez et al. (Citation2013), and Moore et al. (Citation2017). ‘Hotspots’ were identified as areas with high densities of polygon overlap determined using a quintile cutoff approach (Alessa et al. Citation2008; Ramirez-Gomez et al. Citation2015) at two commonly used levels of conservatism: the top 67% and 90% of values (Bagstad et al. Citation2017). Mapping analysis details and data are provided in Appendix D. The Jaccard coefficient was used to directly compare the areal extent of spatial overlap in hotspots between disaggregated groups. The coefficient ranges from 0% to 100%, corresponding to no spatial overlap and complete spatial congruence. Interview and open-ended questionnaire responses were analysed inductively to identify themes explaining the importance of particular places.
Results
How does adaptive capacity vary among households?
Three household groupings were identified based on NLPCA analysis (): accumulating, coping and flexible households. They are introduced below drawing on household questionnaire and interview data. NLPCA component loadings are provided in Appendix C, alongside income source information and illustrative accounts of adaptive actions adopted by households in response to mangrove change. Adaptive actions described by those interviewed are summarised in .
Figure 3. NLPCA biplot with varimax rotation. Household adaptive capacity groupings: 1 = accumulating households, 2 = coping households, 3 = flexible households. VAF = variance accounted for.
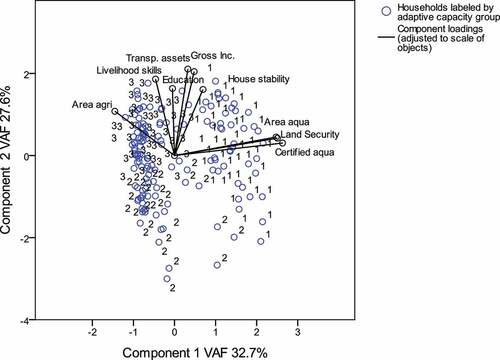
Figure 4. Change in cover of mangroves, aquaculture ponds and clam farms from 1980–2018 and corresponding adaptations by households groups. Although presented as distinct, the trajectories of the different groups interact. Expressions in parentheses refer to adaptive capacity domains identified by Cinner et al. (Citation2018). AS = Assets, FL = Flexibility, SO = Social organisation, L = Learning, AG = Agency, and are emboldened if adaptive actions are positive. Adaptations are deliberately staggered to approximate time of occurrence. Land cover data provided by Thuy Truong commune.
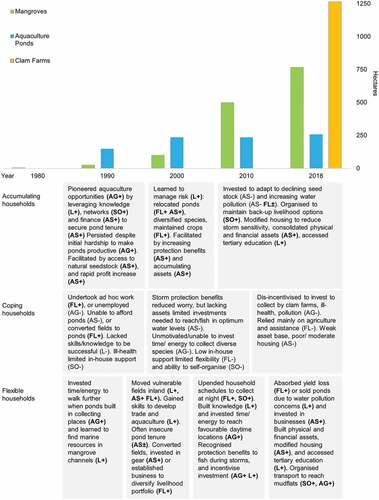
Group 1 (29% of sample): accumulating households typically had moderate/high housing stability, secondary-level formal education or above, and good access to financial and physical assets. All households had secure pond tenure, either individually held, or through collective leases shared with family or peers. The largest ponds were farmed by accumulating households. Although most households maintained backup income sources through additional livelihood activities, accumulating households specialised in aquaculture to provide the largest proportion of household income (Figure C1). Economic returns were moderate/high. Interviewed households explained how agency and ability to leverage social networks had enabled them to organise to pioneer aquaculture opportunities, and how experiential learning about protection and seedstock services over time had enabled their asset and knowledge base to be built.
Group 2 (25% of sample): coping households typically had primary or secondary-level education, housing of low/moderate stability, and only one or two types of transportation assets at their disposal. Income was moderate/low, with the lowest incomes reported by households in this group. Some owned large areas of agricultural land, and/or farmed ponds, but not all had secure pond tenure. Others did ad-hoc waged work or occasional collecting. Most relied on agriculture and remittances, compensation for disease or disability, or State aid for ‘poor’ households (Figure C1). Coping households had lived in the commune for longer (ANOVA F test 4.34, p = <0.015), had a higher mean age (ANOVA F test 12.62, p = <0.001) and a lower occupancy (Kruskal–Wallis H test 19.69, p = <0.001) than other groups. They were also more likely to be female-headed than were flexible households (chi-squared test 13.513, df 2, p = 0.001) (Table C3). Interviewed households described how pond assets deteriorated over time because of insufficient knowledge to make them productive. They also described changes in agency to adapt because of failing health, care-giving responsibilities, lacking incentive or motivation, and an external locus of control.
Group 3 (46% of sample): flexible households typically farmed large areas of agricultural land and demonstrated livelihood flexibility. Some farmed ponds, but very few had secure pond tenure. Access to abundant diverse marine resources was a valuable asset to some. In 2017, income generated from the collection of sea animals was of similar importance to that gained from other primary sources, and it contributed more to the total annual income of these households than it did to others (Figure C1). Most households had at least secondary-level formal education. Housing stability and annual income varied over a wider range than for other groups, although flexible households reported the highest annual incomes of those surveyed. Flexible households were more likely to be male-headed than were coping households (chi-squared test 13.513, df 2, p = 0.001). There was an association between this group and the village in which households lived (chi-squared test 16.087, df 4, p = 0.003); flexible households were more likely to live in village 1 than were accumulating households, and less likely to live in village 3 than other household groups (Table C3). Interviewed households described how levels of agency, learning and flexibility increased over time, explaining how ponds were sold in response to water pollution concerns, or because of reluctance to rely on a single income source, or reluctance to invest in land with insecure tenure.
Which mangrove ecosystem services were identified most frequently, by whom, and why?
Questionnaire data showed that 12 ESs were associated with mangroves, and that similar ESs were identified most frequently by all groups () (Spearman Rank correlation coefficients range .92–.98, all p = <.001). Protection from storms was identified by all respondents for providing security to the sea dike, people, and assets, and relief from fear and worry: ‘People before were really afraid of storms and strong wind because it can cause houses to collapse and other things. But now we feel more relaxed‘ (coping household). Respondents described increased stability enabling investments in homes and livelihoods: ‘In the past, my village was destroyed because there was no forest. Now everyone is stable because we are protected’ (flexible household).
Table 3. Percentage of households in each adaptive capacity group identifying mangrove ESs, and percentage of households mapping important mangrove ESs places
Food was identified second most frequently by coping and flexible households and was selected by more flexible households than expected by chance (chi-squared test 16.04, df 2, p = <.001, post hoc p = .020). Flexible households suggested collecting and fishing activities provided significant subsistence and income-generating benefits: ‘We would die if there was no forest. We depend mainly on the forest’. Food derived from the mangrove system was also critical to coping households: ‘80% of our food is seafood from the forest and mudflats’, providing nutritional, cost-saving, and convenience benefits. Fewer accumulating households stated they benefitted from this service than expected by chance (chi-squared test 16.04, df 2, p = <.001, post hoc p =<.001).
Habitat was identified more frequently than food by accumulating households (). Over one-third of households recognising it (13/37) stated mangroves provided shelter to species that naturally stock ponds from where they could conveniently obtain food items. This benefit was described by few coping and flexible households (7/82). The provision of habitat for birds was described as a benefit by households in all groups (21/37 accumulating, 16/26 coping, 45/56 flexible households). Not all were able to articulate how birds were of benefit to their household. Some described conservation status, others beauty and song.
Sediment accumulation was identified third most frequently by all groups. Respondents described benefits including continued ability to plant, nutrient enrichment for existing trees and sea animals, and increased protection from waves and flooding because of sediment aggradation: ‘In the past 10 years, when the forest keeps being expanded, land is made higher.[.]. it is even higher than in the village’ (flexible household). Some accumulating and flexible households identified expectations of future livelihood benefits.
Apart from food, significant difference was found only in the frequencies identifying medicine and learning opportunities. Coping households identified both ESs less often than would be expected by chance (learning: chi-squared test 8.23, df 2, p = .016, post hoc p = .006, medicine: chi-squared test 6.49, df 2, p = .039, post hoc p = .017). Opportunities for learning were identified by flexible households more often than expected by chance (learning: chi-squared test 8.23, df 2, p = .016, post hoc p = .038) and were often associated with food collection. Opportunities for learning, water quality regulation, spiritual association and the provision of fuel wood were associated with mangroves least frequently by all groups ().
How are the ecosystem service places distributed across the mangrove system, and how and why do places mapped differ between groups?
The results in this section are based on PGIS and open-ended questionnaire and interview responses. Spatial analysis was undertaken for the four ESs most frequently identified as providing benefits by all groups: protection, food, sediment accumulation and habitat provisioning. In total, 370 polygons were analysed, with 1 to 1.38 polygons identified on average per household within each group per ES (Table D1). The most polygons mapped were for protection and the fewest for food. ESs places were identified in mangrove forest and interlinked habitats and structures including mangrove channels, mudflats, open water, the sea dike and aquaculture ponds on its seaward side. Specific habitats and structures were linked to hotspots for particular ESs. In combination, the sea dike and adjacent mangrove trees were important for moderating storm impacts, as were trees close to ponds. Mudflats, fringing mangroves, larger mangrove channels and higher ground were linked to sediment accumulation. Channels within the forest, forest surrounding channels, and forest in proximity to access points were important for food collection, and mangroves in and around ponds were associated with habitat.
The only significant difference in the frequency of households mapping ESs between groups was for food: flexible households mapped food locations more frequently than expected (chi-squared test 17.90, df 2, p < .001, post hoc p = <.001) and accumulating and coping households less frequently (post hoc p = .033 and post hoc p = .009). This was because more flexible households collected food than expected (chi-squared test 17.97, df 2, p < .001, post hoc p = <.001) and fewer coping households collected food themselves (post hoc p = .005). Instead, they received or purchased food collected by others (chi-squared test 13.07, df 2, p = .001, post hoc p = <.001), while fewer flexible households obtained food items this way (post hoc p = .008).
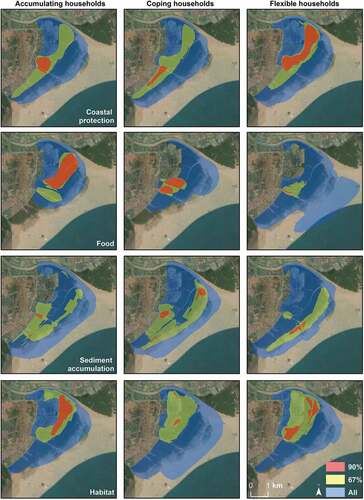
The number of polygon overlaps ranged between 4 (food) and 41 (protection) (Table D1). Places mapped and hotspots reflecting the top 67% and 90% of polygon overlaps are presented in .
Difference in hotspots between groups depended on the degree of conservatism in cutoff criteria used. Using the top 90% criteria, spatial overlap was low (Jaccard coefficient range 0–25%). Using the 67% cutoff, important protection places were highly similar for all groups (Jaccard coefficient ≥74%). Spatial overlap was above 50% for all group pairings for habitat provisioning, but less than 50% for flexible households and the other groups for sediment accumulation. Spatial overlap was below 50% for all group pairings for food. We explore the reasons for the similarities and differences below.
Food
Locations important to accumulating households for collecting food were most dissimilar to locations important to others (). Areas with the least overlap were larger mangrove channels and surrounding trees. Questionnaire and interview data revealed these were areas accessed by households owning boats, and presumably with the knowledge and fishing gear needed to catch fish and shrimp. Overlapping areas identified by all groups were channels and surrounding forest planted during the first rehabilitation programmes in the late 1980s. Interview responses indicated these trees once inhabited by diverse shellfish, crustaceans and fish were now dominated by nocturnal mangrove crabs that burrow into sediment around tree roots. Overlapping areas were also in close proximity to access points, including the dike sluice gate where respondents sold catch to vendors.
Figure 5. Hotspot maps depicting places important for food provision, storm protection, sediment accumulation and habitat provisioning by each adaptive capacity group. Hotspots are based on the frequency of overlapping polygons (90% overlap, 67% overlap, and footprint of all polygons mapped). The number of overlaps are provided in Table D.1. Image sources (acquired December 2019) esri, DigitalGlobe, GeoEye, earthstar geographics, CNES/Airbus DS, USGS, AeroGRID, IGN, and the GIS user community.
Dissimilarity between coping and flexible households, although occurring over only a few hundred metres, revealed flexible households prioritised larger mangrove channels and surrounding forest. In interviews, some described learning experientially to take advantage of shelter provided by trees to work during storms, and making investments to go fishing where water levels were more optimal and nets less likely to be snagged. Coping household hotspots included smaller channels, presumably easier to access on foot. As case 2 illustrates (Table C4), not all had the physical ability to collect in dense forest, at night, or the equipment, knowledge or agency to identify and reach locations elsewhere: the privatisation of parts of the mudflats for clam farming acted as a disincentive for this respondent. In contrast, interviewed flexible households described being undeterred, continuing to travel to mudflats, sometimes organising transportation with clam farmers, and/or the physical ability and flexibility to upend household schedules to accommodate night-time collecting regimes. They also described remaining motivated, applying knowledge accumulated from time spent in mangroves to find new places to catch species caught previously during daylight hours despite failing health: ‘My children tell me that at my age I should rest, but I have been collecting since I was small, and I tell them I won’t stop’. In 2017, coping households collected only mangrove crabs, while 34% of flexible households diversified their catch with other species from channels or further afield. Together, these factors help explain how differences in places identified by coping and flexible households as important for food at the time of study had manifested.
Sediment accumulation
All groups identified fringing mangroves and mudflats as important locations for trapping sediment, but accumulating and coping households also identified a broad area of mangroves situated closer to the land. The benefit most often associated with sediment accretion there was protection of assets, and the areas identified as hotspots for each group corresponded to the distribution of their houses, fields and ponds. Additional reasons for differences related to knowledge developed experientially about erosional and depositional processes ‘For land, it’s made around that area. It isn’t made on the other side of the sluice because of erosion’ (flexible household), which influenced ability to access benefits: ‘This place has more crabs […] because the soil is nutritious for them and it is soft too, so it is easy for the crab to dig a hole. The area to the west contains more sand. Near the river is more water, so more fish. My area has more crabs’ (coping household).
Habitat
Habitat provisioning hotspots covered the same general area of older trees close to ponds for all groups (). Areas with the least overlap were inside ponds. Accumulating household hotspots were located in trees surrounding ponds and were associated with the provision of aquaculture seedstock: ‘The mangroves provide shelter for many, many types of sea animals, and because the ponds are inside the mangroves many go there’ (accumulating household). In interviews, it was described how this was a substantial benefit in the 1990s because seedstock that naturally flowed into ponds reduced aquaculture start-up costs (). As case 1 (Table C4) illustrates, households can no longer rely on freely provided seedstock due to reductions attributed to pollution from clam farms and industry, resource collection, and the prograding coastline, and have to draw on financial, physical and human resources to purchase or catch species to stock ponds. Habitat provisioning hotspots for coping and flexible households included old growth trees enclosed inside ponds, and they described habitat for birds when talking about these locations. Accumulating households indicated trees surrounding rather than within ponds were important for birds.
Protection
Protection hotspots at the 67% cut off showed high levels of overlap (). Numerous respondents agreed the older trees in these locations were better able to protect against the biggest waves and wind because of tree height, dense branches and roots: ‘Those near the dike are the oldest, the highest and the strongest, so they can protect better’ (coping household). Differences at the most conservative cutoff reflected a combination of understanding about the properties of different age trees and the location and perceived vulnerability of the dike and assets: ‘This area blocks around the dike and that is why I chose that area, because it protects people and the dike. My family have a pond there and it protects the pond’ (accumulating household).
Discussion
In common with other coastlines where high population density, production and potential for mangrove rehabilitation coincide (Iftekhar and Islam Citation2004; Triyanti et al. Citation2017), planting in Thuy Truong was driven by national objectives to adapt to climate change with the expectation that enhanced coastal protection against storms would increase the resilience of coastal livelihoods (Veettil et al. Citation2019). All 150 households recognised protection services and agreed that mangroves had increased the security of their lives, assets and the sea dike despite significant storm impacts in the RRD in recent years (Neumann et al. Citation2015). This lends weight to estimates that mangroves provide considerable flood protection benefits in Vietnam (Menéndez et al. Citation2020) and is consistent with the views of particular ESs as adaptation services (Colloff et al. Citation2020; Lavorel et al. Citation2020). The results also show clear evidence of additional benefits, particularly those arising from food, habitat, and sediment ESs. However, although no household expressed a desire to return to a time when the forest was smaller and storm impacts less, there were differences between groups linked to perceived ESs providing places, particularly for food, for which the greatest differences in the ESs we assessed spatially were apparent. Here, to gain insights about who might be most vulnerable to future change, we discuss these differences in relation to past adaptations to change resulting from mangrove rehabilitation. This has global relevance given wide-scale interest in mangrove rehabilitation for nature-based solutions (Van Coppenolle et al. Citation2018) and the increasing prominence of mangroves in climate change mitigation (Locatelli et al. Citation2014), but particularly in Vietnam because of recent targets to plant one billion trees between 2021 and 2025 (Decision No. 524/QD-TTg) with priority in coastal areas given to protection forests.
Data suggested differences observed for food were a product of historic interactions between change in place-based characteristics resulting from the transforming mangrove ecosystem, capacities to adapt, subsequent subsistence and income benefits, and feedbacks. Encouraged by latent protection and habitat ESs, accumulating households realised pond aquaculture opportunities which substituted food benefits gained previously from mangroves, and/or increased the importance of locations navigable using boats. This was often possible because changing ESs enabled these households to accumulate assets and build capacity in other domains, including knowledge about how to maximise protection and seedstock benefits, and determination to succeed. Flexible households found new food places when species distribution shifted with changing sediments and water levels, or when locations were lost to ponds by drawing on agency, assets, and knowledge built experientially. As for accumulating households, accruing benefits from changing ESs enabled these households to build their capacities, particularly livelihood flexibility.
Patterns of benefit change linked to livelihood adaptation trajectories are not unexpected given income-generating benefits from mangrove foodstuffs offer a low-cost livelihood diversification option (Orchard et al. Citation2015), and dependence on mangroves for income often reduces with increasing engagement in aquaculture (Mohammad Abdullah et al. Citation2016). More unexpected was the reduction in income benefits for coping households, because they can provide an important safety-net for vulnerable groups enabling coping strategies to be developed (Singh et al. Citation2010; Orchard et al. Citation2015), including where mangroves have been planted (Chow Citation2018). Studies in a mangrove plantation and a Ramsar site in Myanmar, for example, showed that the greatest income share from mangrove resources was obtained by the poorest households (Feurer et al. Citation2018) and those with the lowest education levels and livelihood diversity (Aye et al. Citation2019). This can occur because mangrove food items such as crabs and clams can be dug by hand or caught using inexpensive traps or sticks by those with little financial capital (Mohammad Abdullah et al. Citation2016; Huxham et al. Citation2017). Our findings show that this is not always the case. While some coping households were able to continue collecting, fewer than expected did.
Building on studies in Senegal where mangrove reforestation restricted the use of traditional shellfish areas lost to tree growth (Cormier-Salem and Panfili Citation2016), and plantation structure prevented navigation by canoes and boats (Cormier-Salem Citation2017), our results identified adaptation to physical changes in rehabilitated mangrove localities as a key driver of food benefit change. Physical exclusion was a contributory factor because ponds and clam farms reduced accessible mangrove and mudflat areas. However, whilst most coping households were able to respond when mangroves were lost to ponds in parallel to early rehabilitation activities by moving to nearby areas, clam farms exacerbated health, time and asset limitations that accrued incrementally as mangroves expanded, disincentivising coping households still able or willing to travel to mudflats. In contrast, flexible households acquired boats or negotiated rides with clam farmers, and/or altered collection strategies to gather newly abundant mangrove crabs within the rehabilitated forest at night. These options were less available to coping households that lacked assets, had caring responsibilities, less household support, and/or physical inability to navigate densely planted trees and accreting sediments due to failing health. Over time, coping households became more reliant on purchased or gifted items for subsistence benefits. Income-generating benefits were reduced or removed, locking households into trajectories that manifested in eroded adaptive capacity (Juhola et al. Citation2016) and limited future choices (e.g. reliance on assistance and ad-hoc waged work). Le (Citation2006) also found social disparities in income generation from rehabilitated mangroves elsewhere in the RRD, where older females were restricted from collecting at night due to poor eyesight. It is noteworthy that the importance of the mangrove system for food for coping households at the time of study largely depended on the ability of other households to collect resources. This dependency suggests coping households may be particularly impacted if future change reduces the importance of food collection places, as may result from pollution or access restrictions, and/or the capacities of the households that sustain the supply chain.
Our findings may have been enriched by conducting more trajectory interviews per group. However, narratives collected provided important insights about capacities used to achieve adaptive actions that can be informative for the development and measurement of strategies to facilitate social adaptation (Whitney et al. Citation2017). Considering food, flexible households learned experientially where and when to find new and preferred species. They developed new collection methods and organised themselves to enable night-time collecting. Efforts to facilitate knowledge and skill sharing about changing localities and species, and building assets, infrastructure and social networks to increase access to them through resource pooling, cost sharing and support mechanisms for those with caring responsibilities and/or low household occupancy (Cinner et al. Citation2012; Blythe et al. Citation2014; Mialhe et al. Citation2019) may reduce barriers that constrained adaptive action for some. This includes building individual agency and others support of it (Brown and Westaway Citation2011). The focus of our study was village households. However, other actors influence adaptive capacity and ESs benefits through support or conflict. Clam farmers were sometimes mentioned by our participants (e.g. restricting physical access, offering boat rides). A more holistic understanding of the interactions and feedbacks between ESs and adaptation and of how future adaptive capacities may be built would be gained by examining in depth the relationships between village households and other actors.
In northern Vietnam, rehabilitation strategies have prioritised rapid mangrove growth to attenuate wave height using few species with characteristics that maximise protection-specific properties such as denser aerial roots (Hai et al. Citation2020). Although this strategy has conferred protection and additional benefits to households, more equitable distribution may be possible if rehabilitation is designed by foregrounding disaggregated spatial local ESs knowledge and needs in relation to multiple rather than singular ESs (Abelson et al. Citation2016; Zimmer Citation2018) and adaptively managed (Ellison et al. Citation2020). PGIS is important in this respect. It has already gained recognition in the literature as a tool for disaggregated ESs evaluation (e.g. Darvill and Lindo Citation2015; Muñoz et al. Citation2019). We used this approach to identify differences in characteristics that can change over small spatial scales in mangroves and which would likely have been masked at map resolutions >1:30,000, where 1 cm on the map equates to 300 m on the ground. The number of points mapped per service per participant was lower than reported in PGIS conducted at larger spatial scales (e.g. Moore et al. Citation2017) and the group size was uneven, which may have had a bearing on our results. However, spatial congruence in polygon overlap was in the range of studies with higher mapping rates, and we triangulated outputs from hotspot analysis and interviews, which increased our confidence in findings.
Emphasis on spatial ecological and structural complexity that includes characteristics important locally (e.g. in our case study, low-density multi-species stands that can provide productive habitats for diverse species) also aligns with calls for reforestation to prioritise ecosystem heterogeneity to enhance attributes that underpin ecological resilience (Seddon et al. Citation2019). Socioecological rehabilitation of resilient mangroves that embraces place attachments (Kibler et al. Citation2018) may better sustain not only important benefits (Gamfeldt et al. Citation2013) but also adaptation services (Lavorel et al. Citation2020). These recommendations may gain significance in Vietnam if interest in mangrove payments for ESs is realised, particularly because Vietnam’s updated Nationally Determined Contributions (NDCs) continue to emphasise planting mangroves as coastal defence for climate change adaptation (UNFCCC Citation2022). Similar policies are being enacted across mangrove regions. Gallo et al. (Citation2017) found that mangrove management plans, conservation, and restoration have been included in 45 NDCs, and as both climate change adaptation and mitigation measures. Projected increases in coastal flooding (Kirezci et al. Citation2020), and the potential for blue carbon financing to help achieve climate change mitigation commitments (Zeng et al. Citation2021) suggests increased future impetus for mangrove planting projects. With this in mind, our findings and recommendations are relevant across mangrove regions, particularly given growing concern about the lack of consideration of locally important mangrove benefits in the implementation of international policies and ESs financing (Locatelli et al. Citation2014; Cormier-Salem Citation2017; Song et al. Citation2021).
Conclusions
It is not only critical to consider which ESs provide benefits but also where ESs are considered to arise from, to whom and why these patterns emerge. Our findings underline that small-scale PGIS ESs assessments are important for understanding social differences in the distribution of benefits valued locally. Mangroves are being rehabilitated across their range to provide ESs that can help coastal communities adapt to climate change and other stressors. Data presented here illustrate that this strategy can provide broad protection and additional ESs, even if planting is not designed with the ecosystem properties and functions that underpin them in mind. However, differential household capacities to respond to associated changes in mangrove localities result in less desirable consequences for some, and can amplify over time with continued mangrove growth and interactions with concomitant developments. Mangrove socioecological systems are dynamic and connected to broader habitat and land uses that are likely to experience increasing change. Careful consideration is needed about how interventions might modify place-based ecosystem properties and how the impact of such changes can be mediated by building adaptive capacities. Delivery of ESs and associated benefits is linked not only to ecological structure and function but to social factors including the capacity to adapt to change in ESs providing places. Mangrove rehabilitation efforts may be more widely beneficial and promote adaptation if they centre on local people’s differential adaptive capacity and multiple, interacting ESs needs.
Credit authorship contribution statement
Rachael Carrie: Conceptualization, Data curation, Methodology, Investigation, Formal analysis, Visualisation, Writing – original draft, Writing – review & editing. Lindsay Stringer: Conceptualization, Methodology, Writing – review & editing, Funding acquisition. Le Thi Van Hue: Methodology, Investigation, Writing – review & editing, Funding acquisition. Nguyen Hong Quang: Formal analysis, Writing – review & editing. Dao Van Tan: Writing – review & editing, Funding acquisition. Christopher Hackney: Writing – review & editing, Funding acquisition. Pham Thi Thanh Nga: Writing – review & editing, Funding acquisition. Claire Quinn: Conceptualization, Methodology, Writing – review & editing, Funding acquisition.
Supplementary Materials
Download PDF (969.4 KB)Acknowledgements
We are grateful to the following for their contribution to this research: all study participants and local officials in Thuy Truong commune, Tran Thu Phuong, Tran Anh Lanh, Nguyen Thị Tam, and Hoang Hai Duong. We thank anonymous reviewers for their comments on the manuscript. This research was permitted by the Immigration Department of Vietnam, and government officials in Thai Binh Province, Thai Thuy District and Thuy Truong commune, and approved by the ESSL, Environment and LUBS (AREA) Faculty Research Ethics Committee at the University of Leeds (AREA 17-112). Informed consent was obtained from all participants prior to data collection.
Disclosure statement
No potential conflict of interest was reported by the author(s).
Data availability statement
The data that support the findings of this study are available in Reshare at https://reshare.ukdataservice.ac.uk/854718/
Supplementary material
Supplemental data for this article can be accessed online at https://doi.org/10.1080/26395916.2022.2083237.
Additional information
Funding
References
- Abelson A, Halpern BS, Reed DC, Orth RJ, Kendrick GA, Beck MW, Belmaker J, Krause G, Edgar GJ, Airoldi L, et al. 2016. Upgrading marine ecosystem restoration using ecological-social concepts. Bioscience. 66:156–163. doi:10.1093/biosci/biv171
- Adger WN, Kelly PM, Nguyen HN, editors. 2001. Living with Environmental Change. Social vulnerability, adaptation and resilience in Vietnam. Oxon: Routledge.
- Adger WN, Hughes TP, Folke C, Carpenter SR, Rockström J. 2005. Social-Ecological resilience to coastal disasters. Science. 309(5737):1036–1039. doi:10.1126/science.1112122.
- Adger WN, Vincent K. 2005. Uncertainty in adaptive capacity. Comptes Rendus Geosci. 337(4):399–410. doi:10.1016/j.crte.2004.11.004.
- Adger WN, Paavola J, Huq S, Mace MJ. 2006. Fairness in adaptation to climate change. Cambridge, Massachusetts: MIT Press.
- Ahammad R, Nandy P, Husnain P. 2013. Unlocking ecosystem based adaptation opportunities in coastal Bangladesh. J Coast Conserv. 17(4):833–840. doi:10.1007/s11852-013-0284-x.
- Alessa L, Kliskey A, Brown G. 2008. Social–ecological hotspots mapping: a spatial approach for identifying coupled social–ecological space. Landsc Urban Plan. 85(1):27–39. doi:10.1016/j.landurbplan.2007.09.007.
- Aye WN, Wen Y, Marin K, Thapa S, Tun AW. 2019. Contribution of mangrove forest to the livelihood of local communities in Ayeyarwaddy Region, Myanmar. Forests. 10:1–13. doi:10.3390/f10050414.
- Ayeb-Karlsson S, van der Geest K, Ahmed I, Huq S, Warner K. 2016. A people‐centred perspective on climate change, environmental stress, and livelihood resilience in Bangladesh. Sustain Sci. 11(4):679–694. doi:10.1007/s11625-016-0379-z.
- Bagstad KJ, Semmens DJ, Ancona ZH, Sherrouse BC. 2017. Evaluating alternative methods for biophysical and cultural ecosystem services hotspot mapping in natural resource planning. Landsc Ecol. 32(1):77–97. doi:10.1007/s10980-016-0430-6.
- Blythe JL, Murray G, Flaherty M. 2014. Strengthening threatened communities through adaptation: insights from coastal mozambique. Ecol Soc. 19(2). doi:10.5751/ES-06408-190206.
- Brown K, Westaway E. 2011. Agency, capacity, and resilience to environmental change: lessons from human development, well-being, and disasters. Annu Rev Environ Resour. 36(1):321–342. doi:10.1146/annurev-environ-052610-092905.
- Brown GG, Pullar DV. 2012. An evaluation of the use of points versus polygons in public participation geographic information systems using quasi-experimental design and Monte Carlo simulation. Int J Geogr Inf Sci. 26(2):231–246. doi:10.1080/13658816.2011.585139.
- Brown G, Fagerholm N. 2015. Empirical PPGIS/PGIS mapping of ecosystem services: a review and evaluation. Ecosyst Serv. 13:119–133. doi:10.1016/j.ecoser.2014.10.007.
- Burdon D, Potts T, McKinley E, Lew S, Shilland R, Gormley K, Thomson S, Forster R. 2019. Expanding the role of participatory mapping to assess ecosystem service provision in local coastal environments. Ecosyst Serv. 39:101009. doi:10.1016/j.ecoser.2019.101009.
- Byg A, Novo P, Dinato M, Moges A, Tefera T, Balana B, Woldeamanuel T, Black H. 2017. Trees, soils, and warthogs – distribution of services and disservices from reforestation areas in southern Ethiopia. For Policy Econ. 84:112–119. doi:10.1016/j.forpol.2017.06.002.
- Chaudhary S, McGregor A, Houston D, Chettri N. 2018. Environmental justice and ecosystem services: a disaggregated analysis of community access to forest benefits in Nepal. Ecosyst Serv. 29:99–115. doi:10.1016/j.ecoser.2017.10.020.
- Chow J. 2018. Determinants of household fuelwood collection from mangrove plantations in coastal Bangladesh. For Policy Econ. 96:83–92. doi:10.1016/j.forpol.2018.08.007.
- Cinner JE, McClanahan TR, Graham NAJ, Daw TM, Maina J, Stead SM, Wamukota A, Brown K, Bodin O. 2012. Vulnerability of coastal communities to key impacts of climate change on coral reef fisheries. Glob Environ Chang. 22(1):12–20. doi:10.1016/j.gloenvcha.2011.09.018.
- Cinner JE, Huchery C, Hicks CC, Daw TM, Marshall N, Wamukota A, Allison EH. 2015. Changes in adaptive capacity of Kenyan fishing communities. Nat Clim Chang. 5(9):872–876. doi:10.1038/nclimate2690.
- Cinner JE, Adger WN, Allison EH, Barnes ML, Brown K, Cohen PJ, Gelcich S, Hicks CC, Hughes TP, Lau J, et al. 2018. Building adaptive capacity to climate change in tropical coastal communities. Nat Clim Chang. 8(2):117–123. doi:10.1038/s41558-017-0065-x.
- Colloff MJ, Wise RM, Palomo I, Lavorel S, Pascual U. 2020. Nature’s contribution to adaptation: insights from examples of the transformation of social-ecological systems. Ecosyst People. 16(1):137–150. doi:10.1080/26395916.2020.1754919.
- Cormier-Salem MC, Panfili J. 2016. Mangrove reforestation: greening or grabbing coastal zones and deltas? case studies in Senegal. African J Aquat Sci. 41(1):89–98. doi:10.2989/16085914.2016.1146122.
- Cormier-Salem MC. 2017. Let the women harvest the mangrove. carbon policy, and environmental injustice. Sustain. 9. doi:10.3390/su9081485.
- Cummings AR, Shah M. 2017. Mangroves in the global climate and environmental mix. Geogr Compass. e12353. doi:10.1111/gec3.12353
- Damastuti E, de Groot R. 2019. Participatory ecosystem service mapping to enhance community-based mangrove rehabilitation and management in Demak, Indonesia. Reg Environ Chang. 19(1):65–78. doi:10.1007/s10113-018-1378-7.
- Darvill R, Lindo Z. 2015. Quantifying and mapping ecosystem service use across stakeholder groups: Implications for conservation with priorities for cultural values. Ecosyst Serv. 13:153–161. doi:10.1016/j.ecoser.2014.10.004.
- Das S. 2017. Ecological restoration and livelihood: contribution of planted mangroves as nursery and habitat for artisanal and commercial fishery. World Dev. 94:492–502. doi:10.1016/j.worlddev.2017.02.010.
- Dasgupta R, Hashimoto S, Basu M, Okuro T, Johnson BA, Kumar P, Dhyani S. 2021. Spatial characterization of non-material values across multiple coastal production landscapes in the Indian Sundarban delta. Sustain Sci. doi:10.1007/s11625-020-00899-3
- Devienne S. 2006. Red river delta: fifty years of change. Moussons. 9(9–10):255–280. doi:10.4000/moussons.2042.
- Díaz S, Pascual U, Stenseke M, Martín-López B, Watson RT, Molnár Z, Hill R, Chan KMA, Baste IA, Brauman KA, et al. 2018. Assessing nature’s contributions to people. Science. 80). 359:270–272. doi:10.1126/science.aap8826.
- Eastman JR, Toledano J, Crema S, 2018. A mapping of pond aquaculture, mangroves and coastal wetlands in Vietnam, Cambodia, Thailand and Myanmar in 1999 and comparison to 2014 [WWW document]. https://clarklabs.org/wp-content/uploads/2019/01/Aquaculture-and-Coastal-Habitats-Report-No5.pdf
- Ellison AM, Felson AJ, Friess DA. 2020. Mangrove rehabilitation and restoration as experimental adaptive management. Front Mar Sci. 7:1–19. doi:10.3389/fmars.2020.00327.
- Feurer M, Gritten D, Than MM. 2018. Community forestry for livelihoods: benefiting from myanmar’s mangroves. Forests. 9(3):150. doi:10.3390/f9030150.
- Field CD. 1999. Rehabilitation of mangrove ecosystems: an overview. Mar Pollut Bull. 37(8–12):383–392. doi:10.1016/S0025-326X(99)00106-X.
- Friess DA, Rogers K, Lovelock CE, Krauss KW, Hamilton SE, Lee SY, Lucas R, Primavera J, Rajkaran A, Shi S. 2019. The state of the world’s Mangrove forests: past, present, and future. Annu Rev Environ Resour. 44(1):89–115. doi:10.1146/annurev-environ-101718-033302.
- Gallo ND, Victor DG, Levin LA. 2017. Ocean commitments under the Paris agreement. Nat Clim Chang. 7(11):833–838. doi:10.1038/nclimate3422.
- Gallopín GC. 2006. Linkages between vulnerability, resilience, and adaptive capacity. Glob Environ Chang. 16(3):293–303. doi:10.1016/j.gloenvcha.2006.02.004.
- Gamfeldt L, Snäll T, Bagchi R, Jonsson M, Gustafsson L, Kjellander P, Ruiz-Jaen MC, Fröberg M, Stendahl J, Philipson CD, et al. 2013. Higher levels of multiple ecosystem services are found in forests with more tree species. Nat Commun. 4:4. doi:10.1038/ncomms2328.
- Gandhi S, Jones T. 2019. Identifying Mangrove deforestation hotspots in South Asia, Southeast Asia and Asia-Pacific. Remote Sens. 11(6):728. doi:10.3390/rs11060728.
- Giri C, Long J, Abbas S, Murali RM, Qamer FM, Pengra B, Thau D. 2015. Distribution and dynamics of mangrove forests of South Asia. J Environ Manage. 148:101–111. doi:10.1016/j.jenvman.2014.01.020.
- Goldman MJ, Riosmena F. 2013. Adaptive capacity in Tanzanian Maasailand: changing strategies to cope with drought in fragmented landscapes. Glob Environ Chang. 23(3):588–597. doi:10.1016/j.gloenvcha.2013.02.010.
- Hai NT, Dell B, Phuong VT, Harper RJ. 2020. Towards a more robust approach for the restoration of mangroves in Vietnam. Ann for Sci. 77(1):18. doi:10.1007/s13595-020-0921-0.
- Haines-Young R, Potschin M. 2010. The links between biodiversity, ecosystem services and human well-being. In: Raffaelli DG, Frid CIJ, editors. Ecosystem Ecology: a New Synthesis. Cambridge: Cambridge University Press; p. 110–139.
- Hamilton SE, Casey D. 2016. Creation of a high spatio-temporal resolution global database of continuous mangrove forest cover for the 21st century (CGMFC-21). Glob Ecol Biogeogr. 25(6):729–738. doi:10.1111/geb.12449.
- Hong PN, San HT. 1993. Mangroves of Vietnam. Bangkok, Thailand: IUCN.
- Hoque SF, Quinn CH, Sallu SM. 2017. Resilience, political ecology, and well-being: an interdisciplinary approach to understanding social-ecological change in coastal Bangladesh. Ecol Soc. 22(2). doi:10.5751/ES-09422-220245.
- Huxham M, Dencer-Brown A, Diele K, Kathiresan K, Nagelkerken I, Wanjiru C. 2017. Mangroves and people: local ecosystem services in a changing climate. In: Rivera-Monroy VH, Kristensen E, Lee SY, Twilley RR, editors. Mangrove ecosystems: a global biogeographic perspective: structure, function, and services. Springer International Publishing, ebook; p. 245–274. doi: 10.1007/978-3-319-62206-4.
- Huynh LTM, Stringer LC. 2018. Multi-Scale assessment of social vulnerability to climate change: an empirical study in coastal Vietnam. Clim Risk Manag. 20:165–180. doi:10.1016/j.crm.2018.02.003.
- Iftekhar MS, Islam MR. 2004. Managing mangroves in Bangladesh: a strategy analysis. J Coast Conserv. 10:139–146. doi:10.1652/1400-0350(2004)0100[139:MMIBAS]2.0.CO;2.
- International Federation of Red Cross and Red Crescent Societies (IFRC). 2011. Planting protection. evaluation of community-based mangrove reforestation and disaster preparedness programme, 2006-2010 [WWW document]. URL https://www.ifrc.org/docs/Appeals/annual11/MAAVN00111myr-Planting-Protection-April-2011-EN.pdf
- IPBES. 2019. Summary for policymakers of the global assessment report of the intergovernmental science-policy platform on biodiversity and ecosystem services. Bonn, Germany: IPBES secretariat.
- Juhola S, Glaas E, Linner B-O, Neset T. 2016. Redefining maladaptation. Environ Sci Policy. 55:135–140. doi:http://dx.doi.org/10.1016/j.envsci.2015.09.014.
- Kibler KM, Cook GS, Chambers LG, Donnelly M, Hawthorne TL, Rivera FI, Walters L. 2018. Integrating sense of place into ecosystem restoration: a novel approach to achieve synergistic social-ecological impact. Ecol Soc. 23(4). doi:10.5751/ES-10542-230425.
- Kirezci E, Young IR, Ranasinghe R, Muis S, Nicholls RJ, Lincke D, Hinkel J. 2020. Projections of global-scale extreme sea levels and resulting episodic coastal flooding over the 21st century. Sci Rep. 10(1):1–12. doi:10.1038/s41598-020-67736-6.
- Kuhl L, Van Maanen K, Scyphers S. 2020. An analysis of UNFCCC-financed coastal adaptation projects: assessing patterns of project design and contributions to adaptive capacity. World Dev. 127. doi:10.1016/j.worlddev.2019.104748
- Lau JD, Hicks CC, Gurney GG, Cinner JE. 2018. Disaggregating ecosystem service values and priorities by wealth, age, and education. Ecosyst Serv. 29:91–98. doi:10.1016/j.ecoser.2017.12.005.
- Lau JD, Hicks CC, Gurney GG, Cinner JE. 2019. What matters to whom and why? Understanding the importance of coastal ecosystem services in developing coastal communities. Ecosyst Serv. 35:219–230. doi:10.1016/j.ecoser.2018.12.012.
- Lavorel S, Locatelli B, Colloff MJ, Bruley E. 2020. Co-Producing ecosystem services for adapting to climate change. Philos Trans R Soc B Biol Sci. 375. doi:10.1098/rstb.2019.0119
- Le HTV. 2006. Gender, Doi Moi and Mangrove management in Northern Vietnam. Gend Technol Dev. 10(1):37–59. doi:10.1177/097185240501000103.
- Lhoest S, Dufrêne M, Vermeulen C, Oszwald J, Doucet JL, Fayolle A. 2019. Perceptions of ecosystem services provided by tropical forests to local populations in Cameroon. Ecosyst Serv. 38:100956. doi:10.1016/j.ecoser.2019.100956.
- Linting M, Van Der Kooij A. 2012. Nonlinear principal components analysis with CATPCA: a tutorial. J Pers Assess. 94(1):12–25. doi:10.1080/00223891.2011.627965.
- Locatelli T, Binet T, Kairo JG, King L, Madden S, Patenaude G, Upton C, Huxham M. 2014. Turning the tide: how blue carbon and Payments for Ecosystem Services (PES) might help save Mangrove forests. Ambio. 43(8):981–995. doi:10.1007/s13280-014-0530-y.
- Mai TN, Nguyen TT, Nguyen THH, Tran DQ, Tran ML. 2016. An indicator-based approach to quantifying the adaptive capacity of urban households: the case of Da Nang city. Central Vietnam Urban Clim. 15:60–69. doi:10.1016/j.uclim.2016.01.002.
- Menéndez P, Losada IJ, Torres-Ortega S, Narayan S, Beck MW. 2020. The global flood protection benefits of Mangroves. Sci Rep. 10(1):1–11. doi:10.1038/s41598-020-61136-6.
- Mialhe F, Gunnell Y, Dabbadie L, Coloma G. 2019. Securing aquaculture-related resources through social interaction in the Pampanga River delta, Philippines: an ethnogeographic perspective on the strengths and pitfalls of social capital. Rural Sociol. 84(2):350–389. doi:10.1111/ruso.12228.
- Mohammad Abdullah AN, Stacey N, Garnett ST, Myers B. 2016. Economic dependence on mangrove forest resources for livelihoods in the Sundarbans, Bangladesh. For Policy Econ. 64:15–24. doi:10.1016/j.forpol.2015.12.009.
- Moore SA, Brown G, Kobryn H, Strickland-Munro J. 2017. Identifying conflict potential in a coastal and marine environment using participatory mapping. J Environ Manage. 197:706–718. doi:10.1016/j.jenvman.2016.12.026.
- Muñoz L, Hausner V, Brown G, Runge C, Fauchald P. 2019. Identifying spatial overlap in the values of locals, domestic- and international tourists to protected areas. Tour Manag. 71:259–271. doi:10.1016/j.tourman.2018.07.015.
- Nagelkerken I, Blaber SJM, Bouillon S, Green P, Haywood M, Kirton LG, Meynecke JO, Pawlik J, Penrose HM, Sasekumar A, et al. 2008. The habitat function of mangroves for terrestrial and marine fauna: a review. Aquat Bot. 89(2):155–185. doi:10.1016/j.aquabot.2007.12.007.
- Nelson DR, Adger WN, Brown K. 2007. Adaptation to environmental change: contributions of a resilience framework. Annu Rev Environ Resour. 32(1):395–419. doi:10.1146/annurev.energy.32.051807.090348.
- Neumann JE, Emanuel KA, Ravela S, Ludwig LC, Verly C. 2015. Risks of coastal storm surge and the effect of sea level rise in the red river delta. Vietnam Sustainability. 7(6):6553–6572. doi:10.3390/su7066553.
- Orchard SE, Stringer LC, Quinn CH. 2015. Mangrove system dynamics in Southeast Asia: linking livelihoods and ecosystem services in Vietnam. Reg Environ Chang. 16(3):865–879. doi:10.1007/s10113-015-0802-5.
- Pahl-Wostl C. 2009. A conceptual framework for analysing adaptive capacity and multi-level learning processes in resource governance regimes. Glob Environ Chang. 19(3):354–365. doi:10.1016/j.gloenvcha.2009.06.001.
- Pedersen A, Nguyen TH. 1996. The conservation of key coastal wetland sites in the red river delta [WWW document]. Bird Life Int Vietnam Program. http://thiennhienviet.org.vn/sourcebook/report_pdf/report8.pdf
- Plieninger T, Dijks S, Oteros-Rozas E, Bieling C. 2013. Assessing, mapping, and quantifying cultural ecosystem services at community level. Land Use Policy. 33:118–129. doi:10.1016/j.landusepol.2012.12.013.
- Potschin M, Haines-Young R. 2013. Landscapes, sustainability and the place-based analysis of ecosystem services. Landsc Ecol. 28(6):1053–1065. doi:10.1007/s10980-012-9756-x.
- Quinn C, Stringer L, Berman R, Le H, Msuya F, Pezzuti J, Orchard S. 2017. Unpacking changes in mangrove social-ecological systems: lessons from Brazil, Zanzibar, and Vietnam. Resources. 6:14. doi:10.3390/resources6010014.
- Rakotomahazo C, Ravaoarinorotsihoarana LA, Randrianandrasaziky D, Glass L, Gough C, Boleslas Todinanahary GG, Gardner CJ. 2019. Participatory planning of a community-based payments for ecosystem services initiative in Madagascar’s mangroves. Ocean Coast Manag. 175:43–52. doi:10.1016/j.ocecoaman.2019.03.014.
- Ramirez-Gomez SOI, Brown G, Fat ATS. 2013. Participatory mapping with indigenous communities for conservation: challenges and lessons from suriname. Electron J Inf Syst Dev Ctries. 58(1):1–22. doi:10.1002/j.1681-4835.2013.tb00409.x.
- Ramirez-Gomez SOI, Torres-Vitolas CA, Schreckenberg K, Honzák M, Cruz-Garcia GS, Willcock S, Palacios E, Pérez-Miñana E, Verweij PA, Poppy GM. 2015. Analysis of ecosystem services provision in the Colombian amazon using participatory research and mapping techniques. Ecosyst Serv. 13:93–107. doi:10.1016/j.ecoser.2014.12.009.
- Reilly K, Adamowski J, John K. 2018. Participatory mapping of ecosystem services to understand stakeholders ’ perceptions of the future of the Mactaquac Dam, Canada. Ecosyst Serv. 30:107–123. doi:10.1016/j.ecoser.2018.01.002.
- Richards DR, Friess DA. 2016. Rates and drivers of mangrove deforestation in Southeast Asia, 2000–2012. Proc Natl Acad Sci U S a. 113(2):344–349. doi:10.1073/pnas.1510272113.
- Rojas O, Zamorano M, Saez K, Rojas C, Vega C, Arriagada L, Basnou C. 2017. Social perception of ecosystem services in a coastal wetland post-earthquake: a case study in Chile. Sustain. 9. doi:10.3390/su9111983.
- Seddon N, Turner B, Berry P, Chausson A, Girardin CAJ. 2019. Grounding nature-based climate solutions in sound biodiversity science. Nat Clim Chang. 9(2):84–87. doi:10.1038/s41558-019-0405-0.
- Sherrouse BC, Semmens DJ, Ancona ZH, Brunner NM. 2017. Analyzing land-use change scenarios for trade-offs among cultural ecosystem services in the southern rocky mountains. Ecosyst Serv. 26:431–444. doi:10.1016/j.ecoser.2017.02.003.
- Singh A, Bhattacharya P, Vyas P, Roy S. 2010. Contribution of NTFPs in the livelihood of mangrove forest dwellers of Sundarban. J Hum Ecol. 29(3):191–200. doi:10.1080/09709274.2010.11906263.
- Smit B, Wandel J. 2006. Adaptation, adaptive capacity and vulnerability. Glob Environ Chang. 16(3):282–292. doi:10.1016/j.gloenvcha.2006.03.008.
- Song AM, Dressler WH, Satizábal P, Fabinyi M. 2021. From conversion to conservation to carbon: the changing policy discourse on mangrove governance and use in the Philippines. J Rural Stud. 82:184–195. doi:10.1016/j.jrurstud.2021.01.008.
- Spangenberg JH, Görg C, Truong DT, Tekken V, Bustamante JV, Settele J. 2014. Provision of ecosystem services is determined by human agency, not ecosystem functions. four case studies. Int J Biodivers Sci Ecosyst Serv Manag. 10(1):40–53. doi:10.1080/21513732.2014.884166.
- Stringer LC, Fraser EDG, Harris D, Lyon C, Pereira L, Ward CFM, Simelton E. 2020. Adaptation and development pathways for different types of farmers. Environ Sci Policy. 104:174–189. doi:10.1016/j.envsci.2019.10.007.
- Thanh TD, Saito Y, Huy DV, Nguyen VL, Ta TKO, Tateishi M. 2004. Regimes of human and climate impacts on coastal changes in Vietnam. Reg Environ Chang. 4(1):49–62. doi:10.1007/s10113-003-0062-7.
- Triyanti A, Bavinck M, Gupta J, Marfai MA. 2017. Social capital, interactive governance and coastal protection: the effectiveness of mangrove ecosystem-based strategies in promoting inclusive development in Demak, Indonesia. Ocean Coast Manag. 150:3–11. doi:10.1016/j.ocecoaman.2017.10.017.
- UNFCCC. 2022. NDC Registry. https://www4.unfccc.int/sites/ndcstaging/PublishedDocuments/Viet%20Nam%20First/Viet%20Nam_NDC_2020_Eng.pdf
- Valiela I, Bowen JL, York JK. 2001. Mangrove forests: one of the world’s threatened major tropical environments. Bioscience. 51:807–815. doi:10.1641/0006-3568(2001)051[0807:MFOOTW]2.0.CO;2.
- Van Coppenolle R, Schwarz C, Temmerman S. 2018. Contribution of mangroves and salt marshes to nature-based mitigation of coastal flood risks in major deltas of the world. Estuaries and Coasts. 41:1699–1711. doi:10.1007/s12237-018-0394-7.
- Veettil BK, Ward RD, Quang NX, Trang NTT, Giang TH. 2019. Mangroves of Vietnam: historical development, current state of research and future threats. Estuar Coast Shelf Sci. 218:212–236. doi:10.1016/J.ECSS.2018.12.021.
- Vincent K. 2007. Uncertainty in adaptive capacity and the importance of scale. Glob Environ Chang. 17(1):12–24. doi:10.1016/j.gloenvcha.2006.11.009.
- Walton MEM, Samonte-Tan GPB, Primavera JH, Edwards-Jones G, Le Vay L. 2006. Are mangroves worth replanting? the direct economic benefits of a community-based reforestation project. Environ Conserv. 33(4):335–343. doi:10.1017/S0376892906003341.
- Whitney CK, Bennett NJ, Ban NC, Allison EH, Armitage D, Blythe JL, Burt JM, Cheung W, Finkbeiner EM, Kaplan-Hallam M, et al. 2017. Adaptive capacity: from assessment to action in coastal social-ecological systems. Ecol Soc. 22(2):22. doi:10.5751/ES-09325-220222.
- Zeng Y, Friess DA, Sarira TV, Siman K, Koh LP. 2021. Global potential and limits of mangrove blue carbon for climate change mitigation. Curr Biol. 31(8):1737–1743. doi:10.1016/j.cub.2021.01.070.
- Zimmer M. 2018. Ecosystem design -when mangrove ecology meets human need. In: Makowski C, Finkl CW, editors. Threats to Mangrove forests. Cham: Springer International Publishing; p. 367–376.