
 ?Mathematical formulae have been encoded as MathML and are displayed in this HTML version using MathJax in order to improve their display. Uncheck the box to turn MathJax off. This feature requires Javascript. Click on a formula to zoom.
ABSTRACT
Although the socio-economic impacts of land acquisition for large-scale agricultural investments (LSAIs) are well researched, studies exploring the impact of LSAIs on climate change vulnerability of the displaced smallholders are scanty or none. This study, therefore, intends to bridge this knowledge gap. It empirically investigates the impact of LSAIs on the climate change vulnerability of displaced smallholders. Data was collected from 521 sample households (49% displaced and 51% non-displaced households) using the face-to-face survey data collection method in the Oromia region. Principal component analysis (PCA) and propensity score matching (PSM) methods were applied to analyze the data. The results indicate that LSAIs have increased the vulnerability of displaced smallholder farmers to climate change shocks by up to three-fold compared to the control households, which is significant at 1%. The finding implies that policymakers should consider the implications of land deals on the vulnerability of the displaced smallholders and design appropriate adaptation strategies to mitigate the impacts. The empirical finding from this study has filled the existing information gap in the areas of climate change vulnerability of the displaced farmers.
Edited by:
1. Introduction
Substantial evidence indicates that vulnerability to climate change shocks is one of humanity’s key challenges. The frequency and magnitude of widely prevalent climate change shocks such as drought, rainfall variability, and floods are increasing faster (Serdeczny et al. Citation2017; Zaehringer et al. Citation2021). No part of the world or sector is immune to the impacts of such shocks (Feng et al. Citation2017; Guan et al. Citation2021). Evidence indicates that vulnerability is the product of exposure to shocks and skewed development processes that provide limited or no protection for the vulnerable segment of society, including the smallholders in developing countries (Waterhouse et al. Citation2010; Cardona et al. Citation2012). Africa is the most affected continent but the lowest contributor to anthropogenic climate change (Codjoe and Atiglo Citation2020; Owusu et al. Citation2021a). Sectors such as agriculture are more susceptible to climate shocks than others (Owusu et al. Citation2021b; Bora Citation2022; TDN et al. Citation2022; Mary Citation2022). Smallholders in poor African countries are the most vulnerable to shocks because they are more likely to live in areas of high exposure or have limited adaptation capacity (World Bank Citation2010; Owusu et al. Citation2021a). Climate change shocks such as drought and rainfall variability are more likely to unfold in the decades to come, signaling the continued vulnerabilities of smallholders in Africa (IPCC Citation2018) and the need to put in place appropriate adaptation mechanisms to reduce the impact (Feng et al. Citation2017; TDN et al. Citation2022).
Smallholder farmers in poor African countries are equally affected by land acquisition for large-scale agricultural investments (LSAIs). Initially, these investments were introduced around 2008 as a pivotal instrument to transform agriculture and curb the food insecurity situation encountered in the world (Nkansah and Raschke Citation2021). The land acquisition process for LSAIs involve the transfer of rights to use, control, purchase or lease land from smallholders to agricultural investors (Kebede et al. Citation2021). Several transnational companies, sovereign wealth funds, and private investors (local and international) have acquired large tracts of land in developing countries since 2008 (Nkansah Citation2021). Currently, the scale and intensity of LSAIs are unprecedented; and the size of land under LSAIs is subjected to debates (Hajjar et al. Citation2020). A conservative estimate indicates that 83 million hectares (ha) of land were transferred to LSAIs by 2012 (Deininger et al. Citation2011; Anseeuw et al. Citation2012). According to Kebede et al. (Citation2021), African countries account for 70% of the global land acquisition (i.e. 57 million ha). This has led to the displacement of over 12 million smallholders in the continent (Davis et al. Citation2014; Baumgartner et al. Citation2015; Scoones et al. Citation2019). In Ethiopia alone, over 2.7 million hectares of farmland were transferred to 2,360 LSAIs up to 2017, with the transfer size per LSAI ranging between 50 ha − 100,000 ha (Kebede et al. Citation2021). Over one million smallholders were displaced from their land in Ethiopia (Rahmato Citation2014). The availability of water and fertile land makes African countries, including Ethiopia, the most attractive destination for the LSAIs (Land Matrix Citation2021).
Despite this situation, the effect of LSAI-driven displacement on the vulnerability of displaced smallholders to climate change shocks is not well-researched and sometimes even contested. According to the proponents, LSAIs reduce the vulnerability of smallholders through modernizing subsistence farming (Salverda Citation2019); contribute to the diversification of rural economies and jobs (Sulle Citation2017; D’Odorico et al. Citation2017); increase farm income;(Richards Citation2013) and enhance access to rural infrastructures and market (Aabo and Kring Citation2010). On the contrary, the opponents criticize LSAIs as a driver of smallholders’ vulnerability to climate shocks through farmland dispossession (Hailegiorgis Citation2013; Cochrane and Legault Citation2020); exacerbate extractive use of water and forest resources (Richards Citation2013; Davis et al. Citation2014; Breu et al. Citation2016; Bora Citation2022); and undermine rural income and food security (Atuoye et al. Citation2021;Kebede et al. Citation2021). However, none of the above contesting studies have empirically investigated the impact of LSAIs on the vulnerability of smallholders to climate change shocks. Studies so far were mainly skewed toward LSAIs’ socio-economic effects and rarely measured their vulnerability aspect (Zaehringer et al. Citation2018b; Cochrane and Legault Citation2020). This study is, therefore, conducted to fill this knowledge gap: the impact of LSAIs on the climate change vulnerability of displaced households. It empirically analyzed the impact of LSAIs on the vulnerability status of displaced smallholders to climate change shocks in Ethiopia.
Existing sources indicated that most of the LSAIs were carried out on smallholders’ lands (Wheeler and Von Braun Citation2013; Davis et al. Citation2015). In Ethiopia, LSAIs have driven hundreds of thousands of displaced smallholders to marginal areas where access to fertile and irrigated land is scanty and climatic shocks are more prevalent (Kebede et al. Citation2021). This means the farm income of displaced farmers is more likely to reduce due to exposure to climatic shocks, worsening their vulnerability (Birthal and Hazrana Citation2019; TDN et al. Citation2022). Survey data comprising 521 sample households (49% displaced and 51% control units) was gathered from two districts in the Oromia region, where several LSAIs engaged in floriculture, vine farms, and agro-processing have been operating for decades. The finding of this study informs the policymakers and planners to consider climate change vulnerability arising from land deals and design appropriate adaptation strategies to reduce the impacts.
The rest of this article is structured as follows: section two discusses the conceptual framework guiding the study, including vulnerability, its components, and measurement approaches. Section three deals with materials and methods, including sampling, data requirements, data collection methods, and analysis. Section four presents the study results, section five discusses the key findings based on the results, and the final section provides concluding remarks.
2. Vulnerability to climate change shocks: concepts and measurement approaches
This section discusses the concept of vulnerability and associated elements and sheds light on key definitions and measurement approaches guiding this study.
Vulnerability is a core concept in climate change research and related livelihood studies. However, different researchers conceptualized it differently and lacked a unified definition. The fact that vulnerability has been used under different policy contexts, referring to different systems exposed to different hazards, has led to a lack of consistency in its use (Fussel Citation2005). In the early times, vulnerability referred to a generic term called ‘areas of concern’ (Timmerman Citation1981). However, applying such a generic concept to climate change research was problematic due to a lack of specificity and coherence (Crane et al. Citation2017). To address this, scholars in different disciplines have put forward various conceptual definitions of vulnerability. Classical natural science scholars see vulnerability as an external shock impacting the physical systems and thus define it as a bio-physical sensitivity or susceptibility to external stressors (United Nations Citation2004).
On the other hand, classical social science scholars see vulnerability in light of the people affected by hazards and their internal capacity to deal with the impacts. Thus, these social science scholars have defined vulnerability as social sensitivity or susceptibility to hazards (Brooks Citation2003). However, evidence indicates that neither the natural science nor the social science scholars’ conceptualization has captured the complete picture of vulnerability (Fussel Citation2005; Tesso et al. Citation2012). As a result, as of the mid-2000s, scholars working in a multidisciplinary setting have voiced for a comprehensive definition of vulnerability to ensure alignment of researcher works on the subject and contribute to policy interventions dealing with vulnerability reduction (Turner et al. Citation2003; Adger Citation2006).
This has given way to the birth of an integrated concept of vulnerability comprising social, economic, and environmental aspects, which has widely informed the research works on vulnerability to climate change extremes (O’Brien et al. Citation2004; Crane et al. Citation2017). The integrated concept of vulnerability is well reflected in the IPCC’s definition (IPCC Citation2001), which highlights vulnerability as the degree to which a system is susceptible to or unable to cope with the adverse effects of climate change variabilities and shocks. According to this definition, vulnerability comprises adaptive capacity (i.e. the ability of people to cope with or adjust to the changing context), sensitivity (i.e. susceptibility of a system to be affected), and exposure (i.e. likelihood of experiencing stressful events or hazards (Yuga et al. Citation2010). This IPCC definition of vulnerability and the associated components has guided this study.
Vulnerability measurement approaches have been evolving along with the changing conceptual construct of vulnerability. Generally, three measurement methods focusing on biophysical, socio-economic, and integrated approaches were identified (Birkmann Citation2007; Tesso et al. Citation2012; Zeleke et al. Citation2021). These are discussed as follows:
2.1. Biophysical-focused measurement approach
This approach analyzes external factors affecting vulnerability, such as shocks and damages caused to the physical environment (Liverman Citation1990; Fussel Citation2007; Breu et al. Citation2016). Assessing the disruption or degradation of biophysical conditions caused by climate change shocks is emphasized according to this measurement approach (Laitonjam et al. Citation2018). However, this approach has limitations. On the one hand, it focused on easily observable external factors and failed to account for the less observable internal causes of vulnerability (Pulwarty and Riebsame Citation1997; Serdeczny et al. Citation2017). On the other hand, it presents half the picture by neglecting the social and economic factors that are equally important in affecting vulnerability to climate change shocks (Zeleke et al. Citation2021).
2.2. Socio-economic focused measurement approach
Unlike the biophysical, the socio-economic approach focuses on analyzing non-biophysical and other internal factors affecting vulnerability. These include the social, economic, and political factors affecting vulnerability. According to this approach, vulnerability differs within a given community because members have different social and economic statuses, access to services and inputs, and other resources (Fussel Citation2007; Deressa et al. Citation2008; Tesso Citation2013). Thus, peoples’ and communities’ adaptive capacity based on their internal characteristics is given due emphasis to understanding vulnerability. Therefore, vulnerability is analyzed as a system failure sustaining people’s susceptibility to climate change shocks (Kelly and Adger Citation2000). However, this approach has failed to present a comprehensive picture of vulnerability by over-emphasizing the internal factors and neglecting external factors such as environmental and biophysical shocks that are equally important to explain vulnerability to climate change (Gbetibouo and Ringler Citation2009).
2.3. Integrated approach
This is a contemporary approach to vulnerability measurement. It combines the assessment of internal and external factors to understand vulnerability to climate change shocks (Nelson et al. Citation2010). The result presents a comprehensive picture of vulnerability by combining individuals’ and communities’ exposure, susceptibility, and adaptive capacity (Birkmann Citation2007; Tesso Citation2013). It implies that individuals and communities whose adaptive capacity exceed their exposure to hazards/sensitivity are less vulnerable to the impacts of climate change shocks. This approach is widely applied by scholars working on climate change vulnerability research (Deressa et al. Citation2008; Madu Citation2012; Opiyo et al. Citation2014). Along with this, the IPCC (Citation2012) has developed a climate change vulnerability index as a net effect of individuals’ or communities’ adaptive capacity and exposure to hazards/sensitivity, which is denoted as follows:
This vulnerability index is constructed by combining all key internal and external factors or variables affecting vulnerability dimensions: exposure (i.e. drought, rainfall variability, flood, etc.), sensitivity (i.e. associated impacts of exposure such as loss of yield or harvest, etc.), and adaptive capacity (i.e. household income, assets, access to services, etc.). The index considers context-specific factors, including household characteristics, sources of livelihood earning, social networks, health, food, water, natural disasters, and climate variability. The necessary data for these variables can be generated through the household survey; do not rely on secondary data or sophisticated climate change modeling to establish the indexes (Deressa et al. Citation2008; Tesso et al. Citation2012). The integrated approach combines exposure and sensitivity to produce potential impacts, which are then compared with adaptive capacity to estimate vulnerability indices (Madu Citation2012; Opiyo et al. Citation2014). Thus, this integrated approach to vulnerability analysis is applied to this study to analyze the differential impact of LSAIs on climate change vulnerability of displaced households compared to the control units.
Vulnerability can be analyzed at various levels: household, community, country, or even on a global scale (Adger and Kelly Citation1999; Brooks et al. Citation2005). The purpose of the research dictates the selection of the level of analysis. For this study, the focus is to analyze climate change vulnerability at the household level using vulnerability indices. The index is generated using principal component analysis (PCA) for sample households. Then, the propensity score matching method is applied to measure the vulnerability impact of LSAIs on displaced households compared to the control units. A more elaborate discussion of this is given under the methodology section below.
3. Materials and methods
3.1. Study area
This study was carried out in two adjacent Oromia region districts (Adamitulu & Dugda). Both districts share similar socio-economic and agro-ecological characteristics; and belong to a semi-arid agro-ecological zone where mixed farming, including horticultural crops and livestock production, is predominantly practiced, with similar access to natural resources like water and vegetation (Kidemu et al. Citation2020). The two districts share a border with Lake Ziway, Adamitulu from the South-West direction, and Dugda from the North-East direction. Lake Ziway is a crucial source of irrigation for the local communities in the two districts and the LSAIs in Adamitulu.
Adamitulu district was purposely sampled as a treatment area for this study because it is home to over 16 LSAIs comprising floriculture, horticulture, and agro-processing companies (Oromia Investment Office Citation2018). These LSAIs were attracted to this district mainly because of the presence of Lake Ziway to irrigate their agricultural activities. Better access to roads, cheap labor, and social services have also contributed to this district’s higher concentration of LSAIs. Dugda district was sampled as a control area because the study communities in this district are not affected by the LSAIs. The displaced households or treatment units were sampled from communities sharing a border with the Lake Ziway in Adamitulu district (South-west direction of the Lake), from where the smallholders’ farmlands transferred to the LSAIs. In contrast, the control units or non-displaced households were sampled from similar communities sharing a border with Lake Ziway in the Dugda district (North-East direction of the Lake). Here, smallholders’ farmlands were not affected by the LSAIs ().
Figure 1. Map of the two study districts (Adamitulu and Dugda).
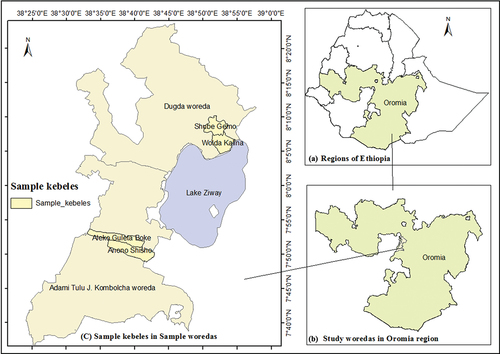
The two districts are situated within Ethiopia’s central rift valley region and share similar demographic and socio-economic characteristics. According to Tadesse (Kebede et al. Citation2021), the two districts are located at about 160 km in the south direction of Addis Ababa; and situated between 7°36” − 8°24‘N latitude and 38°24’ − 38°58’ E longitudes. Population-wise, the Adamitulu district is home to 186,998 people, of whom 49.6% are men and 50.4% are women. Similarly, the Dugda district has 196,678 people, of whom 51.3% are men and 48.7% are women (CSA Citation2017). The total estimated area of Adamitulu and Dugda is 1,274.54 km2 and 959.45 km2, respectively.
3.2. Sampling
The survey households were sampled from two communities in each district and four communities. The study included these communities based on their proximity and similarity in terms of their agro-ecological and socio-economic characteristics. Existing study results indicate that in-state comparison groups produce less bias than out-of-state groups (Kebede et al. Citation2021) implying the need to sample both treatment and comparison groups from the same population.
Accordingly, the displaced households (i.e. treated units) were sampled from two communities affected by the LSAIs in the Adamitulu district. In contrast, the non-displaced households (i.e. control units) were sampled from two adjacent communities in the Dugda district where farmers’ lands were not affected by the LSAIs. The following steps were applied to determine the sample size for the study. Firstly, the list of all displaced and non-displaced households within the four adjacent communities of the two districts (i.e. the population) was obtained from the local government offices. This comprises 1,604 households that lived in the four communities of the two districts for at least five years before this study. The displaced households were affected in similar ways by the LSAIs and lost all or part of their farmlands. More than 95% of the displaced households live in the two sample communities of this district (CitationAdamitulu Investment Office). Secondly, the following formula (i.e. EquationEquation (1)(1)
(1) ) developed by Cochran (Citation1977) was applied to estimate the sample size representing the population. Several authors have claimed that this formula is appropriate and widely used to determine sample size from a population with a definite size (Kebede et al. Citation2021).
Accordingly, a total of 521 households were sampled from a population of 1,604 households in the four communities of the two districts. Of this, 255 sample units (49%) were displaced households, while the remaining 266 households (51%) were the control units. The sample units were randomly sampled from the four adjacent communities in the two districts (). A higher number of control units were sampled to ensure better matching between the comparison groups during the data analysis. Male and female-headed households were included in the sample proportional to gender composition in the population. Overall, the female-headed households comprise 21% of sample households in the displaced group and 16% in the control group. The Chi-square test result () indicates that the difference between the sample male and female-headed households among the displaced and non-displaced households is statistically insignificant.
Table 1. Sample size by sex of head of households (HHs) and treatment type.
3.3. Household survey
A household survey was carried out to collect the necessary data on social, economic, and environmental factors affecting household vulnerability. The social and economic factors included in the survey data collection comprise household characteristics, sources of livelihoods and income (crop, livestock, and other sources), access to land and other assets (irrigation, productive equipment, and tools), participation in traditional social and economic associations/networks such as cooperatives; access to infrastructure, services and information. The adaptive capacity and sensitivity variables are related to households’ social and economic status and were captured as part of socio-economic data collection. Exposure to environmental factors covered by this survey includes the type and frequency of shocks encountered (drought, rainfall variability, flood, crop pests) and precipitation and temperature conditions. The relevant socio-economic and environmental data were gathered from displaced and control households during the 2019 production season.
A structured questionnaire covering a range of the above issues was prepared and used to guide the primary data collection. Experienced data collectors that have diploma-level education or above and are capable of speaking the local languages were recruited, trained, and deployed for the actual field survey data collection.
The survey data collection instrument was pre-tested to ensure validity, reviewed for ethical clearance, and approved by the Oromia region Land Administration Authority of Ethiopia. Moreover, informed consent was obtained from all surveyed households before starting the actual field data collection.
3.4. Data analysis
The data gathered through a household survey was analyzed using STATA software (version 14). Both descriptive analysis and empirical models were applied to analyze the data. These are discussed as follows:
3.4.1. Descriptive analysis
Descriptive statistics such as mean, proportion, and percentage were applied during the data analysis. Two means or proportions comparison tests were applied to the different variables of vulnerability dimensions (exposure, sensitivity, and adaptation capacity) as a primary method of estimating the differences between the vulnerability status of displaced and control households.
Moreover, principal component analysis (PCA) was applied to estimate the household vulnerability index for displaced and control households. The indices were computed based on the data collected on three dimensions of variables affecting vulnerability (i.e. exposure to climate change shocks, sensitivity, and adaptive capacity). Then, the computed indices were compared between the displaced and non-displaced households to analyze the vulnerability level. Existing literature indicates that PCA is an appropriate tool to generate the indices because it objectively assigns weight to variables and avoids uncertainty arising from equal variables weighting (Deressa et al. Citation2008; Nelson et al. Citation2010; Tesso Citation2013; Opiyo et al. Citation2014). A summary of steps followed in computing vulnerability indices is given in :
Figure 2. Steps followed to estimate household vulnerability indices.
Step 1 involves identifying relevant variables associated with the three dimensions of vulnerability. These variables were identified based on descriptive analysis and literature review results. Variables significantly varying between displaced and non-displaced households were identified for further analysis.
Step 2 involves normalizing the values of the identified variables. Normalization is necessary to ensure values of variables are brought to a comparable range, as recommended in similar studies (Gbetibouo and Ringler Citation2009; Nelson et al. Citation2010; Gupta et al. Citation2020). The normalized values of variables were calculated by deducting the mean of each variable from its observed value, then dividing the resultant by the respective standard deviations (EquationEquation (2)(2)
(2) ).
Where is the mean of
and
is the standard deviation.
In step 3, PCA is executed for each dimension of vulnerability to prioritize more important variables per dimension. Sources indicate that PCA is a data-sensitive technique that reduces the number of variables and identifies the most important ones based on determining variables’ relationship to the respective vulnerability dimension (Gupta et al. Citation2020). PCA also generates a weighting factor for each variable and assists in identifying variables that are more contributing to vulnerability dimensions using Eigenvalue (Gbetibouo and Ringler Citation2009; Nelson et al. Citation2010; Gupta et al. Citation2020).
Step 4 computes the weighted indices for each dimension of vulnerability (AC, S & E) using the PCA result. This involves, firstly, multiplying the normalized value of each variable with the associated first-factor loading to generate the weighted value of that variable; and secondly, estimating the dimension index using EquationEquation (3)(3)
(3) :
Where, stands for vulnerability dimension (AC, S, E), i is the variables of the associated dimension, and n is the number of variables. Here, the first principal component with an eigenvalue greater than 1 that captures the larger proportion of variation within the dataset is used to estimate the weighted value of variables.
Step 5: Estimate the composite household vulnerability index (Vi) as the net difference between the adaptive capacity and its exposure/sensitivity, using the identified variables and the below formula (EquationEquation (4)(4)
(4) ). The three dimensions of variables are composed of a set of socio-economic and biophysical factors, as noted below:
Where Xs are adaptive capacity variables, Ys are sensitivity or exposure variables, and Ai is the principal component results, variable weights, or factor scores. Ai ranges between +1 and −1. The higher this value is, the more contribution of the variable to the vulnerability index. Thus, positive and higher values of Vi mean less vulnerability to climate change shocks, and negative values of Vi mean increased vulnerability. Several similar studies have recommended the application of PCA to generate vulnerability indexes and analyze the level of vulnerability (Tesso Citation2013; Opiyo et al. Citation2014).
3.4.2. Empirical analysis
The empirical modeling has followed the principal component analysis for a rigorous and robust investigation of the impact of LSAIs on the vulnerability situation of affected households. For this study, the propensity score matching method (PSM) was applied to analyze the effect of land transfer to LSAIs on the vulnerability status of displaced households. Existing evidence indicates PSM is a reliable and robust model for treatment effect analysis in observational studies where limited information is available on a pre-treatment condition (Dehejia and Wahba Citation1999; Baker Citation2000).
According to Dehejia and Wahba (Citation1999) and Barrett et al. (Citation2012), PSM is an appropriate tool for estimating the impacts of participation (i.e. displacement due to LSAIs in our case) on the outcome of interest if participation is not self-selection. In our case, displacement is compulsory, and households within the command area of LSAIs were forced to relocate. This implies PSM is a reliable method to control for observable sources of biases and assess the effect of displacement on affected households (Wondimu et al. Citation2015). Thus, PSM was applied to analyze the effect of LSAIs on the vulnerability status of displaced households using vulnerability indices (i.e. the average treatment effect on the treated). The PSM estimators, including the nearest neighbourhood (NN), Kernel, and Radius (with 0.05 caliper) matching methods, were applied to analyze the effect of displacement due to LSAIs on the vulnerability status of affected households. The displaced households and matched control units were compared based on a range of specific observable characteristics considering household vulnerability indices as an outcome of interest.
3.4.2.1. Model specification
Assuming that Y1 is the household vulnerability index of displaced households and Y0 is the household vulnerability index of the non-displaced units, the average effect of displacement due to LSAIs on the household vulnerability index is the difference between Y1 and Y0. Heckman et al. (Citation1997) and Smith and Todd (Citation2005) have denoted this as follows:
Where ATT is the average treatment effect on the household vulnerability index; X represents a multidimensional vector of pre-treatment household characteristics; and P indicates the displacement status of households where (P = 1 for displaced household, P = 0, otherwise).
E(/X, P = 1) is missing data as the household cannot be both displaced and non-displaced at the same time to analyze what would have happened to the affected unit in the absence of displacement. Such an unobserved counterfactual situation is subjected to ongoing debates in the academic circle. In order to address this, E(
/X, P = 1) is replaced by the mean household vulnerability index of a comparable control household (i.e. E(
/X, P = 0). The substitution is meant to bridge the gap created due to missing data (Rosenbaum Citation2002) and is referred to as the estimated mean household vulnerability index under the counterfactual condition. Then, the difference in household vulnerability index between the displaced and control unit is estimated as the average treatment effect of displacement due to LSAIs on the displaced household (i.e. the average difference in vulnerability index between the treated and control units) (Smith and Todd Citation2005) as follows:
3.4.2.2. Selection of covariates and balancing
The displaced households and control units were matched based on observable covariates. Two theoretical backgrounds have guided the selection of covariates for this study. These include a) that the covariates should not be affected by the treatment (i.e. forced displacement in our case); b) that the covariates simultaneously affect both the treatment and the outcome of interest (i.e. household vulnerability index in our case) (Caliendo and Kopeining Citation2008). Local knowledge and past study findings have also complemented the above theories during covariates identification.
4. Results
4.1. Descriptive results
This section discusses the external (environmental) and internal (socio-economic) factors related to the three dimensions of vulnerability (exposure, sensitivity, and adaptive capacity) and how the LSAIs’ induced displacement has affected such factors. The environmental factors relate to the exposure dimension of vulnerability, while the socio-economic factors relate to susceptibility and adaptive capacity dimensions. Indices of vulnerability dimensions are estimated using these factors toward the end of the section.
4.1.1. Environmental factors
Smallholder farmers in the study area were exposed to multiple climate change shocks in the past years. During this study, survey respondents were asked to identify the type and frequency of shocks they encountered during 2017 – 2019. The result indicated that rainfall variability is the most critical shock affecting most sample households, followed by floods and crop pest infestations. The commonly observed rainfall variability in the area included the late onset of rain, early withdrawal, irregular distribution, and limited rainfall intensity. However, not everyone was equally exposed to these shocks. The relationship between displacement due to LSAIS and exposure to rainfall variability was analyzed using the Chi-square test statistics. The result indicates that exposure to rainfall variability is not independent of farmers’ displacement conditions. A larger proportion of displaced households experienced rainfall variability (close to 80%) compared to the control households (33%). The difference is statistically significant at 1%, implying that displacement has driven the exposure of displaced farmers to rainfall variability (). Moreover, the displaced households have lost their irrigated lands within the Lake Ziway catchment and moved to marginal and dry areas, contributing to their increased exposure to rainfall variability.
Table 2. Environmental factors affecting exposure to shocks by displaced and non-displaced units.
On the contrary, exposure to floods and pest invasion is limited among the displaced households because the LSAIs have driven these households away from the Lake. On the other hand, a third of the non-displaced households experienced flooding because most of these households have farmlands close to Lake Ziway, which is often exposed to flooding during the Lake overflow. Similarly, the control households practice diversified cropping using irrigation from the Lake water and are more exposed to crop pests.
While nearly 80% of the displaced households experienced consecutive rainfall variability during 2017–2019, this is limited, and only 36% among the non-displaced households. The difference between the two comparison groups is statistically significant at 1%, implying that displacement has exacerbated the exposure of displaced households to shocks. Most displaced households (66%) experienced severe rainfall shortages during the 2019 production year compared to the control units (27%), leading to a significant loss of farm production among the affected families. In contrast, the majority of the non-displaced households (73%) were not affected by rainfall variability during a similar period due to ownership of irrigated lands. At times of rainfall shortage, the non-displaced households often count on their irrigation to prevent crop loss.
Survey respondents were also asked for their perceived precipitation and temperature changes over the last years (2017–2019). The result showed that a higher number of displaced households reported declining precipitation and increasing temperature than non-displaced households, which is significant at 5% and 1%, respectively ().
4.1.2. Social factors
Family characteristics and other social factors affect household susceptibility to shocks and their adaptive capacity to withstand the impacts. Factors such as marital status, age of heads of households, number of productive-age family size (15–64 years), location of household residence (rural/urban), and participation in local/traditional institutions were assessed and analyzed. The difference in the mean age of heads and productive-age family members between the displaced and control households was assessed using the t-test statistics. The result indicates that the mean age of heads of households in displaced households is significantly higher than the mean age of heads in non-displaced households, 48 years vis-a-vis 43 years. The difference is statistically significant at 1%. Old-aged heads lead the displaced households compared to the non-displaced units implying increased susceptibility to climate change shocks.
Similarly, the study result indicates that the displaced households have more productive age family sizes (4 members) than the control households (3 members). The difference is statistically significant at 1% (). The LSAIs’ driven shortage of farmland among the displaced households explains the variation between the displaced and control units. In displaced households, boys and girls have limited access to land inheritance due to land shortages arising from the LSAIs, and hence continue living together than setting up their own families. This means the cultural norm of land inheritance to boys and girls is broken due to the impact of LSAIs in displaced households. It also means that boys and girls within the displaced households tend to postpone marriage and continue depending on the elderly head of the household. The land shortage has forced over a fifth of the displaced households to change their residence from an agriculture-based rural occupation to a labor-based urban life (). This implies that displacement has affected multiple social factors, thereby predisposing the displaced households to shocks and undermining their adaptive capacity to withstand the impacts of shocks.
Table 3. Social factors affecting adaptive capacity/sensitivity to shocks by displaced and non-displaced units.
4.1.3. Economic factors
Differential access to economic resources and services lies at the core of varying susceptibility to shocks and adaptive capacity between individuals, groups, and societies. This study gathered and analyzed data on sample households’ access to economic resources, inputs, and services. The result indicates that the displaced households have limited ownership of irrigated land (0.1 ha) compared to the non-displaced households (0.5 ha), which is significant at 1% (). The displaced households also practice limited crop diversity (1.8 crops per season) compared to the control households (2.2 crops per season) with a 5% significance level. This implies that LSAIs have dispossessed the displaced households of their irrigated lands and undermined their capacity to diversify crops.
Table 4. Economic factors affecting adaptive capacity/sensitivity to shocks by displaced and non-displaced units - Economic factors.
Similarly, access to credit services and consumption of farm inputs such as fertilizer is insignificant among the displaced households (only 962 Ethiopian Birr (ETB) per household (HH) and 64 kg per hectare (ha), respectively) compared to the quantity of credit accessed by the non-displaced households (3,871 ETB/HH) and fertilizer applied by the same (108 kg/Ha). The livestock holding size of the surveyed households was also measured in Tropical Livestock Unit (TLU) using the conversion factor developed by Storck et al. (Citation2008). TLU is an approach that converts different animals into a standard measurement unit using conversion factors. The result indicates that the affected households have limited ownership of animals (4.8 TLU) compared to the non-displaced households (6.6 TLU), which is significant at 1%. This shows that displaced households have limited crop and livestock production and productivity. The survey result also indicates that the annual farm income of the displaced households is lower (ETB 5,280/Adult equivalent) than the annual farm income of the control households (45,458 ETB/Adult equivalent) with a 1% level of significance.
Various factors have contributed to the reduction of farm income of displaced households. These include loss of crop yield and death of animals due to climate change shocks, mainly rainfall variability. The study result indicates that the displaced households lost one-third of their harvest (29%) during the 2019 production year and 21% (2017–2019) due to rainfall shortage. In contrast, the impact of rainfall variability on the non-displaced households was limited, and only 11% harvest loss in 2019 and 7% loss during 2017 – 2019. The difference is statistically significant at 1%. Moreover, the displaced households have lost a significant number of animals (0.7 TLU) due to feeding shortages arising from the weather shocks compared to the non-displaced households (0.1 TLU) with a 1% significance level. This implies that displaced households have higher susceptibility and limited adaptive capacity in the face of climate change shocks.
The loss of crop harvest and animals due to shocks and consequent shortage of income means the displaced households are forced to face food consumption shortfall. During this study, household food intake from own production, market, and other sources was assessed using a week of consumption data gathered before the survey, converted into kilocalories (kcal), and adjusted for family size as measured in adult equivalent (AE). The result indicates that the daily consumption of displaced households was far below that of the non-displaced households (2,779 kcal/AE vs-a-vis 4,100 kcal/AE), which is significant at 1%. At times of food shortage due to shocks, the displaced households often rely on selling productive assets like farm tools and animals to bridge the food gap. The survey result indicates that a higher proportion of displaced households (35%) pursue this strategy to bridge consumption shortfalls than control households (23%). The difference is statistically significant at 1% (). This implies that displaced households have limited adaptive capacity to bridge their food gap, thereby lending them more susceptible to climate change shocks.
Displacement due to LSAIs was carried out mainly after 2000 when over 80% of sample affected households dislocated (). Only the remaining 20% were affected before the year 2000. On average, the displaced households have lost 1.7 hectares of farmland, including 0.5 ha of irrigated land. Overall, 70% of the displaced households received some cash compensation from the local government, while the rest, 30%, did not. Compensation is provided only for lost farmlands and demolished houses. No compensation was paid for lost perennial crops, fences, and communal pasturelands. The cash compensation size was limited, and only 228,629 ETB per hectare rarely enabled the recipients to restore their livelihoods. Low-rated cash compensation provided without any technical backstopping and other support.
4.1.4. Household vulnerability level
Indices for vulnerability dimensions (exposure, sensitivity, and adaptive capacity) and overall aggregate vulnerability index were estimated using relevant factors and steps described in above. PCA was executed to generate the weighting value for each variable after normalization. The index of each vulnerability dimension was generated as the average scores of associated variables. The overall aggregate vulnerability index was estimated as a net effect between the adaptive capacity score against the exposure/sensitivity scores.
Overall, 18 relevant factors or variables associated with the three dimensions of vulnerability were identified based on the above descriptive analysis and literature review results (Opiyo et al. Citation2014; Kebede et al. Citation2021). These include three variables of exposure: rainfall variability/flooding/crop pest invasion, respondents’ perception of change in precipitation, and temperature; 11 variables of adaptation capacity: number of productive-age household members, location of residence, participation in social groups/networks, land size, access to irrigation, crop diversity, fertilizer application, livestock ownership, farm income, household ownership of productive assets, and food consumption; and four variables of sensitivity: quantity of crop harvest lost due to shocks, number of animals died, household pursued negative coping strategy (coping through the disposal of productive assets), and age of heads households.
PCA was executed separately for each of the vulnerability dimensions. The first principal component with an eigenvalue greater than 1 that explains the largest proportion of variation was used to identify the factor loading for each variable (). Thus, the first principal component for adaptation capacity explains 26% of the variation, and the first principal components for sensitivity and exposure explain 38% and 59% of variations, respectively.
Table 5. PCA 1 factor loading.
In order to generate the indices for vulnerability dimensions, firstly, each variable’s factor load (weight) was multiplied by its normalized value to estimate the variable weighted value. Secondly, the weighted values of the associated variables were averaged to generate the score for each vulnerability dimension. Then, the vulnerability index of each household was estimated as a net difference between adaptive capacity and exposure/sensitivity using the 18 variables. Indices of each vulnerability dimension (exposure, sensitivity, adaptive capacity) and the overall aggregate vulnerability index were compared between the displaced and control households. A higher indices value for exposure and sensitivity implies more pre-disposition/susceptibility to shocks, and a higher index value for adaptive capacity implies a better capacity to cope and bounce back. The result indicates the displaced households have higher indices values for exposure and sensitivity and lower index value for adaptive capacity than the non-displaced households, with a significance level of 1% (). This implies that the displaced households are more exposed and susceptible to shocks and have limited adaptation capacity to cope/bounce back than the control units.
Table 6. Vulnerability indices and level.
The sample households were also grouped into three categories of vulnerability (less vulnerable, moderately vulnerable, and severely vulnerable) based on their vulnerability score (). Firstly, households with a vulnerability score (>1) are categorized as less vulnerable. These households have an adaptive capacity exceeding their exposure/sensitivity and are rarely impacted by climate change shocks. Secondly, households with a score value (−1 to +1) are categorized as moderately vulnerable. These households have an adaptive capacity that is more or less similar to their exposure/sensitivity level and thus can cope with the impact of shocks. Thirdly, households with negative scores (< −1) are categorized as a severely vulnerable group. These are households with adaptive capacity far below their exposure/sensitivity and thus less likely to cope or bounce back to their normal situation without external support. Studies have used a similar approach to categorize households into different vulnerability groups (Tesso et al. Citation2012; Opiyo et al. Citation2014). Our study result indicates that a limited proportion of displaced households are among the less/moderately vulnerable category (only 3%) compared to the control group (37%). On the other hand, a higher proportion of displaced households (97%) were found severely vulnerable compared to the non-affected households (63%) (). The difference between the two comparison groups is statistically significant at 1%, implying that several socio-economic and biophysical factors have forced displaced households to become more vulnerable to climate change shocks.
4.2. Empirical results
4.2.1. Covariates and balancing
As noted under the methods section above, four observable covariates complying with the two theoretical backgrounds underlying covariates selection were identified for balancing. These covariates include the sex of heads of households, marital status, education status of heads, and dependency ratio. Other variables, such as household land holding size or access to irrigated land, were excluded from covariates because these variables were affected by the treatment itself (i.e. forced displacement in our case). All households within the command area of the LSAIs were forced to hand over their lands to the investors. Moreover, farm income was excluded from covariates because this too was equally affected by the forced displacement.
Thus, the propensity scores were estimated for the sample displaced and control households using the four identified covariates and the Logit model. According to Sianesi (Citation2004) and Faltermeier and Abdulai (Citation2009), the Logit or Probit model is an appropriate analytical tool to generate matching scores for the study units, as the result of both models tends to converge. In this model, participation in displacement is considered a treatment variable (P = 1, displaced household; P = 0, control household).
The similarity of covariates distribution between the displaced and control units was assessed using a balancing test. Standardized mean differences and variance ratios were employed for this purpose. Sources defined such tests as appropriate tools to check the covariate distribution balance between the comparison units (Austin Citation2009; Lmai and Ratkovic Citation2014). In this study, the standardized mean difference was estimated as a difference between the mean of a covariate of comparison units divided by the square root of the mean of corresponding variances. On the other hand, the variance ratio was estimated as a quotient of variances of the comparison units. Thus, a perfectly balanced covariate has a standardized mean difference close to zero and a variance ratio close to one (Randolph et al. Citation2014). Accordingly to this study finding, the balancing test result confirms robust balancing of covariates distribution between the displaced and control units with a standardized mean difference close to zero and variance ratio close to one ().
Table 7. Standard error and variance ratio of matching variables.
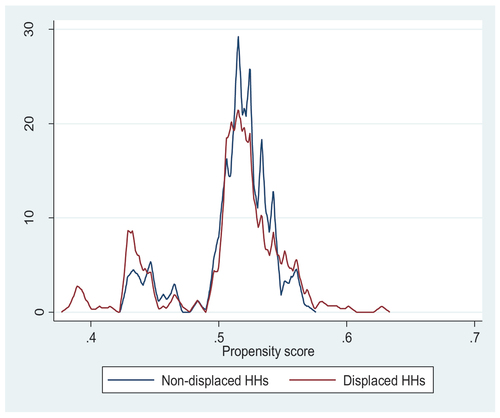
Balancing tests can also be illustrated through graphs constructed using propensity scores of covariates. Balancing plot and density functions are instrumental in this regard. The balancing plot constructed for the matched comparison groups using the propensity score of covariates fully overlaps, indicating that the common support assumption is satisfied (). Moreover, the density function plotted using the propensity score of covariates for the matched samples shows good balancing between the comparison groups ().
Figure 3. Balance plot.
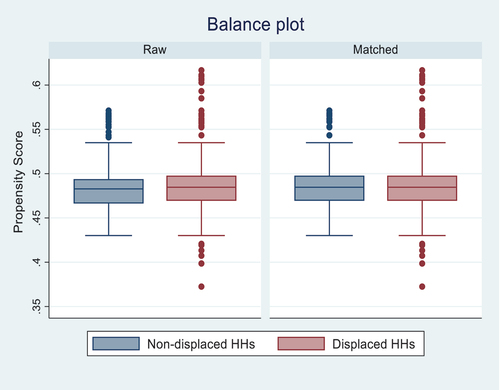
Figure 4. Balance graph.
4.2.2. Impact of LSAIs on the food security status of displaced households
Several PSM techniques were applied to assess the impact of displacement due to the LSAIs on the vulnerability status of affected households. Here, the household vulnerability index is used as an outcome variable. The higher the index value implies less household vulnerability and vice versa. The PSM result indicates an increased vulnerability of displaced households by over three-fold (>300%) among the displaced households compared to the control units, which is significant at 1% using Kernel, radius, and NN matching methods (). The findings are consistent among the three matching techniques implying robustness of the result. Overall, the finding shows that displacement due to LSAIs has worsened the vulnerability situation of affected households to climate change shocks by increasing their exposure and susceptibility to shocks and reducing their adaptive capacity to withstand the impacts. This finding is also consistent with available sources that indicate LSAIs worsened the vulnerability situation of displaced people and communities (Birthal and Hazrana Citation2019; Kebede et al. Citation2021; TDN et al. Citation2022).
Table 8. Impact of LSAIs on the vulnerability status of displaced households.
4.2.3. Sensitivity analysis
A sensitivity test was implemented to analyze if any unobservable confounders (U) caused bias to the treatment effect and the extent of such a bias. PSM cannot address the bias because it considers only the observable covariates, not the unobservable confounders. A considerable bias due to the unobservable confounders violates ignobility assumptions (Ichino et al. Citation2008). A simulation-based sensitivity technique was implemented to analyze the effect of potential confounders on the average treatment effect on the treated units. Many often prefer this technique for sensitivity analysis (Ichino et al. Citation2008; Kebede et al. Citation2021). The technique can be implemented by identifying and using potential unobservable confounders or assigning probabilities P11, P10, P01, and P00 called the ‘killer confounders’. In our case, we opted for the second approach because the first method (i.e. identifying confounders) is problematic. Thus, ‘killer confounders’ applied by assigning P11 = 0.80, P10 = 0.70, P01 = 0.60 and P00 = 0.30 with the mean household vulnerability indices. The analysis simulates a potential confounder to assess the robustness of the estimated treatment effect for deviations from the conditional independence assumption. The baseline and simulated average effect on the treated (ATT) was estimated using Kernel and radius matching methods. The result indicates that the simulation has increased the treatment effect by a limited quantity (0.6% using radius matching and 1% using kernel matching). In both cases, the increment due to the simulation was insignificant, implying the estimated treatment effect is robust ().
Table 9. Sensitivity analysis.
5. Discussion
This study’s descriptive and empirical findings indicate that the LSAIs’ induced displacement has exacerbated the vulnerability of displaced households in various ways. It has predisposed the smallholders to climate change shocks, increased their susceptibility, and undermined their adaptive capacity. These are discussed as follows:
The LSAIs have reduced the adaptive capacity of displaced households. Adaptive capacity comprises systems’ or people’s ability to adjust, cope with or recover from climate change shocks’ impacts (Jakku and Lynam Citation2010; Owusu et al. Citation2021b). It fundamentally refers to access to a resource that includes economic, human, social, and natural capital (Norris et al. Citation2008; Owusu et al. Citation2021b). At times of stress, affected smallholders count on these resources to reduce the impacts of shocks. However, this study finding indicates that the LSAIs have disowned the displaced households of their irrigated land. The descriptive analysis result indicates that irrigated landholding is insignificant among the displaced households (0.01 ha) compared to the control units (0.5 ha). This lies at the core of the livelihoods deterioration and increased vulnerability among the affected households. Existing sources indicate that limited access to irrigation exacerbates vulnerability to climate change shocks such as rainfall variability (Birthal and Hazrana Citation2019; Mary Citation2022). Other sources also indicated that LSAIs were detrimental to water resources, particularly irrigation water (Ingebretsen Citation2015). The quest for irrigation water is the core but often untold factor driving many LSAIs to poor countries, including Ethiopia (Woodhouse and Ganho Citation2011; Yengoh and Armah Citation2015; Kebede et al. Citation2021).
Among the poor countries encouraging land acquisition, including Ethiopia, several factors have incentivized the LSAIs to easily access lands with abundant water resources. These factors include a poor water regulation policy framework, weak enforcement mechanisms, and a lack of protection for smallholder irrigation users (World Bank Citation2011). In the case of Ethiopia, the country’s unrestricted access to water resource policy has favored the expansion of LSAIs to land areas closer to water bodies (lakes, rivers, swampy areas) and overlooked social justice (Ingebretsen Citation2015) This implies that the country’s policy frameworks around water source use and LSAIs marginalize the displaced smallholders and weaken their adaptation capacity by transferring their irrigated lands to investors.
Dispossession of irrigated land means displaced households are forced to depend on unreliable rain-fed farming. Under the rain-fed mode of production, sustained harvest is not guaranteed in the face of climate change shocks, particularly rainfall shortage or variability (Owusu et al. Citation2021b; Mary Citation2022). This study finding has confirmed this reality. The displaced households have lost nearly a quarter of their annual harvest due to severe rainfall shortages during the 2019 production year as compared to the non-displaced farmers. The latter often switch to the irrigated mode of production at times of rainfall shortage to reduce harvest loss. Other similar studies confirmed that rainfall variability is one of the most critical detrimental factors affecting harvests (Bahiru et al. Citation2020; Eshetie Citation2021; TDN et al. Citation2022); climate change shocks can reduce crop yield by up to 18% (Davis et al. Citation2015). This implies that displaced households were forced to rely on a rain-fed mode of production, increasing their susceptibility to shocks’ impacts and weakening their adaptive capacity.
The LSAIs have also undermined the livestock-based earning of the displaced smallholders. This study finding indicates that animal holding size and milk yield were significantly reduced among the displaced households compared to the control unit. This implies that LSAIs have contributed to weakening the adaptation capacity of displaced smallholders by undermining their livestock production and productivity. Other similar findings also indicated a significantly negative impact of LSAIs on the livestock-based livelihoods of affected households through reduced access to grazing land and water (Elias and Abdi Citation2010; Abbink Citation2011).
At times of climate shocks, displaced households are more likely to encounter fundamental consumption shortfalls such as food. This study result and other sources indicated that displacement had worsened food shortages among the affected households (Malkamaki et al. Citation2018; Muller et al. Citation2021). Under this circumstance, smallholders count on their asset possession to mitigate or cope with the impacts of shocks. However, this study finding indicates that the displaced households’ productive asset possession (farm tools and equipment) has reduced by 60% compared to the non-affected households. The fact that the majority of the displaced households (35%) disposed of these assets to buy food and other essential consumption items has contributed to the significant deterioration of the assets of displaced farmers. Similar studies have also confirmed that LSAIs have exposed smallholders to losing valuable assets and undermined their adaptive capacity (Zaehringer et al. Citation2021).
Displacement due to LSAIs has also increased the exposure and susceptibility of affected households. According to this study result, the displaced households were evicted by the LSAIs from their productive land and pushed to marginal and arid areas. Farming in such areas is more exposed to shocks such as rainfall variability and land degradation and susceptible to harvest and income loss. The fact that the displaced households got limited harvest compared to the control units evidence this. Similar studies also indicated that LSAIs had coerced the displaced communities to occupy marginal lands and significantly reduced their farm yield and income (Davis et al. Citation2015; Kebede et al. Citation2021). This implies that LSAIs have worsened the exposure and susceptibility of displaced smallholders to climate change shocks.
6. Conclusion
LSAIs’ engagement in poor countries, including Ethiopia, is increasing at an unprecedented rate. For these investments, reducing uncertainties and maximizing profit are the key drivers of their expansion. However, such drivers are often at the expense of the displaced smallholders in poor countries. This study result confirms that LSAIs have exacerbated the vulnerability of displaced smallholders to climate change shocks by creating socio-economic inequalities and increased exposure to shocks. The displaced smallholders suffered from increased vulnerability to shocks due to their limited adaptation capacity, growing exposure to shocks, and susceptibility to impacts. Limited protection for displaced farmers and the lack of relevant adaptation mechanisms have worsened the vulnerability situation of affected smallholders. This implies that increased vulnerability constitutes a critical impact area of LSAIs on displaced farmers. It also implies that the traditional approach to addressing the impact of LSAIs without considering its vulnerability aspect is insufficient. Therefore, any efforts to improve the situation of the displaced farmers should put in place an appropriate adaptation strategy to ensure that the affected people have better protection and the means and resources to counteract vulnerabilities arising from land deals.
Additional information
The data supporting the findings of this study are available from the corresponding author, Mr. Dereje Kebede, upon reasonable request.
Authors’ contribution
All authors contributed to the conceptualization, methodology design, data analysis, and review & editing of the draft manuscript. All authors have read and agreed with the content of this article.
Acknowledgment
Prof Stephen Devereux from IDS has provided valuable inputs and advice in this research at different stages – proposal preparation, design of field data collection instruments, data analysis, and validation of this article.
Disclosure statement
No potential conflict of interest was reported by the author(s).
Correction Statement
This article has been corrected with minor changes. These changes do not impact the academic content of the article.
Additional information
Funding
References
- Aabo E, Kring T. 2010. The political economy of large-scale agricultural land acquisitions: implications for food security and livelihoods/employment creation in rural Mozambique. Maputo, Mozambique: United Nations Development Program; pp. 643–660.
- Abbink J. 2011. Land to the foreigners: economic, legal, and socio-cultural aspects of new land acquisition schemes in Ethiopia. J Contemp Afr Stud. 29:513–535. doi:10.1080/02589001.2011.603213.
- Adamitulu Investment Office. District office database of expropriated land to large scale agricultural investments. Status (Unpublished)
- Adger WN. 2006. Vulnerability. Global Environ Change. 16:68–281. doi:10.1016/j.gloenvcha.2006.02.006.
- Adger WN, Kelly PM. 1999. Social vulnerability and the architecture of entitlements. Mitigation Adapt Strateg Global Change. 4:253–266. doi:10.1023/A:1009601904210.
- Anseeuw W, Boche M, Breu T, Giger M, Lay J, Messerli P, Nolte K. 2012. Transnational Land Deals for Agriculture in the Global South. Analytical Report based on the Land Matrix Database. CDE/CIRAD/GIGA; pp. 3–40.
- Atuoye KN, Luginaah I, Hambati H, Campbell G. 2021. Who are the losers? Gendered-migration, climate change, and the impact of large-scale land acquisitions on food security in coastal Tanzania. Land Use Policy. 101:105154. doi:10.1016/j.landusepol.2020.105154.
- Austin PC. 2009. The relative ability of different propensity score methods to balance measured covariates between treated and untreated subjects in observational studies. Med Decis. 29:661–677. doi:10.1177/0272989X09341755.
- Bahiru W, Wende E, Mohammed L, Mohammed Y, Adem H, Demmisie Y. 2020. Assessing the impacts of rainfall variability on Teff production and farmers perception at Gubalafto district, North Easter, Ethiopia. Int J Earth Sci Geophys. 6:2–19. doi:10.35840/2631-5033/1842.
- Baker JL. 2000. Evaluating the impact of development projects on poverty: a handbook for practitioners. Washington, DC: World Bank; pp. 65–85.
- Barrett C, Bachke M, Bellemare M, Michelson H, Narayanan S, Walker T. 2012. Smallholder participation in contract farming: comparative evidence from five countries. World Dev. 40:715–730. doi:10.1016/j.worlddev.2011.09.006.
- Baumgartner P, Joachim V, Degnet A, Marc M. 2015. Impacts of large-scale land investments on income, prices, and employment: empirical analyses in Ethiopia. World Dev. 72:175–190. doi:10.1016/j.worlddev.2015.02.017.
- Birkmann J. 2007. Risk and vulnerability indicators at different scales: applicability, usefulness and policy implications. Environ Hazards. 7:20–31. doi:10.1016/j.envhaz.2007.04.002.
- Birthal PS, Hazrana J. 2019. Crop diversification and resilience of agriculture to climatic shocks: evidence from India. Agric Syst. 173:345–354. doi:10.1016/j.agsy.2019.03.005.
- Bora K. 2022. Rainfall shocks and fertilizer use: a district level study of India. Environ Dev Econ. 1–22. doi:10.1017/s1355770x21000413.
- Breu T, Bader C, Messerli P, Heinimann A, Rist S, Eckert S. 2016. Large-scale land acquisition and its effects on the water balance in investor and host countries. PLoS ONE. 11:2–15. doi:10.1371/journal.pone.0150901.
- Brooks N. 2003. Vulnerability, risk, and adaptation: a conceptual framework. Tyndall Centre for Clim Change Res. 38:1–16.
- Brooks N, Adger WN, Kelly PM. 2005. The determinants of vulnerability and adaptive capacity at the national level and the implications for adaptation. Global Env Change. 15:151–163. doi:10.1016/j.gloenvcha.2004.12.006.
- Caliendo M, Kopeining S. 2008. Some practical guidance for implementing propensity score matching. J Eco Surveys. 22:31–72. doi:10.1111/j.1467-6419.2007.00527.x.
- Cardona OD, van Aalst MK, Birkmann J, Fordham M, McGregor G, Perez R, Pulwarty RS, Schipper ELF, Sinh BT. 2012. Determinants of risk: exposure and vulnerability. In: Keim M Decamps H, editors. Managing the risks of extreme events and disasters to advance climate change adaptation. Cambridge, UK, and New York, NY, USA: Cambridge University Press; pp. 65–108.
- Cochran WJ. 1977. Sampling techniques. 3rd ed. USA: John Wiley & Sons.
- Cochrane L, Legault DD. 2020. The rush for land and agricultural investments in Ethiopia: what we know and what we are missing. Land. 9:167. doi:10.3390/land9050167.
- Codjoe SNA, Atiglo DY. 2020. The implications of extreme weather events for attaining the sustainable development goals in sub-saharan Africa. Front Clim. 2:1–9. doi:10.3389/fclim.2020.592658.
- Crane TA, Delaney A, Tamás PA, Chesterman S, Ericksen P. 2017. A systematic review of local vulnerability to climate change in developing country agriculture: in search of transparency, coherence, and comparability. Climate Change. 8:8. doi:10.1002/wcc.464.
- CSA. 2017. Population projection of Ethiopia for all regions at district level from 2014 – 2017. Ethiopia: Central Statistical Authority. p. 100–110
- Davis KF, D’Odorico P, Cristina M. 2014. Land grabbing: a preliminary quanti?cation of economic impacts on rural livelihoods. Popul Environ. 36:180–192. doi:10.1007/s11111-014-0215-2.
- Davis KF, Rulli MC, D’Odorico P. 2015. The global land rush and climate change. Earth’s Future. 3:298–311. doi:10.1002/2014EF000281.
- Dehejia R, Wahba S. 1999. Causal effects in non-experimental studies: reevaluating the evaluation of training programs. J American Stat Ass. 94:1053–1062. doi:10.1080/01621459.1999.10473858.
- Deininger K, Byerlee D, Lindsay J, Norton A, Selod H, Stickler M. 2011. Rising global interest in farmland - can it yield sustainable and equitable benefits? The WorldBank, USA.
- Deressa T, Hassan RM, Ringler C. 2008. Measuring Ethiopian farmers’ vulnerability to Climate Change across regional states, IFPRI discussion paper No. 806. Washington, DC. http://www.ifpri.org/pubs/dp/ifpridp00806.asp
- D’Odorico P, Rulli MC, Dell’Angelo J, Davis KF. 2017. New frontiers of land and water commodification: socio-environmental controversies of large-scale land acquisitions. LDD. 28:2234–2244. doi:10.1002/ldr.2750.
- Elias E, Abdi F. 2010. Putting Pastoralists on the Policy Agenda Land Alienation in Southern Ethiopia. Gatekeeper series. [accessed 2022 Jan]. http://pubs.iied.org/pdfs/14599IIED.pdf
- Eshetie GG. 2021. Impact of rainfall variability on crop yields and its relationship with sea surface temperature in northern Ethiopian Highlands. Arab J Geosci. 14:14. doi:10.1007/s12517-021-08316-4.
- Faltermeier L, Abdulai A. 2009. The impact of water conservation and intensification technologies: empirical evidence for rice farmers in Ghana. J Int Assoc Agri Econ. 40:365–379. doi:10.1111/j.1574-0862.2009.00383.x.
- Feng X, Liu M, Huo X, Ma W. 2017. What motivates farmers’ adaptation to climate change? The case of apple farmers of Shaanxi in China. Sustainability. 9:9. doi:10.3390/su9040519.
- Fussel HM. 2005. Vulnerability in climate change research: A comprehensive conceptual framework. Paper 6. International and area studies, University of California, 3–29 http://repositories.cdlib.org/ucias/breslauer/6
- Fussel H. 2007. Vulnerability: a generally applicable conceptual framework for CC research. Global Env Change. 17:155–167. doi:10.1016/j.gloenvcha.2006.05.002.
- Gbetibouo GA; Ringler C. 2009. Mapping South African farming sector vulnerability to climate change and variability. A subnational assessment. Discussion Paper 00885. Washington, DC: IFPRI.
- Guan X, Ma W, Zhang J, Feng X. 2021. Understanding the extent to which farmers are capable of mitigating climate change: a carbon capability perspective. J Cleaner Prod. 325:325. doi:10.1016/j.jclepro.2021.129351.
- Gupta AK, Negia M, Nandy S, Kumara M, Singh V, Valente D, Petrosillo I, Pandeya R. 2020. Mapping socio-environmental vulnerability to climate change in different altitude zones in the Indian Himalayas. Ecol Indic. 109. doi:10.1016/j.ecolind.2019.105787.
- Hailegiorgis AB. 2013. Computational Modeling of Climate Change, Large-Scale Land Acquisition, and Household Dynamics in Southern Ethiopia [ Ph.D. Thesis]. Fairfax, VA, USA: George Mason University. Submitted.
- Hajjar R, Ayana AN, Rutt R, Hinde O, Liao C, Keene S, Badji SB, Agrawal A. 2020. Capital, labor, and gender: the consequences of large-scale land transactions on household labor allocation. J Peasant Stud. 47:566–588. doi:10.1080/03066150.2019.1602520.
- Heckman J, Ichimura H, Und Todd P. 1997. Matching as an econometric evaluation estimator: evidence from evaluating a job training program. Rev Econ Stud. 64:605–654. doi:10.2307/2971733.
- Ichino A, Mealli F, Nannicini T. 2008. From temporary help jobs to permanent employment: what can we learn from matching estimators and their sensitivity? J App Econ. 23:305–327. doi:10.1002/jae.998.
- Ingebretsen E. 2015. A Thirsty third world: how land grabs are leaving Ethiopia in the dust. J Gender Water. 4:94–100. https://repository.upenn.edu/wh2ojournal/vol4/iss1/11.
- IPCC. 2001. Climate change: the scientific basis [accessed 2021 Sept 20].
- IPCC. 2012. Managing the risks of extreme events and disasters to advance climate change adaptation, a special report of working groups I and II of the Intergovernmental Panel on Climate Change. Cambridge, UK, and New York, NY, USA. Cambridge University Press.
- IPCC. 2018. Summary for Policymakers: special Report on the impacts of global warming of 1.5°C above pre-industrial levels and related global greenhouse gas emission pathways, in the context of strengthening the global response to the threat of climate change, sustainable development, and efforts to eradicate poverty; IPCC
- Jakku E, Lynam T. 2010. What is adaptive capacity? Report for the South East Queensland climate adaptation research initiative Brisbane. CSIRO Sustainable Ecosyst.
- Kebede D, Tesfay G, Emana B. 2021. Impact of land acquisition for large-scale agricultural investments on income and asset possession of displaced households in Ethiopia. Heliyon. 7:1–12. doi:10.1016/j.heliyon.2021.e08557.
- Kelly PM, Adger WN. 2000. Theory and practice in assessing vulnerability to climate change and facilitation adaptation. Clim Change. 47:925–1352. doi:10.1023/A:1005627828199.
- Kidemu M, Gebreyesus M, Semere M, Worku A, Anjulo A. 2020. Traditional Ecological knowledge for climate change assessment and rainfall prediction: a case of Adamitulu Jido Kombolcha District, Oromia region, Ethiopia. Int J Nat Res Ecol Manage. 5:43–48. doi:10.11648/j.ijnrem.20200502.12.
- Laitonjam N, Singh R, Feroze SM. 2018. Vulnerability to climate change: review of conceptual framework. Econ Aff. 63:473–479. doi:10.30954/0424-2513.2.2018.25.
- Land Matrix. 2021. Taking stock of the global land rush: few development benefits, many human and environmental risks—analytical report III. CDE/CIRAD/GIGA/University of Pretoria, 7–87
- Liverman DM. 1990. Vulnerability to global environmental change: understanding global environmental change. J Hum Ecol. 29:47–55.
- Lmai K, Ratkovic M. 2014. Covariate balancing propensity score. J R Stat Soc B. 76:243–263. doi:10.1111/rssb.12027.
- Madu IA. 2012. Partial vulnerability of rural households to climate change in Nigeria: Implication for internal security, working paper number 2. USA: University of Texas.
- Malkamaki A, D’Amato D, Hogarth NJ, Kanninen M, Pirard R, Toppinen A. 2018. A systematic review of the socio-economic impacts of large-scale tree plantations worldwide. Global Environ Change. 53:90–103. doi:10.1016/j.gloenvcha.2018.09.001.
- Mary S. 2022. Dams mitigate the effect of rainfall shocks on Hindus-Muslims riots. World Dev. 150. doi:10.1016/J.WORLDDEV.2021.105731.
- Muller MF, Penny G, Niles MT, Ricciardi V, Chiarelli DD, Davis KF, Angelo JD, D’Odorico P, Rosa L, Rulli MC, et al. 2021. Impact of transnational land acquisitions on local food security and dietary diversity. PNAS. 118:1–8 [accessed 2021 Sept 14]. doi:10.1073/pnas.2020535118.
- Muller A, Schader C, Scialabba NE-H, Brüggemann J, Isensee A, Erb K-H, Smith P, Klocke P, Leiber F, Stolze M, et al. 2017. Strategies for feeding the world more sustainably with organic agriculture. Nat Commun. 8:1290. doi:10.1038/s41467-017-01410-w.
- Nelson R, Kokic P, Crimp S, Martin P, Meinke H, Howden SM, De Voil P, Nidumolu U. 2010. The vulnerability of Australian rural communities to climate variability and change: part II - integrating impacts with adaptive capacity. Environ Sci Policy. 13:18–27. doi:10.1016/j.envsci.2009.09.007.
- Nkansah DE. 2021. Can large-scale land acquisition deals improve livelihoods and lift people out of poverty in sub-Saharan Africa? Empirical evidence from Tanzania. J Agri Food Syst Community Dev. 10:243–264. doi:10.5304/jafscd.2021.103.013.
- Nkansah DE, Raschke AB. 2021. Justice and fairness for Mkangawalo people: the case of the Kilombero Large-scale land acquisition (LasLA) project in Tanzania. Ethics Policy Environ. 24:137–163. doi:10.1080/21550085.2020.1848187.
- Norris FH, Stevens SP, Pfefferbaum B, Wyche KF, Pfefferbaum RL. 2008. Community resilience as a metaphor, theory, set of capacities, and strategy for disaster readiness. Am J Community Psychol. 41:127–150. PMID: 18157631. doi:10.1007/s10464-007-9156-6.
- O’Brien K, Leichenko R, Kelkar U, Venema H, Aandahl G, Tompkins H, Javed A, Bhadwal S, Barg S, Nygaard L, et al. 2004. Mapping vulnerability to multiple stressors: climate change and Globalization in India. Global Environ Change. 14:303–313. doi:10.1016/j.gloenvcha.2004.01.001.
- Opiyo FE, Wasonga OV, Niangto MM. 2014. Measuring household vulnerability to climate-induced stresses in pastoral rangelands of Kenya: implications for resilience programming. Pastoralism. 4:10. doi:10.1186/s13570-014-0010-9.
- Oromia Investment Office. Oromia region database of expropriated land to large scale agricultural investment in the region. Status (Unpublished)
- Owusu V, Ma W, Emuah D, Renwick A. 2021a. Perceptions and vulnerability of farming households to climate change in three agro-ecological zones of Ghana. J Cleaner Prod. 293:293. doi:10.1016/j.jclepro.2021.126154.
- Owusu V, Ma W, Renwick A, Emuah D. 2021b. Does the use of climate information contribute to climate change adaptation? Evidence from Ghana. Climate Dev. 13:616–629. doi:10.1080/17565529.2020.1844612.
- Pulwarty RS, Riebsame WE. 1997. The political ecology of vulnerability to Harricane related hazards. Hurricanes. 185–214. doi:10.1007/978-3-642-60672-4_9.
- Rahmato D. 2014. The perlis of development from above: land deals in Ethiopia. African Identities. 12:26–44. doi:10.1080/14725843.2014.886431.
- Randolph JJ, Kristina F, Kureethara MA, Joseph LB. 2014. A step-by-step guide to propensity score matching. Prac Assess Eva. 19:1–5.
- Richards M. 2013. Social and Environmental Impacts of Agricultural Large-Scale Land Acquisitions in Africa—With a Focus on West and Central Africa. Washington, DC: Rights and Resources Initiative.
- Rosenbaum P. 2002. Observational studies. New York: Springer.
- Salverda T. 2019. Facing criticism: An analysis of (land-based) corporate responses to the large-scale land acquisition countermovement. J of Peasant Studies. 46:1003–1020. doi:10.1080/03066150.2018.1439930.
- Scoones I, Smalley R, Hall R, Tsikata D. 2019. Narratives of scarcity: framing the global land rush. Geoforum. 101:231–241. doi:10.1016/j.geoforum.2018.06.006.
- Serdeczny O, Adams S, Baarsch F, Coumou D, Robinson A, Hare W, Schaeffer M, Perrette M, Reinhardt J. 2017. Climate change impacts in Sub-Saharan Africa: from physical changes to their social repercussions. Reg Environ Change. 17:1585–1600. doi:10.1007/s10113-015-0910-2.
- Sianesi B. 2004. An evaluation of the Swedish system of active labor market programs in the 1990s. Rev Econ Stat. 86:133–155. doi:10.1162/003465304323023723
- Smith J, Todd P. 2005. Does matching overcome LaLondes critique of non-experimental estimators? J Econometrics. 125:305–353. doi:10.1016/j.jeconom.2004.04.011.
- Storck H, Emana B, Adenew B, Borowiecki A; W/Hawariat S. 2008. Farming systems and farm management practices of smallholders in the Hararghe highlands; Wissenschaftsverlag vauk kiel: Germany, 1991, 188 - 200Tadesse Y.Assessment of the Impact of Productive Safety Net Program on Household welfare: The case of Adami Tulu Jido Kombolcha Wereda, East Shoa, Oromia Regional State [ MA Thesis]. Ethiopia: Addis Ababa University
- Sulle E. 2017. Social differentiation and the politics of land: sugar cane outgrowing in Kilombero, Tanzania. J South Afr Stud. 43:517–533. doi:10.1080/03057070.2016.1215171.
- TDN H, Tsusaka TW, Kuwornu JKM, Datta A, Nguyen LT. 2022. Do rice varieties matter? Climate change adaptation and livelihood diversification among rural smallholder households in the Mekong Delta region of Vietnam. Mitigation Adapt Strategies Global Change. 27:27. doi:10.1007/s11027-021-09978-x.
- Tesso G. 2013. Individual level vulnerability to climate change impact among crop dependent communities in western Ethiopia. J Agric Econ Dev. 2:356–370.
- Tesso G, Emana B, Ketema M. 2012. Analysis of vulnerability and resilience to climate change induced shocks in North Shewa, Ethiopia. J Agric Sci. 3(6):871–888. doi:10.4236/as.2012.36106.
- Timmerman P. 1981. Vulnerability, resilience and the collapse of society: a review of models and possible climatic applications. Toronto, Canada: Institute for Environmental Studies, University of Toronto.
- Turner BL, Kasperson RE, Matson PA, McCarthy JJ, Corell RW, Christensen L, Eckley N, Kasperson JX, Luers A, Martello ML, et al. 2003. A framework for vulnerability analysis in sustainability science. Proc Natl Acad Sci U S A. 100:8074–8079. doi:10.1073/pnas.1231335100
- United Nations. 2004. Application of methods and tools for assessing impacts and vulnerability and developing adaptation responses: background paper Note/by the Secretariat. Geneva: UN, 6–70
- Waterhouse R, Lauriciano G, Norfolk S. 2010. Social analysis of selected projects issues note & case studies: large-scale land acquisition for agricultural production in Mozambique. Washington DC: World Bank.
- Wheeler T, Von Braun J. 2013. Climate change impacts on global food security. Science. 341:508–513. doi:10.1126/science.1239402.
- Wondimu M, Henningsen A, Gibbon P. 2015. Sugarcane out-growers in Ethiopia: ‘Forced’ to remain poor? [ Ph.D. thesis]. Denmark: University of Copenhagen
- Woodhouse P, Ganho AS. 2011. Is water the hidden agenda of agricultural land acquisition in sub-saharan Africa? Discussion paper on International Conference on Global Land Grabbing; Apr 06–08; UK: University of Sussex.
- World Bank. 2010. Rising global interest in farmland and the importance of responsible agricultural investment. Washington DC, USA: World Bank.
- World Bank. 2011. Rising global interest in farmland. Washington DC, USA: World Bank.
- Yengoh G, Armah F. 2015. Effects of large-scale acquisition on food insecurity in Sierra Leone. Int J Sustainability. 7:17–25. doi:10.3390/su7079505.
- Yuga NG, Shivakoti PG, Sylvain RP. 2010. Household-level vulnerability to drought in hill agriculture of Nepal: implications for adaptation planning. Int J Sustainable Dev World Ecol. 17:225–230. doi:10.1080/13504501003737500.
- Zaehringer JG, Messerli P, Giger M, Kiteme B, Atumane A, Da Silva M, Rakotoasimbola L, Eckert S. 2021. Largescale agricultural investments in Eastern Africa: consequences for small-scale farmers and the environment. Ecosystems People. 17:342–357. doi:10.1080/26395916.2021.1939789.
- Zaehringer JG, Wambugu G, Kiteme B, Eckert S. 2018b. How do large-scale agricultural investments affect land use and the environment on the western slopes of Mount Kenya? Empirical evidence based on small-scale farmers’ perceptions and remote sensing. J Environ Manage. 213:79–89. doi:10.1016/j.jenvman.2018.02.019.
- Zeleke T, Beyene F, Deressa T, Yousuf J, Kebede T. 2021. Vulnerability of Smallholder Farmers to Climate Change-induced Shocks in East Hararghe Zone, Ethiopia. Sustainability. 13:1–19. doi:10.3390/su13042162.