
ABSTRACT
Agrarian change affects the supply and demand of ecosystem services (ES) by reducing the extent of natural ecosystems. Agricultural intensification can lead to changes in land covers and livelihood opportunities and it remains unclear how such changes align or misalign with the desires of local communities. Using participatry mapping, we assessed ES uses and desires of Indigenous people and local communities provided by different land cover types along a gradient of agricultural intensification (forest subsistence, agroforestry mosaic, and monoculture and market-dependence) in West Kalimantan, Indonesia. We found that mapped ES use diversity was highest in the forest-dependent zone and lowest near monoculture agricultural systems. The expressed ES uses and desires varied greatly among land cover types amidst loss of old-growth forest and greater reliance on secondary forest and shrub land. The spatial analysis showed that high priority areas of ES use was related to access in the landscape, demonstrating the importance of attending to place-based social values in ES assessments. From this study, we call for a people-centric spatial modelling approach to address the divergence of social and cultural ES values associated with land covers under different intensification contexts. Participatory mapping clarifies the ES desires of local communities, which state policy often fails to address. We recommend a place specific management strategy to reduce ES trade-offs of specific land use practices, which are currently apparent with agrarian change in Indonesia and relevant for other tropical developing countries.
EDITED BY:
1. Introduction
Agrarian change in the form of a shift from forest subsistence to market-oriented agricultural and tree crops, has a dynamic effect on rural people’s livelihoods, access and use of ES in tropical developing countries (Sunderland et al. Citation2017, Ahammad et al., Citation2021). Agricultural intensification that promotes homogenous land cover with the aim to maximize single commodities (e.g. palm oil, rubber and other commodity crops) engenders starkly different lifestyles and cultural values than those that encompass natural forests and agroforestry mosaics (Colchester and Chai Citation2011; Tscharntke et al. Citation2012; Cramb and McCarthy Citation2016; Rasmussen et al. Citation2018; Albizua et al. Citation2019; Yuliani et al. Citation2020). For instance, the modification of swidden agriculture to cash crops and industrial plantations has affected Indigenous people and local communities (IPLC) ability to access and maintain their traditional ecological knowledge, food sources, and cultural practices within diverse land uses in developing tropical regions (Orth Citation2007; van Vliet et al. Citation2012; Levang et al. Citation2016; Euler et al. Citation2017; Fantini et al. Citation2017; Pirard et al. Citation2017). The changes brought by intensification (e.g. increased tree plantations) can secure income for those with adequate capital, land rights and access to government support (Coomes et al. Citation2011;Vongvisouk et al. Citation2014; Edwards Citation2015; Thaler and Anandi Citation2017), at the expense of a socially equitable transition to ensure multiple benefits (e.g. D’amato et al. Citation2017; Dressler et al. Citation2017). The social and ecological effects of agrarian changes become place-specific due to historic uses of land, scale and configuration of the landscape, and land tenure arrangements (Laurance et al. Citation2014; Pingarroni et al. Citation2022). However, the extent that changing land use practices and landscape configurations will satisfy the needs and desires of IPLC depends on their values and preferences and how access to ES changes in the shifting landscape (Orth Citation2009; Feintrenie et al. Citation2010; Grass et al. Citation2020).
ES are classically conceived as being driven by land use and land cover changes, but attention has now shifted to the importance of recognizing the dynamic role of social practices as embedded within the culture of IPLC as critical drivers of ES changes (Raymond et al. Citation2009; Brown and Reed Citation2012; Chakib Citation2014; Palomo et al. Citation2014). Tracking both biophysical land cover changes and changes in social uses of ES are important in dynamic landscapes. Certain ES may become more desired by IPLC (i.e. food, fuel, carbon) due to increasing economic values associated with agrarian livelihoods that become available through increasing connectivity to factors of production and regional and global market. However, the importance and decline of many ES (i.e. regulating and cultural) in a multifunctional landscape, may go unseen in conventional land use planning that relies on coarse-scale biophysical mapping and excludes IPLC (Bennett et al. Citation2009; Eigenbrod et al. Citation2010; Power Citation2010; Chakib Citation2014; Howe et al. Citation2014; Freeman et al. Citation2015; Berbés-Blázquez et al. Citation2016; Fish et al. Citation2016; Bennett Citation2017; Reed et al. Citation2017; Chan and Satterfield Citation2020). Local people’s experiences with ES trends associated with different land covers can help identify the occurrence and social implications of trade-offs as well as underlying drivers and needed interventions to achieve ecological sustainability at the landscape scale (Angelstam et al. Citation2018; Ahammad et al. Citation2019, Citation2022). Furthermore, incorporating Indigenous and local knowledge (ILK) and associated values of nature’s contributions to people (Pascual et al. Citation2017; Díaz et al. Citation2018) in terms of ES uses and desires provides a deeper understanding of the way IPLCs perceive and interact within their landscape.
The participatory mapping approach provides an opportunity to assess local perceptions of landscape multi-functionality by incorporating ILK through place-based mapping (Sieber Citation2006; De Groot et al. Citation2010; Brown and Reed Citation2012; Boedhihartono et al. Citation2015; Brown and Fagerholm Citation2015; Ramirez-Gomez et al. Citation2017). This approach actively incorporates IPLC experiences of perceived landscape change and the spatial variation of ES supply to deliver a more equitable and collaborative landscape planning (Palomo et al. Citation2014; García-Nieto et al. Citation2015; Ramirez-Gomez et al. Citation2017). The approach can take into account the land uses and needs of IPLC, giving them a voice and democratizing the decision-making process of spatial planning over traditional biophysical mapping that faces social complexity and political negotiation (Andrew et al. Citation2014; Brown and Fagerholm Citation2015). While participatory mapping is applied in various social and ecological contexts, there have been limited studies on landscape gradients, particularly within the forest-agriculture frontiers (Palomo-Campesino et al. Citation2018). A limited understanding exists on how agrarian change meets local communities’ desires for ES under different intensification gradients. Participatory mapping overcomes this by assessing IPLCs knowledge of ES trade-offs that may occur with agrarian change. At the same time, the approach could minimise conflicting goals among competing land uses and enhance synergistic opportunities within and across ES.
Given this context, this study aimed to assess ES use and desires of IPLCs across a gradient of agricultural intensification in the Kapuas Hulu Regency of West Kalimantan in Indonesia. The study region has experienced agrarian change that typifies a transition from forest land use and smallholder agriculture (primarily swidden farmer/shifting cultivators) through to mixed agroforestry (rubber plantation) and large-scale commercial oil palm planting (Lambin et al. Citation2003; Leonald and Rowland Citation2016; Yuliani et al. Citation2020). By applying participatory mapping techniques, we addressed the following two research questions: (1) what are the local perceptions of ES uses and desires of IPLCs across a gradient of agricultural intensification? and (2) where are the high priority areas of multiple ES that people have accessed across the three zones. The spatially explicit assessment of people’s knowledge, use, and desires of ES across a gradient of land uses provides a context-specific understanding of ES trade-offs while bringing local stakeholders’ connection to ES to the center-stage of landscape planning. In the context of agrarian changes, participatory mapping is beneficial to determine the perceived changes in ES flow around specific landscape gradients.
2. Materials and methods
2.1. Description of the study area
West Kalimantan is a region of high biodiversity in Indonesia, with a large amount of tropical forest covering over 70% of its total land. Kapuas Hulu is a district in West Kalimantan with the highest rate of remaining intact forests, and the subject area of this study. Over half (57%) of the forest in Kapuas Hulu is under some form of conservation protection, which is above the average in West Kalimantan (26%) (Shantiko et al. Citation2013). The two national parks, Betung Kerihun and Danau Sentarum, have a 30% forest cover and high biodiversity, including endemic and flagship species, i.e. Bornean orang-utan and the proboscis monkey. Most forests, including national parks and protected forests, are state owned and controlled by district administration, which restrict hunting and gathering of forest products. The IPLC are given special permission to extract non-timber forest products (NTFPs), hunt bushmeat, and perform swidden farming, but have only partial or no legal ownership of the forest lands.
Indonesia has experienced one of the highest rates of forest loss globally, driven largely by mining, subsistence agriculture, logging, and commodity expansion (Carlson et al. Citation2012; Hansen et al. Citation2013). Kalimantan is one of the most deforested areas in the country having lost one-third of its natural forests because of extractive industries for timber, oil and minerals. Almost all forested regions in Kalimantan outside of the protected areas are currently under some form of concession for planned oil palm or rubber plantations, or for mineral exploration and extraction. A major shift in agricultural practices occurred in Indonesia, transitioning from swidden farming to large-scale agribusiness operations in the form of oil palm estates. This was driven by state policies for transmigration, provision of land title and infrastructure development and led to additional forest clearing in the region. Over the past two decades, this pattern of agrarian change, i.e. the transition from swidden farming to smallholder and commercial palm oil became common in the Kapuas Hulu region. Forest cover has declined across the region 1990–2010 from a low of 0.2% per annum in remote areas up to 1.3% per annum in more intensified areas (unpublished landsat data). The transition is characterized as moving from forest-based livelihoods consisting of swidden farming, fishing and bushmeat hunting and use of NTFPs to use of agroforests (rubber production mixed with vegetables and nuts) and reduced access to natural forest to labouring commercial monocultures (palm oil plantations) that are either smallholder-owned or run by larger corporations (Yuliani et al. Citation2020).
2.2. Data collection and analytical approach
2.2.1. Selection of study sites
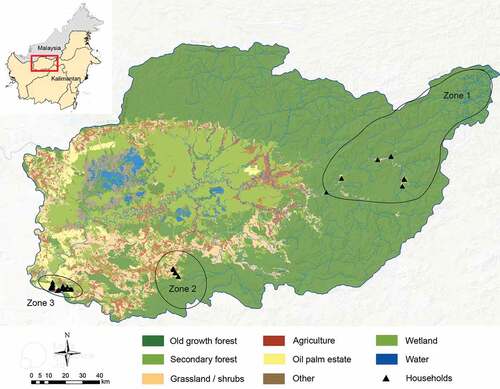
We identified the three zones (zone 1 – forest subsistence/zone, zone 2 – agroforestry mosaic/zone and zone 3 – monoculture and market-dependence/zone) by applying a set of criteria related to biophysical (forest cover, land use) and socio-economic conditions (market access, reliance on forests, agriculture commodities) and expert advice from researchers, NGOs, local institutions and key informant interviews (Deakin et al. Citation2016; Leonald and Rowland Citation2016; Sunderland et al. Citation2017). The three zones represent a gradient of agrarian change with each zone along the gradient represented by starkly different configurations of forest and agriculture land use (Deakin et al. Citation2016, ). Zone 1 consists of primarily natural forest and IPLCs rely on subsistence agriculture (mainly swidden farming), NTFP-based provisioning ES and fishing which are aided by transport across an extensive and largely intact river network. Zone 2 comprises agroforestry land use, where IPLCs rely on subsistence farming and occassional gathering of NTFPs, but are increasingly transitioning to rubber agroforestry as access to markets increases. In the monoculture and market-dependence zone (zone 3) local communities are engaged in rubber agroforestry or palm oil production and have limited access to intact forests to gather NTFP and other traditional ES ().
Figure 1. Study area shows three zones (zone 1: forest subsistence, zone 2: agroforestry mosaic, and zone 3: monoculture and market-dependence zone) of agricultural intensification gradient in the Kapuas Hulu of West Kalimantan region in Indonesia.
2.3. Participatory mapping process
We randomly selected two villages (out of four), which represented the dominant characteristics of the intensification gradients per zone (see Leonald and Rowland Citation2016). In each village, we conducted one participatory mapping workshop (thus, two workshops per zone) representing a total of six workshops in the three zones from 2016 to 2017. Each workshop comprised four sub-groups, containing 3–5 participants in each sub-group depending on participant availability. One facilitator was assigned for each sub-group to coordinate the participants throughout the mapping process. The number of participants per sub-group did not affect the number of ES chosen by subgroup nor the number of ES mapped. Participants were selected within constraints of local socio-cultural obligations, which required first asking the village elder, who is knowledgeable about the landscapes, involved in forest management or highly engaged in agriculture, and then inviting further participants through snowball sampling. Due to daytime work engagements and busy farming activities of the IPLC, we arranged workshops in each village during the evening or on Sunday in Christian villages. Researchers from the Centre for International Forestry Research Organization (CIFOR) facilitated each workshop by introducing the participants to the purpose of the workshop, the mapping approach and guiding time management during each session. Given the workshop time constraints, data on participants age, socio-economic status, or occupation were not collected. Generally, participants were men with interest and expertise in aspects of land management.
Each workshop began with a focus group to present a pre-defined list of ES, followed by open discussion, and an ES mapping exercise. To ensure that the mapped ES were consistent and comparable across the three zones and to the broader ES literature, we adopted a pre-defined list of potentially relevant ES based on important local values identified during the scoping phase of this study (described in detail in Leonald and Rowland Citation2016). The list of individual ES were categorized under the provisioning, cultural and regulating ES categories following the Millennium Ecosystem Assessment (MA, Citation2005). We assumed no prior knowledge of ES concepts among participants (a western scientific construct) and so sought to bridge the ES concept into their local worldviews by presenting the list of 25 ES alongside photographs and locally relevant examples for the participants to choose from (see Appendix 1, Leonald and Rowland Citation2016). For example, the cultural ES of ‘landscape aesthetics’ was presented as ‘enjoyment of natural beauty’ and shown as a photograph of a stream passing through an intact forest. Workshop subgroups then deliberated and chose the six ES uses that were most important to their wellbeing in the surrounding landscape and the six ES most desired in a future landscape. Here we define ‘ES use’ as the realization of ES at identifiable locations within a landscape, that is based on the biophysical supply and available access (Burkhard et al. Citation2014). ‘ES desire’ denotes where participants expressed a preference towards certain ES in a future landscape (which may or may not be the same as current ES uses).
Participants were then asked to spatially map the locations for the three most important ES uses and three most desired ES by placing buttons anywhere on a 1:50,000 scale paper map (as many points as desired) that showed topography (shaded ridges and river waterways) and their village locations. The maps used by the participants did not indicate land cover or land use, so as to not to bias their mapping. The mapping exercise was done using ES at a time and repeated based on each ES provision that was desired. Maps were photographed, then later digitized as point shapefiles in ArcGIS.
2.3.1. Land cover maps and ES assessment
We related the mapped ES points with land cover maps to assess how different land cover types influence the spatial distribution of ES currently used and desired by IPLC. The land cover maps were obtained for the year 2015 from the COLUPSIA project (CIFOR, Citation2013). The land cover classification was a simplified version of the COLUPSIA 1:50,000 scale vegetation map that combined computerized (ground truth data and supervised classification) and manual interpretation from Landsat satellite imagery at a spatial resolution of 30 m. The land cover maps were simplified into broad categories to represent landscape units typical of varying stages of forest transition and for which different ES uses were likely (). The final maps included the following land cover types: old growth forest, secondary forest, shrubs and low fallow regrowth, food crops field, small holder rubber plantations and oil palm estate.
Table 1. Combination of landscape units applied in mapping of ES in Kapuas Hulu district of West Kalimantan, Indonesia.
The land cover maps were delineated within each zone boundary and a dominant land cover class was assigned to each of the spatial ES mapped across the region using ArcMap 10.6 (ESRI Citation2016). To compare the types and amounts of ES currently used or desired by local peoples in each land cover type, we calculated the proportion of ES points mapped for each land cover class across the three zones.
2.3.2. Kernel density analysis
To map areas with variation in the density of ES use and desires, we carried out kernel density analysis (Silverman Citation1986), a procedure that identifies hotspot areas where ES were particularly used or desired in the three zones. This widely used interpolation method uses point data to visually map intensities and spatial patterns of ES (Alessa et al. Citation2008; Brown and Fagerholm Citation2015). The approach calculates the density of ES in raster form by placing a circle with a given circumference (search radius) around each point and then calculating the number of overlapping search radii intersected at each raster cell (Brown and Fagerholm Citation2015). We set the kernel density search radius and output cell size to match the resolution of the survey maps for each of the three zones. Accordingly, a map resolution of 1:400,000 corresponded with a cell size of 400 m. We then overlaid the individual ES maps to produce a final map showing the degree of multifunctionality of ES. Hotspots are defined as areas with a high number of overlapping ES uses and desires points on the map. The final maps represent hotspots of overlapping ES, where multiple individual ES are reportedly used and desired by IPLC.
3. Results
The distribution of mapped ES points and land cover types across the three zones are presented in . The total size of the forest subsistence zone (zone 1) is 299,221 ha with a land cover composed predominately of old growth forest (). In the agroforestry mosaic zone (zone 2), the total landscape area is 51338 ha, with the major land cover classes comprising old growth forest cover, shrubs and low fallow regrowth and secondary forest. The monoculture and market zone (zone 3) experienced the greatest agricultural intensification and had a total area of 14668 ha. The landscape in this zone is divided into a number of common classes, including oil palm estate, secondary forest cover, old growth forest and smallholder rubber plantations (). Among all the land cover types, old growth forest accounts for the largest proportion across zones 1 and 2, while secondary forest predominates zone 3.
Figure 2. Distribution of used ecosystem service points mapped within land covers of (a) forest subsistence; (b) agroforestry mosaic; and (c) monoculture and market dependence zone. The geographic location of the three zones is displayed in .
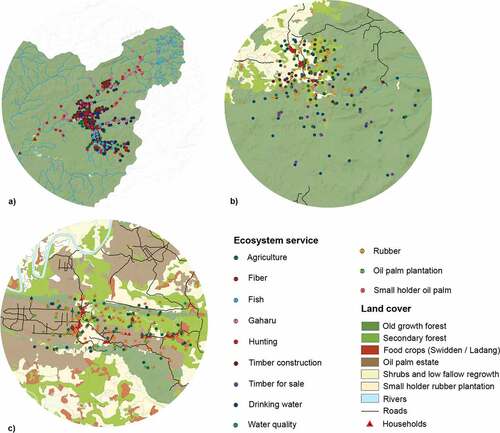
Table 2. Proportion (%) of land cover types within three zones (forest subsistence, agroforestry mosaic, and monoculture and market dependence zones).
3.1. Perceived ES use and desire across a gradient of agricultural intensification
In the forest subsistence zone, IPLCs mapped nearly all of their provisioning ES use and desire as occurring within the old growth forest, followed by shrubs, secondary forest and low fallow regrowth land (, ). Old growth forest account for 98% of the land cover in the subsistence zone. Timber construction, Gaharu (or agarwood Aquilaria spp.) a rare resource, but highly valued for its resin), hunting, agriculture and drinking water account the largest proportion of ES use sourced from old growth forest in this zone. Fish, fibre, drinking water and agriculture although limited in ES use, also occurred in shrubs and low fallow regrowth and secondary forests. Gaharu and drinking water are the most mapped desired ES from this old growth land cover. In total, the most frequently mapped ES uses were the provisioning ES of agriculture with 123 mapped points, timber construction (113), and drinking water (99) (). The most frequently mapped ES desire were agriculture (83) and fish (67). Interestingly, although no cultural ES uses were mapped in the subsistence zone, local people expressed a desire to increase these ES, including cultural and spiritual NTFPs (24), local environments conducive to passing on traditional moral values to youth (19) and ecotourism (18).
Figure 3. Percent of currently used and desired ecosystem services mapped by land cover for the forest subsistence (zone 1), agroforestry mosaic (zone 2) and monoculture and market dependence zone (zone 3) in Kapuas Hulu, West Kalimantan.
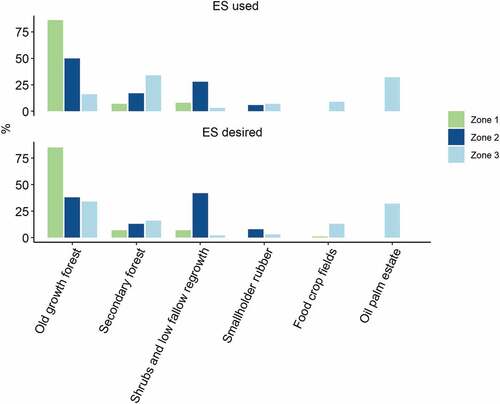
Table 3. Total numbers of mapped ES uses and ES desires locations and their proportional frequency in each land cover types in the forest subsistence zone.
The local community in the agroforestry mosaic zone mapped ES uses and desires over a broader range of land cover types compared to the subsistence zone (). The largest proportion of ES uses was concentrated in old growth forest (namely drinking water (61), timber for sale (68), rubber (45) and timber construction (43)). Similarly, the highest concentration of ES desires were located in the old growth forest followed by the shrub and low fallow regrowth land cover. These included ES desires for rubber, harvesting wild fruits and vegetables, fish and agricultural needs and to increase ecotourism in these areas. ES desires were also located in secondary forests, including Gaharu, harvesting wild fruits and vegetables and ecotourism. Among all ES, drinking water received the greatest number of mapped points for both ES use (61) and desire (65) (). Provisioning ES such as agriculture (51) and rubber plantations (55) also received a high number of mapped ES use points. No provisioning NTFP (i.e. Gaharu, harvest of wild fruits and vegetables and fish) were mapped for ES use, but there was an expressed desire for these ES by the respondents in this agroforestry mosaic zone.
Table 4. Total numbers of mapped ES used and desired and their proportional frequency by land cover types in the agroforestry mosaic zone.
In the monoculture and market dependence zone, IPLC considered almost all land covers to meet their use and desires for ES. The highest percentage of ES use were mapped in the secondary forest and oil palm estate as shown in and . These include provisioning ES such as smallholder oil palm (13), planted oil palm (20) and rubber (85). Secondary forest shares slightly more categories of ES use, with a quarter to half of them mapped in this land cover. An exception is that more than half (54%) of the drinking water use coincided within the few areas of remaining old growth forest land covers. Desired ES appeared predominately in the old growth forest and oil palm estate. Overall, rubber (85) use received the most mapped ES use points followed by agriculture (45). Timber construction (21), smallholder oil palm (25) and harvesting of wild fruits and vegetables (7) were the main desired ES that were mapped in the monoculture and market dependence zone.
Table 5. Total numbers of mapped ES used and desired and their proportional frequency by land cover type in the monoculture and market dependence zone.
3.2. Spatial distribution of high priority areas of ES across a gradient of agricultural intensification
The kernel density analysis revealed both clustered and dispersed distributions of multiple ES across the landscape (). In general, hotspots of desired ES were smaller than those of ES use. In the forest subsistence and agroforestry mosaic zones, ES were clustered relative to the large size of the land area used by IPLC. ES were concentrated mainly close to village locations indicating hotspot areas where multiple ES are currently used or desired by IPLC (). In comparison, ES were relatively more dispersed across the diverse landscape types used by local communities in market dependence zone 3. The locations of ES use hotspots in the forest subsistence zone 1 were located within the old growth forest in proximity to rivers and households. In contrast, more remote areas often had one or no mapped ES. Desired ES in the forest subsistence zone were slightly more dispersed within the old growth forest near rivers and households compared to ES use. A maximum of seven overlapping ES uses occurred, including agriculture, fish, Gaharu, hunting, timber construction, drinking water and fiber. For desired ES, a maximum of eight were found in the highest concentration areas and included provisioning ES such as agriculture, fish, fiber, drinking water, timber construction and Gaharu as well as cultural ES such as locations conducive to the generation of moral value in youth and NTFPs with cultural/spiritual importance.
Figure 4. Hotspots in local people’s ES use and desires detected from participatory mapped data. (a) ES use and (b) ES desire in the forest subsistence zone; (c) ES use and (d) ES desire in the agroforestry mosaic zone; and (e) ES use and (f) ES desire in the monoculture and market dependence zone. The colour codes represent the number of overlapping ES in each zone. Hotspots contain a high density of ES points and are depicted in red. Village locations are shown as black triangles, rivers as blue lines and roads as black lines. A geographic reference of the three zones is provided in .
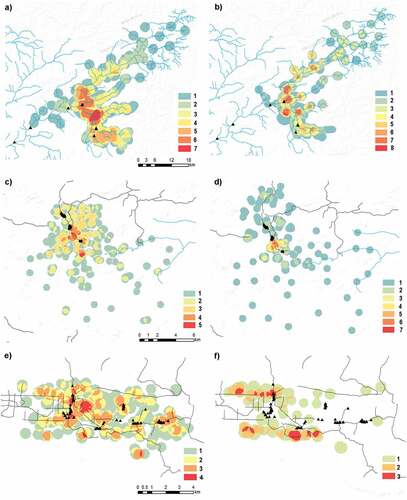
In the agroforestry mosaic zone, ES occurred in lower densities than in the forest subsistence zone with a maximum of five overlapping ES, which were mainly distributed in proximity to roads and households. ES hotspots were mainly mapped within the shrub and low fallow regrowth with some also occurring in old growth and secondary forest. Desired ES were more clustered over a smaller area in zone 2, primarily within shrub and low fallow regrowth zone. The ES uses co-occurring in high-density areas included agriculture, timber construction, timber for sale, drinking water and rubber. A maximum of seven overlapping ES desires occurred, including agriculture, fish, water, harvesting of wild fruit and vegetables, Gaharu, rubber and ecotourism.
ES use was relatively more dispersed in the monoculture and market dependence zone compared to the other zones, although hotspots were still in proximity to village locations (). These high-density ES locations occurred in a number of different land cover types, including old growth and secondary forest, smallholder rubber plantations and food crops fields (, ). In comparison, desired ES were more dispersed with fewer hotspots compared to ES use. In contrast to the forest subsistence and agroforestry zones, desired ES were concentrated away from the village centers in the old growth, secondary forest and oil palm estates. A lower variation of ES were mapped in the market dependence zone, consisting of four provisioning ES, including agriculture, smallholder oil palm, oil palm plantations and rubber (). A maximum of three overlapping desired ES were identified in this market dependence zone, including smallholder oil palm, timber construction and harvesting of wild fruits and vegetables.
4. Discussion
Using participatory mapping with IPLC in West Kalimantan, Indonesia, our results showed a shift of their ES use and desire along a gradient of agricultural intensification. We found the highest frequency of ES use and desire mapped by IPLC in the forest subsistence zone in proximity to the forest, and a smaller selection in the more agriculturally modified landscape. This comparison of ES use and desire provides an understanding of how IPLC’s aspiration and satisfaction change with ES access across different land covers along an intensification gradient. Our study exemplifies an improved understanding of ES desire of specific land covers in multifunctional landscapes and contributes to spatial planning that considers human livelihood and well-being (Cowling et al. Citation2008; Bryan et al. Citation2010; Reyers et al. Citation2013).
4.1. Shifting use and desire under agrarian change
Our study revealed a change of IPLC’s use and desire for food, water and other NTFP-related ES across the three zones. In terms of food, we found that a transition occurred from a reliance on the forest for food and nutrition in the forest subsistence zone (zone 1) to an increased reliance on food production in the most agriculturally intensive zones (agroforestry mosaic/zone 2 and monoculture and market dependence/zone 3). Food was a highly desired ES in both the subsistence and agroforestry zone, originating from varying land covers. Accordingly, IPLCs acquired their provisioning food sources predominantly within the old growth forest, shrub and low fallow regrowth land and secondary forest in the forest subsistence and agroforestry zones. Such fallow lands have been reported as a valuable food source for nutrition in local diets (Ickowitz et al. Citation2019). Agricultural intensification has led to a loss of fallows in other regions and an associated reduction of ES such as wild fruit and vegetable as food sources (Broegaard et al. Citation2017). The economic benefits of agroforestry systems compared to swidden agriculture, as well as income and access to farm land can influence people’s choice of whether a food source comes from subsistence use or through agricultural production (Kalaba et al. Citation2013; Angelsen et al. Citation2014; Rahman et al. Citation2014; Ahammad et al. Citation2019). In the context of Indonesia, such shifts to monoculture agricultural systems can lead to a loss in dietary diversity of IPLC with a greater consumption of processed foods (Ickowitz et al. Citation2019). In our study, agrarian change with an intensive production is leading to a declining overall role of the forest as an important food source for local livelihoods, nutrition and overall well-being within particular social-ecological contexts of a landscape.
Meanwhile, as the overall importance of the forest for providing ES declines, we observed a possible increase in the relative importance of the forest. Old-growth forests were relatively more important in zone 3 than they were in zone 1. In zone 1, old-growth forest covered 98% of the land but only provide 79% (fiber) or 65% (fish) of the ES. In zone 1, the secondary forest shared only 1% of land cover, but provided 29% fish. By contrast, the secondary forest remained in only 2% of land cover in zone 2, where it contributed 18% of timber construction material, exceptionally higher than other zones. This is likely suggesting that land covers become marginally more important for ES as those land covers become more scarce. This would caution that the value of some land covers (e.g. old growth forests) may not be readily apparent when they are still abundant and it also underscores the importance of doing place-based assessments that consider the actual abundance of land covers within a landscape.
Drinking water was the next most frequently mapped ES use and desire across all zones, in particular within the agroforestry mosaic zone, and within the forested land covers. The desire for drinking water within the forested areas of all three zones reveals the importance of the old growth and secondary forests to sustain this key ES, particularly within the more agriculturally developed landscape. Our finding supports previous studies that identified water as the most valuable ES, with an appreciation of the forests’ contribution to healthy watersheds (Muhamad et al. Citation2014; Van Oort et al. Citation2015; Cuni-Sanchez et al. Citation2016; Grima et al. Citation2016). In this study, we demonstrate a clear desire of IPLC to have access to clean water in relative proximity to where they live. In the Kapuas Hulu Regency, a decline in water quality has been reported for downstream communities and those located near oil palm plantations (Anandi et al. Citation2020). Many communities explicitly identified drinking water as a core land use objective and have rejected proposals from oil palm corporations out of concern for their water in the past (Yuliani et al. Citation2018). Forest loss in highly intensive zones (monoculture and market zone) could cause a decline in water purification service (i.e. quality), leading to a greater vulnerability of these communities. There was a growing recognition of drinking water use and desire within the secondary forest of the monoculture zone, where the old growth forest had declined. Both in absolute terms and proportionally, drinking water seems to be a more important ES desire in the agroforestry systems than in the oil palm plantation. The high desire to increase this service (drinking water and water quality) indicates the need for old growth and secondary forest to be conserved for access to clean drinking water in the agriculturally modified landscapes.
NTFPs for provisioning use were mapped in the forest subsistence zone but were mostly absent in monoculture and agroforestry zones, indicating a move away from traditional forest uses toward a greater reliance on markets in the less forest-dependent communities. Our finding agrees with other studies that reported a reduced use of forest materials for subsistence and income in other parts of Borneo that had more developed infrastructure (Abram et al. Citation2014) and in the eastern upland Chittagong Hill Tracts region of Bangladesh (Ahammad et al. Citation2021). This reflects that IPLC living in forested landscapes are more dependent on forest products (Sunderlin et al. Citation2008) compared to communities living in agriculturally intensified areas, who may purchase their goods at markets. Nonetheless, in this study IPLC still clearly desired provisioning and cultural NTFPs in the agricultural frontier zones, expressing a desire for wild fruits and vegetables as well as Gaharu, an economically and culturally important resin derived from trees. So, the agrarian changes not only impacts the supply capacity of many NTFPs that has been available earlier but also the valuable knowledge and experiences held by IPLC in managing and conserving those resources on the landscape.
The desire to return to traditional forest products may indicate a preference for a wider range of livelihood and subsistence options as well as opportunities to restore traditional cultural identities (Tengberg et al. Citation2012). Our study did not observe any cultural ES use across all the zones at the time of the survey, but there was a high desire for these ES. Although we cannot explain this disparity observed for cultural ES, in zone 2 and zone 3, ecotourism is understood as an important future livelihood opportunity even if it not yet present. The limited response on the use of cultural ES can have several explanations. One is related to gender-biased participants, who focused more on provisioning services (this has already been reported in the literature for males: see Martín-López et al. Citation2012) and ES with economic value. There might also have been a not fully clear understanding of what cultural ES are in Zone 1. In general, the ongoing agrarian transformation may be seen as a brief sacrifice, and although participants in zone 3 may have lost access to culturally important NTFP during land cover change, it appears the participants are hopeful it may recover in the future. The desire for cultural/spiritual NTFPs and tourism ES was observed across diverse land covers (old growth forest, shrubs and low fallow regrowth, secondary forest and oil palm estate) and other studies have shown that spiritual and cultural values of the forest can be maintained despite the declines in forest interactions as landscape transitions occur (Plieninger et al. Citation2013; Abram et al. Citation2014). The results from this study demonstrate that despite continued desires for traditional NTFP’s, opportunities are becoming limited in heavily transformed oil palm landscapes. This transition of cultural ES desire suggests a potential opportunity for considering conservation values of local communities in protecting secondary forests or restoration of shrub lands in agriculturally intensified zones.
The observed shifts in ES uses and desires reveal that there may be a range of transitional processes occurring where some ES are being slowly traded out for different ES as the gradient of agrarian change intensifies. Understanding ES losses and gains reflected in terms of use and desire remains challenging as the underlying processes do not happen at a single point in time and associated changes in ES use and desires do not necessarily preclude improved livelihood or conservation outcomes. Nonetheless, the observed shift in peoples’ ES uses and desires across the gradient of agricultural intensification, gives insights of how the people are responding and coping with landscape change.
4.2. ES hotspot mapping
The ES hotspot maps produced from ILK revealed a decline in ES diversity across the three zones as the landscape transitioned away from old growth forest to a more modified landscape (). The highly intensified market zone was dominated by ES such as rubber or oil palm, exemplifying an agricultural transition where the use of multiple ES gradually shifts to the reliance on a smaller range of ES in this modified landscape. A decline in ES multifunctionality with agricultural intensification has been reported in other studies that focused mainly on biophysical ES such as a biodiversity, water and soil formation processes (Loos et al. Citation2014; Allan et al. Citation2015; Rasmussen et al. Citation2018) without considering how these changes align with the spatial pattern of local communities’ desires (Reed et al. Citation2016).
Spatial mapping of areas with high ES densities provides an opportunity to incorporate the land use desires of IPLC into landscape management plans, considering their cultural and livelihood values and thus accounting for multifunctionality of the landscape (Reyers et al. Citation2013; Ramirez-Gomez et al. Citation2016; Molin et al. Citation2018; Reed et al. Citation2020). The hotspot maps of socially valued ES from this study highlight areas that are most frequently used or desired by people in the surveyed villages. The location of identified hotspot areas near households and rivers in the forest subsistence zone, and accessible by roads in the agricultural zones, reflects the importance of access to determine ES use patterns. Areas with higher ES densities have also been described near riverine systems among indigenous groups in Suriname (Ramirez-Gomez et al. Citation2016). The findings from our study confirm that the spatial patterns of ES use are influenced by landscape configuration and that ES assessments benefit from combining knowledge on social values and access with biophysical data to promote human well-being by landscape management (Labrière et al. Citation2016; Tomscha and Gergel Citation2016; Pingarroni et al. Citation2022).
5. Conclusions and implications for management
This study leveraged participatory mapping as a means to incorporate the knowledge and aspirations of IPLC in explaining the patterns of ES use and desires across forest-agriculture gradients in Kapuas Hulu, Indonesia. Our study showed that agricultural intensification caused a decline in the availability and distribution of specific ES uses and desires of IPLC. Both ES used and desired decreased in both absolute and proportional terms with increasing agrarian change. Thus, the multifunctionality of the landscape decreased as it transitioned from forest subsistence use to market-oriented commodities. This finding confirms the importance of employing a place-based approach and community-involved measures of ES uses and desires for enhancing well-being of IPLC in multifunctional landscapes (Fagerholm et al. Citation2020).
By identifying hotspots of ES use and desires across a gradient of agriculture intensification, our ES mapping approach has the potential to greatly improve the quality of spatial planning that can benefit local communities, economic development and conservation objectives (Sumarga and Hein Citation2014). Integrating participatory ES mapping, as piloted here, could have additional benefits by providing IPLC a voice in decision-making directly, unmediated by governmental officials and other stakeholders with their own objectives and aims. Historically state land use mapping in the region has partly considered the claims of IPLC to permanent agriculture including, shifting cultivation. In contrast, state land use mapping allocates reserves with convertible forestland to the corporations for tree cropping (e.g. oil palm, rubber or pulp species). This plan only fits the state agency’s purpose of controlling the land boundary without recognising the villagers’ demand (including IPLC) for timber and non-timber provisioning ES in the old-growth forest and shifting (swidden) cultivation (Peluso, Citation1995). Recently, the counter-mapping (including participatory mapping approaches) developed by non-government organisations with the participation of local communities’ oral histories and knowledge has emphasized how a customary resource use plan contributes to better social and ecological outcomes as long as government recognises the plan adequately. By applying a participatory approach, our study demonstrates that diverse set of ES values attached by IPLC to their protected forests regardless of their claims on lands adequately recognised within the state mapping. So, a successful participatory mapping may overcome this void with the state’s recognition of the traditional, flexible and value-based resource use system allowing the space for negotiation and acceptance by IPLC.
The main methodological novelty of our work consisted in the comparison of the ES use and desire along a gradient of agricultural intensification. In contrast with previous participatory mapping studies, which focused mainly on the supply side or supply–demand (Palomo et al. Citation2014, Garcia-Nieto et al. Citation2015), we provided an assessment of the level of satisfaction of IPLC in terms of their perceptions of existing ES use and desire to maintain livelihoods and well-being under the circumstance of the changed resource allocation and exploitation around them. As we have shown in this work, the application of this approach provides key information on the level to which stakeholders´ ES preferences are met in different landscape configurations in the context of agrarian change. The participatory ES mapping provides a deeper social-ecological understanding of land currently used by local communities regardless of land classification on government maps. Decision-makers should consider this information when planning landscapes on both sides of the forest frontier, particularly the roles and value of forest reserves and other intensive land use held by IPLC.
This approach is particularly important in data-scarce, rural environments where IPLC still depend on ES from the forest (Abram et al. Citation2014) and where they are often marginalized in terms of land and resource use planning processes that can have direct impacts on their livelihoods and well-being (Gilmore and Young Citation2012; Mitchell et al. Citation2015; Van Oort et al. Citation2015). Improvements in the study can be made by involving a wide range of stakeholders or participant selection based on demographics (gender, age), social and economic contexts during the mapping process. Future research should consider a multi-level stakeholder involvement to assess the diverse perspectives of ES uses and desires from a landscape and identify the necessary land planning processes to achieve specific ES.
Landscape scale planning in Indonesia is a complex process that involves multiple stakeholders and multiple levels of governance (Brockhaus et al. Citation2012; Sayer et al. Citation2013; Law et al. Citation2015; Sahide and Giessen Citation2015). In theory, decision-making processes required for the conversion of forests to oil palm should include IPLC’ consultation and consent. However, in reality elite capture, and systems of incentives and coercions result in little to no local consultation over land use planning arrangements (Ardiansyah et al. Citation2015; Prabowo et al. Citation2017; Hasudungan and Neilson Citation2020; Yuliani et al. Citation2020). Therefore, our study shows that the use of land cover alone excludes information about local perceptions of ES uses and desires, which can lead to disagreements with existing land management strategies under agrarian change. Instead, by incorporating IPLC’s desires for their landscapes within the participatory mapping process, our study demonstrates that important insights can be gained over IPLC’s visions for development and their concerns over perceived current land use trajectories.
Appendix
Download PDF (198.2 KB)Acknowledgments
We are grateful to the reviewers for providing constructive comments on the earlier draft of the manuscript.
The authors thank the villagers and other national stakeholders who participated in our study.
Disclosure statement
No potential conflict of interest was reported by the authors.
Supplemental data
Supplemental data for this article can be accessed online at https://doi.org/10.1080/26395916.2023.2174685
Additional information
Funding
References
- Abram NK, Meijaard E, Ancrenaz M, Runting RK, Wells JA, Gaveau D, Pellier A-S, Mengersen K. 2014. Spatially explicit perceptions of ecosystem services and land cover change in forested regions of Borneo. Ecosyst Serv. 7:116–16. doi:10.1016/j.ecoser.2013.11.004.
- Ahammad R, Stacey N, Sunderland TC. 2019. Use and perceived importance of forest ecosystem services in rural livelihoods of Chittagong Hill Tracts, Bangladesh. Ecosyst Serv. 35:87–98. doi:10.1016/j.ecoser.2018.11.009.
- Ahammad R, Stacey N, Sunderland T. 2021. Assessing land use changes and livelihood outcomes of rural people in the Chittagong Hill Tracts region, Bangladesh. Land Degrad Dev. 32(13):3626–3638. doi:10.1002/ldr.3795.
- Ahammad R, Stacey N, Sunderland TCH. 2021. Determinants of forest and tree uses across households of different sites and ethnicities in Bangladesh. Sustainability. 17(1):232–242. doi:10.1080/15487733.2021.1930731.
- Ahammad R, Stacey N, Sunderland T, Sangha K. 2022. Land use preference for ecosystem services and well-being in Chittagong Hill Tracts of Bangladesh. Forests. 13(12):2086. doi:10.3390/f13122086.
- Albizua A, Pascual U, Corbera E. 2019. Large scale irrigation impacts socio-cultural values of agroecosystems: an example from Navarre. Ecol Econ. 159:354–361. doi:10.1016/j.ecolecon.2018.12.017.
- Alessa LN, Kliskey AA, Brown G. 2008. Social-ecological hotspots mapping: a spatial approach for identifying coupled social-ecological space. Landsc Urban Plan. 85(1):27–39. doi:10.1016/j.landurbplan.2007.09.007.
- Allan E, Manning P, Alt F, Binkenstein J, Blaser S, Blüthgen N, Böhm S, Grassein F, Hölzel N, Klaus VH, Fischer M, et al. 2015. Land use intensification alters ecosystem multifunctionality via loss of biodiversity and changes to functional composition. Ecol Lett. 18(8):834–843. doi:10.1111/ele.12469.
- Anandi AM, Yuliani EL, Moeliono M, Laumonier Y, Narulita S. 2020. Kapuas Hulu: a background analysis to implementing integrated landscape approaches in Indonesia. In: Reed J, Ros-Tonen M Sunderland TCH, editors. Operationalizing integrated landscape approaches in the tropics. Bogor, Indonesia: Center for International Forestry Research (CIFOR); pp. 176–204.
- Andrew ME, Wulder MA, Nelson TA. 2014. Potential contributions of remote sensing to ecosystem service assessments. Prog Phys Geogr. 38:328–353. doi:10.1177/0309133314528942.
- Angelsen A, Jagger P, Babigumira R, Belcher B, Hogarth NJ, Bauch S, Börner J, Smith-Hall C, Wunder S. 2014. Environmental income and rural livelihoods: a global-comparative analysis. World Dev. 64:S12–28. doi:10.1016/j.worlddev.2014.03.006.
- Angelstam P, Elbakidze M, Lawrence A, Manton M, Melecis V, Pereira A. 2018. Barriers and bridges for landscape stewardship and knowledge production to sustain functional green infrastructures. In: Pereira A, Peterson U, Pastur G, Iverson L Plieninger T, editors. Sustaining ecosystem services in forest landscapes. Dordrecht: Springer; pp. 127–167.
- Ardiansyah F, Marthen AA, Amalia N. 2015. Forest and land-use governance in a decentralized Indonesia: a legal and policy review. Indonesia: CIFOR.
- Bennett EM. 2017. Changing the agriculture and environment conversation. Nat Ecol Evol. 1(1):1–2. doi:10.1038/s41559-016-0018.
- Bennett EM, Peterson GD, Gordon LJ. 2009. Understanding relationships among multiple ecosystem services. Ecol Lett. 12:1394–1404. doi:10.1111/j.1461-0248.2009.01387.x.
- Berbés-Blázquez M, González JA, Pascual U. 2016. Towards an ecosystem services approach that addresses social power relations. Curr Opin Environ Sustainability. 19:134–143. doi:10.1016/j.cosust.2016.02.003.
- Boedhihartono AK, Endamana D, Ruiz-Perez M, Sayer J. 2015. Landscape scenarios visualized by Baka and Aka Pygmies in the Congo Basin. Int J Sustainable Dev World Ecol. 22:279–291. doi:10.1080/13504509.2015.1039094.
- Brockhaus M, Obidzinski K, Dermawan A, Laumonier Y, Luttrell C. 2012. An overview of forest and land allocation policies in Indonesia: is the current framework sufficient to meet the needs of REDD+? For Policy Econ. 18:30–37. doi:10.1016/j.forpol.2011.09.004.
- Broegaard RB, Rasmussen LV, Dawson N, Mertz O, Vongvisouk T, Grogan K. 2017. Wild food collection and nutrition under commercial agriculture expansion in agriculture-forest landscapes. For Policy Econ. 84:92–101. doi:10.1016/j.forpol.2016.12.012.
- Brown G, Fagerholm N. 2015. Empirical PPGIS/PGIS mapping of ecosystem services: a review and evaluation. Ecosyst Serv. 13:119–133. doi:10.1016/j.ecoser.2014.10.007.
- Brown GG, Reed P. 2012. Social landscape metrics: measures for understanding place values from public participation geographic information systems (PPGIS). Landscape Res. 37:73–90. doi:10.1080/01426397.2011.591487.
- Bryan BA, Raymond CM, Crossman ND, Macdonald DH. 2010. Targeting the management of ecosystem services based on social values: where, what, and how? Landsc Urban Plan. 97(2):111–122. doi:10.1016/j.landurbplan.2010.05.002.
- Burkhard B, Kandziora M, Hou Y, Müller F. 2014. Ecosystem service potentials, flows and demands-concepts for spatial localisation, indication and quantification. Landscape Online. 34:1–32. doi:10.3097/LO.201434.
- Carlson KM, Curran LM, Ratnasari D, Pittman AM, Soares-Filho BS, Asner GP, Trigg SN, Gaveau DA, Lawrence D, Rodrigues HO. 2012. Committed carbon emissions, deforestation, and community land conversion from oil palm plantation expansion in West Kalimantan, Indonesia. Proc Natl Acad Sci. 109:7559–7564. doi:10.1073/pnas.1200452109.
- Chakib A. 2014. Civil society organizations’ roles in land-use planning and community land rights issues in Kapuas Hulu regency, West Kalimantan, Indonesia. Bogor, Indonesia: Center for International Forestry Research (CIFOR). doi:10.17528/cifor/005426.
- Chan KM, Satterfield T. 2020. The maturation of ecosystem services: social and policy research expands, but whither biophysically informed valuation? People Nat. 2(4):1021–1060. doi:10.1002/pan3.10137.
- CIFOR. 2013. Collaborative land use planning and sustainable institutional arrangements for strengthening land tenure, forest and community rights in Indonesia. COLUPSIA Project. CIFOR.
- Colchester M, Chai S. 2011. Oil palm expansion in South East Asia: trends and implications for local communities and indigenous peoples. England and Indonesia: Forest Peoples Programme.
- Coomes O, Takasaki Y, Rhemtulla J. 2011. Land-use poverty traps identified in shifting cultivation systems shape long-term tropical forest cover. Proc Natl Acad Sci. 108:13925–13930. doi:10.1073/pnas.1012973108.
- Cowling RM, Egoh B, Knight AT, O’Farrell PJ, Reyers B, Rouget M, Roux DJ, Welz A, Wilhelm-Rechman A. 2008. An operational model for mainstreaming ecosystem services for implementation. Proc Natl Acad Sci. 105(28):9483–9488. doi:10.1073/pnas.0706559105.
- Cramb R, McCarthy JF. 2016. The oil palm complex: smallholders, agribusiness and the state in Indonesia and Malaysia. Singapore: NUS Press.
- Cuni-Sanchez A, Pfeifer M, Marchant R, Burgess ND. 2016. Ethnic and locational differences in ecosystem service values: insights from the communities in forest islands in the desert. Ecosyst Serv. 19:42–50. doi:10.1016/j.ecoser.2016.04.004.
- D’amato D, Rekola M, Wan M, Cai D, Toppinen A. 2017. Effects of industrial plantations on ecosystem services and livelihoods: perspectives of rural communities in China. Land Use Policy. 63:266–278. doi:10.1016/j.landusepol.2017.01.044.
- Deakin L, Kshatriya M, Sunderland T. 2016. Agrarian change in tropical landscapes. Indonesia: CIFOR.
- De Groot RS, Alkemade R, Braat L, Hein L, Willemen L. 2010. Challenges in integrating the concept of ecosystem services and values in landscape planning, management and decision making. Ecol Complexity. 7:260–272. doi:10.1016/j.ecocom.2009.10.006.
- Díaz S, Pascual U, Stenseke M, Martín-López B, Watson RT, Molnár Z, Hill R, Chan KMA, Baste IA, Brauman KA, et al. 2018. Assessing nature’s contributions to people. Science. 359(6373):270–272. doi:10.1126/science.aap8826.
- Dressler WH, Wilson D, Clendenning J, Cramb R, Keenan R, Mahanty S, Bruun TB, Mertz O, Lasco RD. 2017. The impact of swidden decline on livelihoods and ecosystem services in Southeast Asia: a review of the evidence from 1990 to 2015. Ambio. 46(3):291–310. doi:10.1007/s13280-016-0836-z.
- Edwards R. 2015. Is plantation agriculture good for the poor? Evidence from Indonesia’s palm oil expansion. Departmental Working Papers 2015-12, The Australian National University, Arndt-Corden Department of Economics.
- Eigenbrod F, Armsworth PR, Anderson BJ, Heinemeyer A, Gillings S, Roy DB, Gaston KJ, Gaston KJ. 2010. The impact of proxy‐based methods on mapping the distribution of ecosystem services. J Appl Ecol. 47(2):377–385. doi:10.1111/j.1365-2664.2010.01777.x.
- ESRI ArcGIS Desktop Version 10.6. 2016.
- Euler M, Krishna V, Schwarze S, Siregar H, Qaim M. 2017. Oil palm adoption, household welfare, and nutrition among smallholder farmers in Indonesia. World Dev. 93:219–235. doi:10.1016/j.worlddev.2016.12.019.
- Fagerholm N, Martín‐lópez B, Torralba M, Oteros‐rozas E, Lechner AM, Bieling C, Stahl Olafsson A, Albert C, Raymond CM, Garcia‐martin M, et al. 2020. Perceived contributions of multifunctional landscapes to human well‐being: evidence from 13 European sites. People Nat. 2(1):217–234. doi:10.1002/pan3.10067.
- Fantini A, Bauer E, De Valois C, Siddique I. 2017. The demise of swidden-fallow agriculture in an Atlantic Rainforest region: implications for farmers’ livelihood and conservation. Land Use Policy. 69:417–426. doi:10.1016/j.landusepol.2017.09.039.
- Feintrenie L, Chong WK, Levang P. 2010. Why do farmers prefer oil palm? Lessons learnt from Bungo district, Indonesia. Small-Scale For. 9:379–396. doi:10.1007/s11842-010-9122-2.
- Fish R, Church A, Winter M. 2016. Conceptualising cultural ecosystem services: a novel framework for research and critical engagement. Ecosyst Serv. 21:208–217. doi:10.1016/j.ecoser.2016.09.002.
- Freeman OE, Duguma LA, Minang PA. 2015. Operationalizing the integrated landscape approach in practice. Ecol Soc. 20. doi:10.5751/ES-07175-200124.
- García-Nieto AP, Quintas-Soriano C, García-Llorente M, Palomo I, Montes C, Martín-López B. 2015. Collaborative mapping of ecosystem services: the role of stakeholders׳ profiles. Ecosyst Serv. 13:141–152. doi:10.1016/j.ecoser.2014.11.006.
- Gilmore MP, Young JC. 2012. The use of participatory mapping in ethnobiological research, biocultural conservation, and community empowerment: a case study from the Peruvian Amazon. J Ethnobiol. 32(1):6–29. doi:10.2993/0278-0771-32.1.6.
- Grass I, Kubitza C, Krishna VV, Corre MD, Mußhoff O, Pütz P, Drescher J, Rembold K, Ariyanti ES, Barnes AD, et al. 2020. Trade-offs between multifunctionality and profit in tropical smallholder landscapes. Nat Commun. 11(1):1–13. doi:10.1038/s41467-020-15013-5.
- Grima N, Singh SJ, Smetschka B, Ringhofer L. 2016. Payment for ecosystem services (PES) in Latin America: analysing the performance of 40 case studies. Ecosyst Serv. 17:24–32. doi:10.1016/j.ecoser.2015.11.010.
- Hansen MC, Potapov PV, Moore R, Hancher M, Turubanova SA, Tyukavina A, Thau D, Stehman SV, Goetz SJ, Loveland TR, et al. 2013. High-resolution global maps of 21-st-century forest cover change. Science. 342:850–853. doi:10.1126/science.1244693.
- Hasudungan A, Neilson J. 2020. Processes of land appropriation for large-scale oil palm development in West Kalimantan, Indonesia. Revista Nera. 23(51):366–389. doi:10.47946/rnera.v0i51.6542.
- Howe C, Suich H, Vira B, Mace GM. 2014. Creating win-wins from trade-offs? Ecosystem services for human well-being: a meta-analysis of ecosystem service trade-offs and synergies in the real world. Global Environ Change. 28:263–275. doi:10.1016/j.gloenvcha.2014.07.005.
- Ickowitz A, Powell B, Rowland D, Jones A, Sunderland T. 2019. Agricultural intensification, dietary diversity, and markets in the global food security narrative. Global Food Secur. 20:9–16. doi:10.1016/j.gfs.2018.11.002.
- Kalaba F, Quinn C, Dougill A. 2013. Contribution of forest provisioning ecosystem services to rural livelihoods in the Miombo woodlands of Zambia. Popul Environ. 35:159–182. doi:10.1007/s11111-013-0189-5.
- Labrière N, Locatelli B, Vieilledent G, Kharisma S, Basuki I, Gond V, Laumonier Y. 2016. Spatial congruence between carbon and biodiversity across forest landscapes of northern Borneo. Global Ecol Conserv. 6:105–120. doi:10.1016/j.gecco.2016.01.005.
- Lambin EF, Geist HJ, Lepers E. 2003. Dynamics of land-use and land-cover change in tropical regions. Annu Rev Environ Resour. 28(1):205–241. doi:10.1146/annurev.energy.28.050302.105459.
- Laurance WF, Sayer J, Cassman KG. 2014. Agricultural expansion and its impacts on tropical nature. Trends Ecol Evol. 29:107–116. doi:10.1016/j.tree.2013.12.001.
- Law EA, Meijaard E, Bryan BA, Mallawaarachchi T, Koh LP, Wilson KA. 2015. Better land-use allocation outperforms land sparing and land sharing approaches to conservation in Central Kalimantan, Indonesia. Biol Conserv. 186:276–286. doi:10.1016/j.biocon.2015.03.004.
- Leonald L, Rowland D. 2016. Drivers and effects of agrarian change in Kapuas Hulu Regency, West Kalimantan, Indonesia. In: Deakin EL, Kshatriya M Sunderland TCH, editors. Agrarian change in tropical landscapes. Bogor, Indonesia: Center for International Forestry Research (CIFOR); pp. 91–138.
- Levang P, Riva WF, Orth MG. 2016. Oil palm plantations and conflict in Indonesia: evidence from West Kalimantan. The oil palm complex: Smallholders, agribusiness and the state in Indonesia and Malaysia, 283–300.
- Loos J, Abson DJ, Chappell MJ, Hanspach J, Mikulcak F, Tichit M, Fischer J. 2014. Putting meaning back into “sustainable intensification”. Front Ecol Environ. 12:356–361. doi:10.1890/130157.
- Martín-López B, Iniesta-Arandia I, García-Llorente M, Palomo I, Casado-Arzuaga I, Amo DGD, Gómez-Baggethun E, Oteros-Rozas E, Palacios-Agundez I, Willaarts B, et al. 2012. Uncovering ecosystem service bundles through social preferences. PLoS One. 7(6):e38970. doi:10.1371/journal.pone.0038970.
- Millennium Ecosystem Assessment. 2005. Ecosystems and human well-being 5. United States of America: Island press; p. 563.
- Mitchell MGE, Suarez-Castro AF, Martinez-Harms M, Maron M, McAlpine C, Gaston KJ, Johansen K, Rhodes JR. 2015. Reframing landscape fragmentation’s effects on ecosystem services. Trends Ecol Evol. 30:190–198. doi:10.1016/j.tree.2015.01.011.
- Molin PG, Chazdon R, Ferraz SFB, Brancalion PHS, Butt N. 2018. A landscape approach for cost effective large-scale forest restoration. J Appl Ecol. 55:2767–2778. doi:10.1111/1365-2664.13263.
- Muhamad D, Okubo S, Harashina K, Gunawan B, Takeuchi K, Takeuchi K. 2014. Living close to forests enhances people׳s perception of ecosystem services in a forest–agricultural landscape of West Java, Indonesia. Ecosyst Serv. 8:197–206. doi:10.1016/j.ecoser.2014.04.003.
- Orth M. 2007. Subsistence foods to export goods: the impact of an oil palm plantation on local food sovereignty North Barito, Central Kalimantan, Indonesia. Bogor: Sawit Watch.
- Orth MG, 2009. The noble savage fancies development. Determinants of community responses to forest conversion plans in Central Kalimantan, Indonesia [ dissertation]. Germany: Technical University Dresden.
- Palomo-Campesino S, Palomo I, Moreno J, González J. 2018. Characterising the rural-urban gradient through the participatory mapping of ecosystem services: insights for landscape planning. One Ecosyst. 3:e24487. doi:10.3897/oneeco.3.e24487.
- Palomo I, Martín-López B, Zorrilla-Miras P, Del Amo DG, Montes C. 2014. Deliberative mapping of ecosystem services within and around Doñana National Park (SW Spain) in relation to land use change. Reg Environ Change. 14(1):237–251. doi:10.1007/s10113-013-0488-5.
- Pascual U, Balvanera P, Díaz S, Pataki G, Roth E, Stenseke M, Watson RT, Dessane BE, Islar M, Kelemen E, et al. 2017. The value of nature’s contributions to people: the IPBES approach. Curr Opin Environ Sustainability. 26-27:7–16. doi:10.1016/j.cosust.2016.12.006.
- Peluso NL. 1995. Whose woods are these? Counter‐mapping forest territories in Kalimantan, Indonesia. Antipode. 27(4):383–406.
- Pingarroni A, Castro AJ, Gambi M, Bongers F, Kolb M, García-Frapolli E, Balvanera P. 2022. Uncovering spatial patterns of ecosystem services and biodiversity through local communities’ preferences and perceptions. Ecosyst Serv. 56:101436. doi:10.1016/j.ecoser.2022.101436.
- Pirard R, Petit H, Baral H. 2017. Local impacts of industrial tree plantations: an empirical analysis in Indonesia across plantation types. Land Use Policy. 60:242–253. doi:10.1016/j.landusepol.2016.10.038.
- Plieninger T, Dijks S, Oteros-Rozas E, Bieling C. 2013. Assessing, mapping, and quantifying cultural ecosystem services at community level. Land Use Policy. 33:118–129. doi:10.1016/j.landusepol.2012.12.013.
- Power AG. 2010. Ecosystem services and agriculture: tradeoffs and synergies. Philos Trans R Soc B Biol Sci. 365:2959–2971. doi:10.1098/rstb.2010.0143.
- Prabowo D, Maryudi A, Imron MA. 2017. Conversion of forests into oil palm plantations in West Kalimantan, Indonesia: insights from actors’ power and its dynamics. For Policy Econ. 78:32–39. http://www.sciencedirect.com/science/article/pii/S1389934117300072
- Rahman SA, Rahman MF, Sunderland T. 2014. Increasing tree cover in degrading landscapes: ‘Integration’ and ‘Intensification’ of smallholder forest culture in the Alutilla Valley, Matiranga, Bangladesh. Small-Scale For. 13:237–249. doi:10.1007/s11842-013-9251-5.
- Ramirez-Gomez SOI, Brown G, Verweij PA, Boot R. 2016. Participatory mapping to identify indigenous community use zones: implications for conservation planning in southern Suriname. J Nat Conserv. 29:69–78. doi:10.1016/j.jnc.2015.11.004.
- Ramirez-Gomez SOI, Verweij P, Best L, van Kanten R, Rambaldi G, Zagt R. 2017. Participatory 3D modelling as a socially engaging and user-useful approach in ecosystem service assessments among marginalized communities. Appl Geogr. 83:63–77. doi:10.1016/j.apgeog.2017.03.015.
- Rasmussen L, Coolsaet B, Martin A, Mertz O, Pascual U, Corbera E, Dawson N, Fisher J, Franks P, Ryan C. 2018. Social-ecological outcomes of agricultural intensification. Nat Sustainability. 1(6):275–282. doi:10.1038/s41893-018-0070-8.
- Raymond CM, Bryan BA, MacDonald DH, Cast A, Strathearn S, Grandgirard A, Kalivas T. 2009. Mapping community values for natural capital and ecosystem services. Ecol Econ. 68:1301–1315. doi:10.1016/j.ecolecon.2008.12.006.
- Reed J, Ickowitz A, Chervier C, Djoudi H, Moombe K, Ros-Tonen M, Yanou M, Yuliani L, Sunderland T. 2020. Integrated landscape approaches in the tropics: a brief stock-take. Land Use Policy. 99:104822. doi:10.1016/j.landusepol.2020.104822.
- Reed J, Van Vianen J, Barlow J, Sunderland T. 2017. Have integrated landscape approaches reconciled societal and environmental issues in the tropics? Land Use Policy. 63:481–492. doi:10.1016/j.landusepol.2017.02.021.
- Reed J, Van Vianen J, Deakin EL, Barlow J, Sunderland T. 2016. Integrated landscape approaches to managing social and environmental issues in the tropics: learning from the past to guide the future. Glob Chang Biol. 22:2540–2554. doi:10.1111/gcb.13284.
- Reyers B, Biggs R, Cumming GS, Elmqvist T, Hejnowicz AP, Polasky S. 2013. Getting the measure of ecosystem services: a social-ecological approach. Front Ecol Environ. 11:268–273. doi:10.1890/120144.
- Sahide MAK, Giessen L. 2015. The fragmented land use administration in Indonesia–Analysing bureaucratic responsibilities influencing tropical rainforest transformation systems. Land Use Policy. 43:96–110. doi:10.1016/j.landusepol.2014.11.005.
- Sayer J, Sunderland T, Ghazoul J, Pfund J-L, Sheil D, Meijaard E, Venter M, Boedhihartono AK, Day M, Garcia C, et al. 2013. Ten Principles for a landscape approach to reconciling agriculture, conservation, and other competing land uses. Proc Natl Acad Sci. 110:8349–8356. doi:10.1073/pnas.1210595110.
- Shantiko B, Fripp E, Taufiqoh T, Heri V, Laumonier Y, 2013. Socio-economic considerations for land-use planning: The case of Kapuas Hulu, West Kalimantan. Working Paper 120. Bogor, Indonesia: CIFOR. https://www.cifor.org/publications/pdf_files/WPapers/WP120Shantiko.pdf
- Sieber R. 2006. Public participation geographic information systems: a literature review and framework. Ann Assoc Am Geogr. 96:491–507. doi:10.1111/j.1467-8306.2006.00702.x.
- Silverman BW. 1986. Density estimation for statistics and data analysis. New York: Chapman and Hall.
- Sumarga E, Hein L. 2014. Mapping ecosystem services for land use planning, the case of Central Kalimantan. Environ Manage. 54:84–97. doi:10.1007/s00267-014-0282-2.
- Sunderland T, Abdoulaye R, Ahammad R, Asaha S, Baudron F, Deakin E, Duriaux J, Eddy I, Foli S, Gumbo D, et al. 2017. A methodological approach for assessing cross-site landscape change: understanding socio- ecological systems. Forest Policy Econ. 84:83–91. doi:10.1016/j.forpol.2017.04.013.
- Sunderlin WD, Dewi S, Puntodewo A, Müller D, Angelsen A, Epprecht M. 2008. Why forests are important for global poverty alleviation: a spatial explanation. Ecol Soc. 13:2590. doi:10.5751/ES-02590-130224.
- Tengberg A, Fredholm S, Eliasson I, Knez I, Saltzman K, Wetterberg O. 2012. Cultural ecosystem services provided by landscapes: assessment of heritage values and identity. Ecosyst Serv. 2:14–26. doi:10.1016/j.ecoser.2012.07.006.
- Thaler GM, Anandi CAM. 2017. Shifting cultivation, contentious land change and forest governance: the politics of swidden in East Kalimantan. J Peasant Stud. 44(5):1066–1087. doi:10.1080/03066150.2016.1243531.
- Tomscha SA, Gergel SE. 2016. Ecosystem service trade-offs and synergies misunderstood without landscape history. Ecol Soc. 21. doi:10.5751/ES-08345-210143.
- Tscharntke T, Clough Y, Wanger TC, Jackson L, Motzke I, Perfecto I, Vandermeer J, Whitbread A. 2012. Global food security, biodiversity conservation and the future of agricultural intensification. Biol Conserv. 151:53–59. doi:10.1016/j.biocon.2012.01.068.
- Van Oort B, Bhatta LD, Baral H, Rai RK, Dhakal M, Rucevska I, Adhikari R. 2015. Assessing community values to support mapping of ecosystem services in the Koshi river basin. Nepal Ecosyst Serv. 13:70–80. doi:10.1016/j.ecoser.2014.11.004.
- Van Vliet N, Mertz O, Heinimann A, Langanke T, Pascual U, Schmook B, Adams C, Schmidt-Vogt D, Messerli P, Leisz S, et al. 2012. Trends, drivers and impacts of changes in swidden cultivation in tropical forest-agriculture frontiers: a global assessment. Global Environmental Change. 22(2):418–429.
- Vongvisouk T, Mertz O, Thongmanivong S, Heinimann A, Phanvilay K. 2014. Shifting cultivation stability and change: contrasting pathways of land use and livelihood change in Laos. Appl Geogr. 46:1–10. doi:10.1016/j.apgeog.2013.10.006.
- Yuliani EL, de Groot WT, Knippenberg L, Bakara DO. 2020. Forest or oil palm plantation? Interpretation of local responses to the oil palm promises in Kalimantan, Indonesia. Land Use Policy. 96:104616. doi:10.1016/j.landusepol.2020.104616.
- Yuliani EL, de Jong EBP, Knippenberg L, Bakara DO, Salim MA, Sunderland T. 2018. Keeping the land: indigenous communities’ struggle over land use and sustainable forest management in Kalimantan, Indonesia. Ecol Soc. 23(4):49. doi:10.5751/ES-10640-230449.