ABSTRACT
The supply of ecosystem services (ES) is commonly assumed to be linked to human wellbeing within socio-ecological systems. However, these linkages are seldom assessed using quantitative approaches at large scales and low spatial resolution. Here, we investigated the complex bidirectional linkages between ES supply and material wellbeing (income) using data from 382,199 rural properties in 178 municipalities from Chilean Patagonia. We assessed two model groups using structural equation modeling (SEM), wherein the first group assumed an impact of ES supply on wellbeing and the second postulated the opposite impact, with wellbeing affecting ES supply. For each group we run a separate SEM per ES category (i.e. provisioning, regulating, and cultural), making a total of six SEM analyzed. We found that neither model group was significantly stronger than the other, as the linkage between ES supply and material wellbeing was not significant in any model. Each model differed notably in their significant path coefficients, with models for cultural and regulating ES showing a better fit than for provisioning ES. We therefore assert that previously assumed links between ES and material wellbeing do not necessarily hold at larger spatial scales and in contexts where rural economies are more diverse and less dependent on natural capital. Understanding ES supply-wellbeing dynamics and how they vary across spatial and temporal scales is important for fostering sustainable socio-ecological systems.
EDITED BY:
1. Introduction
Social-ecological systems (SES) are nested, multilevel systems in which ecological (functions and processes) and social elements (beneficiaries and users) interact through bidirectional relationships and feedback loops (Holling Citation2001; Folke Citation2006). These social and ecological subsystems are usually interdependent, exhibiting complex and dynamic interrelationships (Liu et al. Citation2015). The ecosystem services (ES) framework is one of several SES frameworks (Binder et al. Citation2013), where ecosystem services (i.e. the contributions from nature to people) connect SES subsystems of biophysical processes with human wellbeing (Bennett et al. Citation2015; Delgado and Marín Citation2016; Delgado et al. Citation2019; Felipe-Lucia et al. Citation2022).
One of the fundamental premises of any ES framework is that ecological elements are essential to maintain and enhance human wellbeing (wellbeing thereafter) (Haines-Young and Potschin Citation2010; Raudsepp-Hearne et al. Citation2010; Liu and Wu Citation2021; Liu et al. Citation2022). Ecological elements are underpinned by biodiversity, while human wellbeing generally comprises objective and subjective wellbeing. Objective wellbeing includes basic social, economic and environmental needs that can be directly measured, while subjective wellbeing refers to what humans can feel and think (Summers et al. Citation2018). A common indicator of objective wellbeing is economic welfare and individual income, and a suite of studies have demonstrated a positive relationship between income and wellbeing (Killingsworth Citation2021). For example, Killingsworth (Citation2021) found that experienced wellbeing increases with income above $75,000 per year.
While this ES-wellbeing nexus underpins several ES frameworks such as the Millennium Ecosystem Assessment (Millenium Ecosystem Assessment Citation2005), the cascade model (Potschin and Haines-Young Citation2011) and the Intergovernmental Science-Policy Platform on Biodiversity and Ecosystem Services (IPBES Citation2019), each framework has notable constraints. The Millennium Ecosystem Assessment (MEA) encompasses a typology of ES that is linked to constituents of wellbeing (Summers et al. Citation2012). For example, an ES such as water supply directly influences the values that people derive from nature and their wellbeing (e.g. basic needs, economic needs). However, the framework fails to account for the interlinkages between the socio-ecological components of SES as it lacks bidirectional considerations and over emphasizes the unidirectional relationships (Binder et al. Citation2013). In turn, the ES cascade shows unidirectional linkages between ecosystem structure and processes to ES values and wellbeing (Potschin and Haines-Young Citation2011). However, processes are likely bidirectional, and some studies have begun to incorporate feedbacks from policy and management back to ecosystem condition (Spangenberg et al. Citation2014a, Citation2014b; Comberti et al. Citation2015; Fedele et al. Citation2017). The IPBES conceptual framework has been extended to incorporate the complexity of interactions between anthropogenic assets, institutions and other drivers of ES production (Díaz et al. Citation2015), and has also proposed the broader concept of nature’s contribution to people to account for a plurality of values in relation to nature (IPBES Citation2019). However, there is yet a lack of evidence of the exact nature of these bidirectional interlinkages beyond isolated cases.
The inherent complexity of the ES-wellbeing linkages renders its investigation a great challenge and remains poorly understood (Summers et al. Citation2012; Yang et al. Citation2013; Liu et al. Citation2022). Beyond the lack of empirical studies to support the said relationship (Suich et al. Citation2015; Delgado et al. Citation2019; Blythe et al. Citation2020), recent studies assessing the ES-wellbeing linkage have also shown mixed conclusions including positive (Delgado and Marín Citation2016), negative (Santos-Martín et al. Citation2013; Hossain et al. Citation2016; Wei et al. Citation2018) and non-existent (Yan et al. Citation2017; Liu et al. Citation2022) linkages between ES and wellbeing. In turn, the assumption that ES supply can both affect wellbeing and vice versa is rarely empirically tested. More recently, it has been recognized that ES emerge in SES through the interlinkage between biophysical structures and processes, and human factors (Reyers et al. Citation2013; Fedele et al. Citation2017; Wilkerson et al. Citation2018). ES are co-produced by both natural and human-made capitals and therefore influenced by human decisions regarding financial, knowledge and technological assets (Palomo et al. Citation2016; Bruley et al. Citation2021; Schröter et al. Citation2021). For instance, the use of machines and human labor to harvest forest products such as timber are essential to materialize the benefits from forest provisioning ES. Some of these factors are further related to the concept of human agency – the way in which human agents affect processes significant to bring about change (Schlosser Citation2015). Specifically, we define human agency as the human influence on ES supply through social factors such as education and resource access mechanisms. One example of human agency are institutional structures such as land tenure regime which influences how resources are managed and eventually impact wellbeing (Fedele et al. Citation2017; Lapointe et al. Citation2019; Otto et al. Citation2020).
Property area is another important factor that impacts the bidirectional linkage between ES supply and wellbeing through its effect on land tenure regime. Property area refers to the amount of land owned by a rural landowner and is an attribute of land endowment (Yang and Xu Citation2019). Properties of different sizes have varying capacities to supply different types of ES (Nahuelhual et al. Citation2018; Metzger et al. Citation2021) that contribute directly and/or indirectly to wellbeing (Millenium Ecosystem Assessment Citation2005; IPBES Citation2019). For example, larger properties are most likely to present higher productivity of provisioning ES like food supply (Yamauchi Citation2016) and regulating ES such as carbon sequestration (Atkinson and Ovando Citation2021).
Research characterizing ES-wellbeing interactions have traditionally emphasized four key foci. First, the spatial distribution of ES among beneficiary groups from an access perspective (Gomes Lopes et al. Citation2015; Lakerveld et al. Citation2015; Ramirez-Gomez et al. Citation2020; Szaboova et al. Citation2020; Dade et al. Citation2022), where studies have found that there is an unequal spatial distribution among beneficiary (often marginalized) groups. Second, the role of land ownership and distribution on ES supply (Nahuelhual et al. Citation2018; Benra and Nahuelhual Citation2019; Atkinson and Ovando Citation2021). These studies assert that investigating ES in relation to land ownership and distribution can help to account for ES, develop ES-based policies and specify clearer policy targets. In turn, the distributional dimension is absent from empirical definitions of wellbeing (Lakerveld et al. Citation2015). Third, how a variety of socio-ecological factors can develop on-the-ground impacts on wellbeing, including land-use/land-cover type (Santos-Martín et al. Citation2013; Wang et al. Citation2017; Wei et al. Citation2018), ES bundles (Eigenbrod et al. Citation2017; Hossain et al. Citation2017), anthropogenic interventions (Delgado and Marín Citation2016), and management practices and policies (Zhao et al. Citation2021). Fourth, the development of conceptual frameworks (Cruz-Garcia et al. Citation2017) and indicators that could be used to assess interlinkages within those frameworks (Daw et al. Citation2011; Spangenberg et al. Citation2014). The majority of these studies have used case study data (local to regional) and/or referred only to theoretical frameworks (mainly the MEA), highlighting the crucial need to now use empirical evidence to validate theoretical claims (Cruz-Garcia et al. Citation2017).
Despite these advances, there exists a dearth of studies assessing the modulating role of human agency and property attributes on the ES supply-wellbeing nexus. More recent studies have suggested that a clarification of cause-and-effect linkages including feedbacks may strengthen predictive models (Fischer and Riechers Citation2019). They suggest that an assessment of ES supply-wellbeing linkages at a low level of disaggregation (i.e. the process of understanding the multiple, interdependent dimensions across which ES benefits are appropriated and distributed) is necessary to design and implement policies related to ES (Daw et al. Citation2011; Brück et al. Citation2022). While local data seem to be a good operational extent to analyze the complex ES-wellbeing linkages (Fang et al. Citation2021; Liu and Wu Citation2021), larger scale assessments using local data are scarce (Liu et al. Citation2022). Furthermore, assessments concerning property area and human agency as dimensions in this nexus are frequently aggregated (Atkinson and Ovando Citation2021; Brück et al. Citation2022), and often not considered as key separate factors modulating ES supply (Fedele et al. Citation2017; Atkinson and Ovando Citation2021). In turn, the study of these linkages is underrepresented in countries of the Global South; even studies using income as a wellbeing indicator are either scarce or missing (Cruz-Garcia et al. Citation2017).
Our study will therefore address four key knowledge gaps: i) the lack of empirical evidence used to validate theoretical approaches and test the ES-wellbeing nexus assumption; ii) the lack of studies investigating bidirectional linkages between ES and wellbeing; iii) the underrepresentation of studies from the Global South, and iv) the lack of studies using spatial data at low levels of disaggregation as a basis for large scale assessments that could validate local case-study findings (Brück et al. Citation2022; Liu et al. Citation2022).
We do so by analyzing bidirectional linkages between local ES supply and material wellbeing (income), including property area and human agency as key modulating factors. Specifically, we use property-level data from 382,199 properties in Southern Chile. This entails social data from 178 municipalities, covering nearly half of Chile’s continental area. We focus on seven ES, including provisioning (i.e. water supply and timber supply from native forest), regulating (i.e. water regulation, carbon storage, carbon sequestration, and sediment retention) and cultural services (i.e. recreation potential). We apply a Structural Equation Modeling (SEM) approach to assess six conceptual models encompassing multiple interactions between ES supply, wellbeing (income), human agency and property area that account for the bidirectional relationship between local ES supply and income (i.e. ES supply depending on income and vice versa) for each of the three ES categories (provisioning, regulating and cultural). We expect contrasting ES supply-wellbeing associations across ES categories, with data covering a broad range of regions, with different property regimes and co-production levels (Liu et al. Citation2022).
We hypothesize that: i) a significant bidirectional relationship exists between ES and wellbeing, but differs across ES categories; and ii) significant linkages exist between property area and human agency. This empirical study can contribute towards advancing the debate around ES-wellbeing linkages.
2. Methods
2.1. Study area
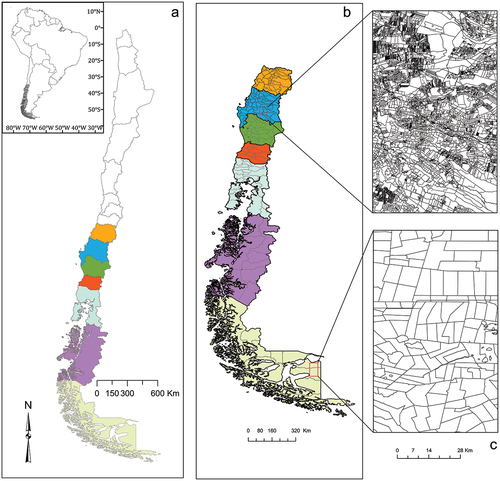
The study area is located in southern Chile between 34.7° S and 55° S and 73.7 W and 67.6° W with altitudes ranging from 0 to 4,077 m.a.s.l. The region stretches for 2,000 km along a north-south axis flanked by the Andes mountains on the east and the Pacific Ocean on the west. The study area comprised seven administrative regions including 178 municipalities and 382,199 properties ().
Figure 1. (a) Study area within Chile, the inset indicates Chile’s location within the South American continent; (b) the seven administrative regions and its 178 municipalities, where each color represents an administrative region; and (c) example of property distribution in two contrasting locations.Footnote1
2.2. Conceptual model
We investigated the bidirectional linkages between ES supply and wellbeing (hereafter, the core linkage) as well as the interlinkages with property area and human agency using an exploratory SEM approach. This core bidirectional relationship can be regarded as a type of feedback loop specifying causal linkages and can help explain socio-ecological dynamics in a cyclical perspective (Fan et al. Citation2016). This type of assessment including bidirectionality has not been empirically explored yet.
We tested a total of six models, two per ES category (regulating, provisioning and cultural). Each pair of SEM comprised the same variables but differed in their organization within the models (i.e. direction of the causal effect of ES on income or vice versa). We first evaluated the three models that specified income as the outcome variable and ES supply as predictor (model group 1, ). We then evaluated three additional models that specified ES supply as the outcome variable while considering income as predictor (model group 2, ). All six models specified human agency as a latent variable, which entails three indicators (i.e. indigenous population, education, and land tenure; ).
Figure 2. Two hypothetical conceptual models of the causal relationships between ES supply and income, where income and ES supply are the respective outcome variables in model groups 1 and 2. The exogenous observed variables are represented by rectangles. Latent variables are represented by ellipses. A straight arrow represents a structural effect (regression) between a predictor and dependent variable.
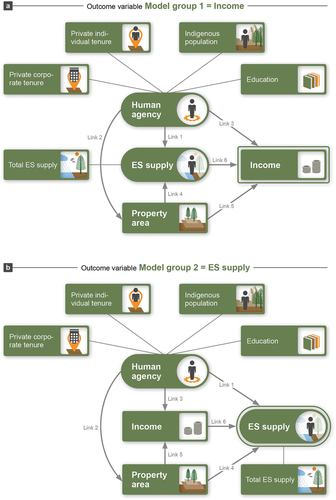
Table 1. Description and source of the socioeconomic variables.
All models included the following variables and indicators:
Indigenous population refers to the proportion of indigenous population in each municipality. It significantly predicts the perception of ES and the actual management practices of landowners (Cuni-Sanchez et al. Citation2016; Chanza and Musakwa Citation2021). Areas with a higher proportion of indigenous population often have more (better quality) natural capital, as indigenous populations are recognized as custodians of many relatively intact areas in the world with high ES provision (Garnett et al. Citation2018; Gadgil et al. Citation2019; IPBES Citation2019). Yet, this is not necessarily the case in Chile where municipalities with highest levels of poverty coincide with high proportions of indigenous population (Agostini and Brown Citation2010; Jullian and Nahuelhual Citation2021). In addition, the effect of ethnicity on ES supply remains understudied in ES research and has focused mostly on urban areas (see Wilkerson et al. Citation2018; Nyelele and Kroll Citation2020).
Education refers to the proportion of people in each municipality with a high education (university) degree. It is a key predictor of management outputs of farms (Yang and Xu Citation2019). Education is a recognized social factor affecting distribution of ES in urban and rural ecosystems (Ernstson Citation2013; Wilkerson et al. Citation2018; Lima and Bastos Citation2019).
Land tenure form encompasses both private individual tenure and private corporate tenure. It refers to a set of property rights associated with the land, and institutions that uphold those rights (Robinson et al. Citation2014). It is measured as the proportion of each tenure type within all municipality’s properties. The form of land tenure therefore refers to the rules and norms associated with any number of entities, such as an individual, a public institution (e.g. national ministry), a private company, a group of individuals acting as a collective, a communal or common property arrangement or an indigenous group (Robinson et al. Citation2018). As more than 70% of the country’s area is privately owned, Chile predominantly comprises private tenure. Within the private tenure form, we can find private individual tenure (by private individuals) and private corporate tenure (by companies or organizations). In our models, we differentiate between the two.
Property area refers to the size of the property in hectares, and directly affects ES supply as it determines the physical production barriers for different ES (Michalski et al. Citation2010; Yang and Xu Citation2019; Paes Ferreira and Féres Citation2020). While the production of ES within each property boundary depends on the ES category (Atkinson and Ovando Citation2021), recent empirical evidence suggests that larger properties deliver greater regulating and cultural services, whereas smaller properties deliver more provisioning ES (Benra and Nahuelhual Citation2019). Globally, larger properties tend to be in an advantageous position of being more productive (Otsuka et al. Citation2016; Yamauchi Citation2016). However, for agricultural areas in developing countries, a negative relationship between farm area and agricultural yields is well supported (Paes Ferreira and Féres Citation2020).
ES supply refers to the potential biophysical production of ES that can be derived from an area and is measured in ES physical units/ha. This is a different concept from ES flow, which considers realized or actually used ES (Metzger et al. Citation2021). ES supply has been used in ES studies looking at distributive issues (Nahuelhual et al. Citation2018; Benra and Nahuelhual Citation2019; Nyelele and Kroll Citation2020) and is a fundamental indicator for ES accountability.
Income refers to the mean income of a municipality measured in the local currency (CLP), and is a robust proxy for wellbeing (King et al. Citation2014; Leviston et al. Citation2018). Specifically, income represents the ‘economic needs’ constituent of wellbeing (Summers et al. Citation2012). It has been widely used in the study of ES and wellbeing interactions worldwide, but less so in Global South countries (Cruz-Garcia et al. Citation2017). While we used income as a proxy for wellbeing, we acknowledge that the definition could be broader and more complex (See Max-Neef Citation1991; Leviston et al. Citation2018 for a discussion), and that other measures might be necessary for a deeper understanding of wellbeing effects.
2.3. Data sources
We first mapped seven ES across seven administrative regions in southern Chile () using available data from peer-reviewed literature. These mapped ES included: water supply, water regulation, carbon storage, carbon sequestration, sediment retention, timber supply from native forest and recreation potential (; see Supplementary Material 1 for a description of the spatial indicators used). We chose this suite of ES as: i) data were available for the whole study area; ii) they have been locally (Nahuelhual et al. Citation2018) and globally (Liu et al. Citation2022) validated; and (iii) they are considered key inputs when developing conservation policies and management strategies.
Table 2. Description and source of the seven mapped ecosystem services.
We then calculated the total ES supply variable at the property scale by computing the cumulative value of ES supply (i.e. summing each pixel’s value) within the boundaries of each property (). A property was defined as a single land parcel (unit or lot) with varying sizes, which is located within a municipality. Each municipality comprised multiple properties that varied significantly in size and tenure. From a raster layer of each ES, we extracted the sum of ES supply for all pixels within each property (30 m resolution) using the raster (Hijmans Citation2020) and rgdal (Bivand et al. Citation2019) packages of the R software (R Core Team Citation2018). We used the mean total ES supply value of all properties within each municipality to match the spatial scale of the socioeconomic data (municipality scale) described below. We conducted an additional sensitivity analysis where only median values were used in all statistical analyses (Supplementary Material 3). As the retained model parameters and parameter estimates were very similar to the original analysis (which used mean values), we did not discuss them further.
*For other references and a complete list of data sources, we refer the reader to Supplementary Material 1
2.4. Data analysis
2.4.1. Proposed measurement and structural model
The measurement model defines how latent variables are measured through observed indicators. In provisioning and regulating ES models, we included two latent variables: human agency (composed of the indicators private corporate tenure, private individual tenure, indigenous population, education) and ES supply (composed of the indicators water supply and timber supply for provisioning services and water regulation, carbon storage, carbon sequestration and sediment retention for regulating services) (; Panels a, b, c and d). The presence of highly correlated indicators for the latent variable of ES supply (>0.8; Appendix A-) is accepted in SEM analyses, and therefore an appropriate choice for inclusion within latent variables (Kang and Ahn Citation2021). We did not specify latent variables for cultural ES for two reasons: first, the variable human agency had only one indicator (recreation potential). Hence, we used recreation potential as a stand-alone variable. Second, for the development of SEM analyses, which include latent variables a minimum of two latent variables is required (Fan et al. Citation2016). We present the SEM models for cultural ES in Appendix B-.
The structural model defines the causal linkages and associations between variables (latent or stand-alone; Kang and Ahn Citation2021). We defined six causal linkages in our model groups ().
For model group 1, human agency had a direct effect on ES supply (link 1). We expect indigenous population (ethnicity) to be related to management options, modulating the production of ES supply (Wilkerson et al. Citation2018). This is because indigenous people often live in ways that lead to greater care and protection of the land (Garnett et al. Citation2018). Education also affects the management of natural resources producing different levels of ES supply (Yang and Xu Citation2019). Both land tenure forms have a different interaction with ES supply. While property owners in the private individual tenure category tend to make short term decisions guided by the need to cover basic and financial needs and local demand, they often have less leverage capacity to access funds for developing extractive and conservation activities in their lands. Conversely, property owners in the private corporate tenure category manage their lands guided by local, regional and international market and demand (of ES) fluctuations. These properties have greater leverage capacity to obtain funds (like credits) and better networking capacities than private individual tenure type properties.
In turn, human agency is associated with property area (link 2). Indigenous populations have historically been confined to smaller properties, intensifying the atomization process of land sizes (wherein a small land area is subdivided from one generation to another within a family or for residential purposes as second homes). Smaller land sizes, however, may force more intensive use and depletion of resources in these communities, which would trigger a long-term reduction of ES supply. Moreover, larger tracts of land that belonged to indigenous people, become larger properties owned by other people or companies. While a municipality may have a high proportion of indigenous population, it is likely that a more intensive use of resources will reduce ES supply in the long term. Landowners with more years of formal education may know how to better invest assets, how to acquire funding, and how to extend networks, which in turn grants them a better capability to further increase ES supply and wealth (Lau et al. Citation2018; Das et al. Citation2022). However, this process would differ across ES categories, wherein an initial high supply of provisioning ES could be followed by a reduction in ES supply for regulating and cultural ES.
Prior studies have demonstrated that human agency and its components can influence income (link 3), through management actions. For example, human agency in the form of agent-based factors affects the supply of ES, the property area and income (Fedele et al. Citation2017; Wilkerson et al. Citation2018; Atkinson and Ovando Citation2021).
In turn, property area directly affects ES supply (link 4) (Michalski et al. Citation2010; Benra and Nahuelhual Citation2019; Atkinson and Ovando Citation2021). A larger property frequently provides greater ES supply (both in mean and total terms), although this is also dependent on the ES category (Nahuelhual et al. Citation2018). Property area also affects income through a more indirect process that can be related to the contribution of ES supply or external income sources (e.g. off-farm income; Bopp et al. Citation2020) (link 5).
Finally, in the core linkage, ES supply affects income (link 6), together with human agency and property area (linkages described above), driving a co-production process (Fischer and Eastwood Citation2016). This means that a combination of human factors, the ecosystem’s potential to supply ES in arrangement with property size form this constituent of wellbeing (income) (Carpenter et al. Citation2006; Daw et al. Citation2011). Income is related to various job-types that have a basic dependence on and can be directly related to ES, human agency and the size of the property, such as agricultural jobs for production of food and animal feed and environmental protection (Summers et al. Citation2012). While many of the contributions to income do not result from ES supply, different levels of ES supply can have significant effects in the achievement of income.
For model group 2, the same linkages hold. The key difference is that income now predicts ES supply (), based on the assumption that landowners with larger income have more resources available to maximize the production of some ES (e.g. timber, food, water). This linkage modification is intended to represent the opposite direction in ES frameworks (like the ES cascade) ‘from services to ecosystems’ (Comberti et al. Citation2015).
2.5. Statistical modeling
Prior to the analysis, we normalized and scaled the data using the packages bestNormalize (Peterson Citation2021) and scales (Wickham and Seidel Citation2020). Then, we evaluated our models using the lavaan package in R (Rosseel Citation2012). We chose maximum likelihood parameter estimation as the data were transformed for normality. Missing data in all models was < 5% which indicated a robust dataset (Hoyle Citation2011), and were automatically excluded from the analysis by listwise deletion (Rosseel Citation2012).
The proposed structural models in were assessed using multiple goodness-of-fit indicators usually reported in SEM literature such as the comparative fit index (CFI) and the standardized root mean square residual (SMRM) (; Supplementary Material 2). The explanatory power of the models was evaluated through the factor loadings, coefficients of determination and significance levels in the measurement model (), while regressions weights and significance levels were used for the structural model (Supplementary Material 2). We did not conduct any post-hoc modifications as the models were well fitted, and the suggested relationships from the modification indices were not supported by the literature.
Table 3. Goodness-of-fit indices for SEM models. The indices are equal for model group 1 and 2. (CFI=Comparative Fit Index; TLI= Tucker-Lewis; PNFI= Parsimony normed fit index; chi²= chi-square statistic; df= degrees of freedom; RMSEA=Root mean square error of approximation; SRMR=standardized root mean square residual).
3. Results
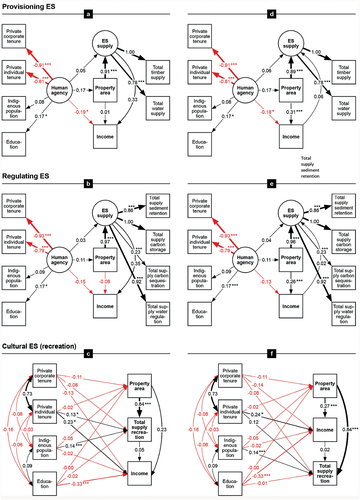
Our hypothesized SEM models () presented a relatively good fit to the data (). The best fitted model corresponded to cultural ES, followed by regulating and provisioning ES. All variables comprising the measurement models of model group 1 and 2, including water and timber supply (provisioning), erosion prevention, water regulation, carbon sequestration and storage (regulating), potential recreation (cultural), private individual tenure, private corporate tenure, education, property area and income were significant at the 0.05 level except for indigenous population (; Supplementary Material 2). The explanatory power of the model’s predictors differed between model group 1 and 2 () when assessing the regression weights and significance levels of individual links.
Figure 3. Estimates for the linkages in model group 1 and model group 2 for provisioning (Panels a and f), regulating (Panels b and d) and cultural (Panel c and f) ES. The difference between model group 1 and 2 is the direction of the arrow between ES supply and income. Black and red arrows represent a positive and negative association, respectively. Arrow width depicts the linkage’s strength, where wider is stronger. Significant values at the 0.05*, 0.01** and 0.001*** levels. The models for cultural ES do not show latent variables.
3.1. Model group 1
Model Group 1 shows the model fits using ES supply as a predictor of income (link 6) (). Significant linkages differed across the model fits for provisioning, regulating, and cultural services (; Supplementary Material 2). The model fit for provisioning ES showed two significant linkages, the model fit for regulating ES one, and the model fit for cultural ES five significant linkages (<0.05 level).
The model fit for provisioning ES showed a positive linkage between property area and ES supply (link 4) and a negative linkage between human agency and income (link 3). The model fit for regulating ES showed a positive linkage between property area and ES supply (link 4). The model fit for cultural ES showed the following positive linkages: private individual tenure-total supply recreation, indigenous population-total supply recreation (both link 1), and private individual tenure-property area (link 2). Negative linkages were shown for education-income (link 1). Hence, the only common significant linkage for all three model fits, was the linkage between property area and ES supply (link 4).
3.2. Model group 2
Model Group 2 shows the model fits using income as a predictor of ES supply (). Again, significant linkages differed across the model fits for provisioning, regulating, and cultural services (; Supplementary Material 2).
The model fit for provisioning ES showed three significant linkages, the model fit for regulating ES two and the model fit for cultural ES five significant linkages (<0.05 level) (; Supplementary Material 2). The significant linkages were the same as for model group 1. In addition, for all model fits of model group 2, the linkage of property area and income (link 5) became positive and significant.
3.3. Comparing group 1 and group 2
Many of the linkages between the two model groups were similar. First, for model groups 1 and 2, the ‘core’ linkage of ES supply-income (link 6) was not significant for any of the model fits (). Second, for both model groups, the linkage property area and ES supply (link 4) emerged as the strongest linkage with a standardized estimate β > 0.8. Third, human agency (recreation potential for cultural ES) showed significant linkages with income (link 3) for provisioning and cultural ES for both model groups. Particularly, private individual tenure and private corporate tenure showed high and significant loadings for the latent variable human agency. Despite these similarities, some regression weights and significance levels of individual links differed for the two model groups. For instance, property area presented a significant linkage with ES supply (link 4) for both model groups but only with income (link 5) for model group 2.
4. Discussion
4.1. Evidence on the ES-wellbeing nexus
In our analysis, we tested the linkages between local supply of provisioning, regulating and cultural ES and wellbeing using a series of SEM. We detected no significant relationship between ES supply and wellbeing (measured as income) across ES categories at the municipality level (i.e. a municipality encompasses several properties). Therefore, our results do not support the ‘environmentalist’s paradox’ (Raudsepp-Hearne et al. Citation2010) and the ‘environmental expectation’ hypotheses (Delgado and Marín Citation2016). The former hypothesis postulates a negative association between ES supply and wellbeing, (i.e. decreases in ES supply are associated with increases in income), while the latter hypothesis posits that decreases in ES supply would lead to decreases in income. One possible explanation is that the ES considered in this study are produced by historical or pristine ecosystems (Hobbs et al. Citation2009), as is the case of most of Chilean Patagonia (Inostroza et al. Citation2016; Martínez-Harms et al. Citation2022). This means that ES in these regions are often not traded in markets (including provisioning ES), and the influence of the human contribution in the co-production process of ES might be of lower importance for the ES investigated in this study (). Another potential explanation of our findings is that despite the general high levels of rurality in the municipalities included in our study (SUBDERE Citation2016), their economies have diversified in the last decades. For example, none of the municipalities in our study had a silvo-agricultural GDP greater than 13%, and this figure decreased drastically to less than 2% in the southernmost regions of Aysen and Magallanes (; ODEPA Citation2019). More diversified income strategies, including non-environmental and off-farm income could imply a lower dependence on ES. For instance, as reported by (Liu et al. Citation2022), the ES-wellbeing link was strongest in rural underdeveloped communities in comparison to more developed areas in mainland China. Additionally, telecoupled effects might explain the absence of a strong linkage between ES supply and income. Telecouplings refer to the linking of local and regional socio-ecological systems to large-scale networked socioeconomic and environmental drivers operating across greater distances (Liu et al. Citation2013; Zimmerer et al. Citation2018). Increasingly, telecoupling literature has demonstrated a weakening of ES-wellbeing linkages at local levels because contributions to wellbeing are being sourced from distant regions (Hull and Liu Citation2018). For example, raw materials such as timber are in many cases imported by local inhabitants to local economies even if the same raw materials could be locally produced. This often exacerbates inequality issues in two ways: first, because local people depend on external sources for their material wellbeing (as telecoupled imports), thus, their dependency on local ES is reduced and, second, distant regions producing ES might suffer from an unequal distribution of natural assets and ES (e.g. through land grabbing) or the activities in terms of labor and management that lead to the co-production of ES supply.
Also, it remains controversial in the literature whether there is a positive or negative relationship between ES and wellbeing. For example, Delgado and Marín (Citation2016) assessed material conditions and quality of life in the Cruces watershed in southern Chile and reported a positive relationship for regulating ES, while provisioning ES showed no relationship with wellbeing. Other studies using per capita income and GDP, quality of life, health and security indicators and the human development index, have reported negative (Hossain et al. Citation2017; Wei et al. Citation2018) and also non-existent (Yan et al. Citation2017; Liu et al. Citation2022) relationships. Of interest is how there is a widening gap between ES and wellbeing at the global level, that is, while global level wellbeing continues to increase, global ES supply continues to decline (Raudsepp-Hearne et al. Citation2010). The mismatch between ES supply and wellbeing could respond to the fact that the direct dependence of humans on nature and ES is increasingly limited to already vulnerable groups (Yang et al. Citation2013; Liu et al. Citation2022). Alternatively, this could result from the context in which studies are situated when identifying the most appropriate ES indicators. The growing field of place-based research could support the investigation of a weakening ES-wellbeing nexus at local scales (Balvanera et al. Citation2017; Norström et al. Citation2022). To address the complexity of the ES-wellbeing nexus, it has been argued that context-dependent studies at local scales are needed (Lakerveld et al. Citation2015; Delgado and Marín Citation2016). However, local scale studies are often conducted in agricultural and fishing communities (Abunge et al. Citation2013; Delgado and Marín Citation2016; Chettri et al. Citation2021; Rey-Valette et al. Citation2022) where the evaluated ES (usually provisioning ES) have a tangible contribution to income and are therefore specifically relevant for local decision-making involving those communities. Studies at this spatial scale might be too context specific and conclusions may not necessarily be relevant to other SES. Hence, broader spatial-scale studies are needed to test the hypotheses that emerge from local case studies or from using local scale data (Liu et al. Citation2022). This could be achieved through examining approaches that involve (i) studies at fine resolution (such as at the municipality scale as per this study); and (ii) incorporating broader spatial scales (e.g. country level; Liu and Wu Citation2021; Brück et al. Citation2022).
4.2. The social-ecological nexus modulating ES supply
Our results showed differing significance levels for other linkages beyond the core linkage of ES supply-income. For instance, human agency did not show significant associations with ES supply, property area and income (links 1, 2 and 3, respectively). We found a negative human agency-income linkage for provisioning services in model group 1 () and model group 2 (). These results would support the co-production framework, as human agency is more influential for provisioning services such as timber supply than for regulating and cultural ES (Palomo et al. Citation2016).
Linkages related to property area were significant, partly supporting our second hypothesis. In particular, ES supply-property area (link 4) emerged as the strongest linkage. This highlights the relevance of property size for the supply of ES. Property size is an important factor that shapes agricultural (Yamauchi Citation2016), conservation (Robinson et al. Citation2018) and ES (Benra and Nahuelhual Citation2019; Dade et al. Citation2022) outcomes. Our results provide empirical evidence to support this recognition. In particular, we found that models with income as a predictor (i.e. group 2 models) are significantly and directly influenced by property area. However, in group 1 models, property area was not significantly linked to income (). Property area is entrenched within the ability and capacity of individual properties to produce ES (i.e. ES supply), or the ‘access to provide’ ES. This is mediated by the quantity and quality of access to land (Atkinson and Ovando Citation2021). This notion differs from the classic idea of access to ES, defined as the capacity to gain benefits from the environment (Ribot and Peluso Citation2003; Dade et al. Citation2022). In that sense, we did not evaluate access as a prerequisite of the ability to experience wellbeing from ES (Szaboova et al. Citation2020), but rather we evaluated how the ability and capability to produce ES from rural properties affected wellbeing (income). Understanding this aspect is relevant for assessing present and future changes in natural resources and ES, particularly considering pressing distributive inequality issues (Benra and Nahuelhual Citation2019).
Overall, we reject the hypothesized high significance of the ES supply-income linkage in both directions, thus contributing to the current debate within the ES literature (Delgado and Marín Citation2016; Blythe et al. Citation2020). However, our results support the hypothesized similarity between these interlinkages in both directions, the marked differences between ES categories, and the high significance of property area and human agency as independent variables within the models.
4.3. Policy implications
Our study provides multifaceted policy implications considering our main findings: the non-significance of the linkage between ES supply and wellbeing (income), and the relevance of property area for ES supply.
First, ES supply was not significantly linked to income. This points to the mismatch between ES suppliers and recipients due to the nature of ES and their telecoupled effects. For example, carbon sequestration and carbon storage (which were included in our analyses) do not necessarily contribute to the wellbeing of local people. The benefits of carbon sequestrations are linked to global climate regulation, which is beneficial to human wellbeing globally. Trying to disentangle the source and the receiver of the ES benefits is, however, methodologically challenging. It further points out the challenges for policymakers to manage ecosystems that provide benefits to people in other regions or even countries (Wang et al. Citation2022). In other words, although the potential of our study region to store carbon is relatively high, incentives for local authorities to preserve this potential may be relatively low because it does not pay off at the local level. Policymakers need to reconcile global benefits of ES and benefits for local people that supply these ES through equitable and novel institutional arrangements such as payment for ecosystem services, which requires collaboration among institutions at different spatial scales (Bennett et al. Citation2015).
Second, property area was significantly linked to the supply of provisioning, regulating, and cultural ES across the different models. This result is important for policymakers as it shows that ensuring property rights can be relevant for the preservation of multiple ES (Robinson et al. Citation2014). To provide incentives for the property owners, institutions need to be implemented that allow landowners and local residents to capture ES benefits (e.g. income). However, a careful consideration of mechanisms needed to achieve that is needed as property concentration (i.e. land, natural capital and ES) in few properties (Benra and Nahuelhual Citation2019) might generate social inequalities, as these larger properties might only conserve or produce commodities, which do not end up being reflected in local income (Serenari et al. Citation2015).
Third, creating markets for ES could provide a mechanism to counter the found mismatch between ES supply and wellbeing. With these markets, ES would pass from not generating income for local people to generate income. For example, regulated markets for native timber used for construction or firewood, or establishing larger schemes of payments for ecosystem services could have a significant impact on people’s wellbeing (Reyes et al. Citation2016; Benra et al. Citation2022).
Last, ES may contribute to other wellbeing dimensions such as health, security, or freedom of choice. However, if natural capital does not sustain material wellbeing, a series of generally considered negative events can happen, such as migration to the rural areas, a consequent atomization and subdivision of rural properties and an incapacity to sustain rural ways of living which depend on land productivity (e.g. ES) and also conservation. While the vocation of the Chilean Patagonia is clearly conservation with a vast network of protected areas and legally protected territories (54% of 380,000 km2) (Martínez-Harms et al. Citation2022), with some regional centers of economic productivity near urban areas (e.g. dairy industry in Los Rios region, ), conservation policy needs to better incorporate local livelihoods into the business model in order to make it more successful, accepted and equitable for local populations (Serenari et al. Citation2017; Araos et al. Citation2020; Zafra-Calvo et al. Citation2020).
4.4. Limitations and future directions
While we focused on investigating the linkages between local ES supply and wellbeing (i.e. income), we recognize that this is only one measure of wellbeing among multiple ones. For example, the inclusion of non-material wellbeing indicators such as life satisfaction and human health could generate a different set of results because the way local people perceive ES contributions in their local social relations and the more relational meanings of nature might be quite different when considering only income. Hence, assessing these linkages through a broader consideration of indicators is needed.
Our study was also challenged by the availability of data at the appropriate spatial resolution. For instance, we were unable to obtain income and other socio-economic data at the property level (i.e. per farm), and therefore we had to aggregate some data to the municipality scale (which combines data from multiple rural properties). While this reduces the diversity of data (Brück et al. Citation2022), we believe that this represents a first analysis that could be strengthened in future studies as new data at a higher resolution becomes available. Finally, the set of selected ES also influences the results. While we analyzed provisioning, regulating and cultural ES, most likely the inclusion of provisioning ES more readily traded in formal markets (e.g. food provision) could generate different results, as a closer linkage with material constituents of wellbeing is expected (Millenium Ecosystem Assessment Citation2005).
5. Conclusion
We tested the bidirectional linkages between ES supply and material wellbeing (income) by developing two sets of models with data from a large-scale investigation in Chilean Patagonia. The first model set posited that ES supply affects wellbeing, while the second assessed how wellbeing affects ES supply, and both covered three categories of ES (provisioning, regulating and cultural). Across all models, we found only a weak relationship between ES supply and wellbeing, with effect sizes differing within and across models. Our results demonstrate that the relationships between ES supply and wellbeing cannot always be substantiated, that is, there is a high context-dependency sensitive to the choice of ES and wellbeing indicators. We therefore conclude that previously assumed links between ES and material wellbeing from local case-studies do not necessarily hold at larger spatial scales. As such, future studies should investigate how ES supply-wellbeing dynamics vary across spatial and temporal scales and with a broad set of wellbeing indicators. Understanding the linkages between ES supply and wellbeing, local mismatches and possible telecoupled dependencies will be crucial to foster sustainable socio-ecological systems.
Supplementary Material 1
Download PDF (163.7 KB)Supplementary Material 2
Download PDF (386.5 KB)Supplementary Material 3
Download PDF (650.8 KB)Acknowledgement
We acknowledge support by the German Research Foundation (DFG) and the Open Access Publication Fund of Leuphana University Lüneburg.
Disclosure statement
No potential conflict of interest was reported by the author(s).
Supplementary material
Supplemental data for this article can be accessed online at https://doi.org/10.1080/26395916.2023.2224448.
Additional information
Funding
Notes
1. For data availability reasons the recently created Ñuble region (formerly part of Bio-Bio region) was not included in the study.
References
- Abunge C, Coulthard S, Daw TM. 2013. Connecting marine ecosystem services to human well-being: insights from participatory well-being assessment in Kenya. Ambio. 42(8):1010–19. doi: 10.1007/s13280-013-0456-9.
- Acuña V, Díez JR, Flores L, Meleason M, Elosegi A, Jones J. 2013. Does it make economic sense to restore rivers for their ecosystem services? J Appl Ecol. 50(4):988–997. doi: 10.1111/1365-2664.12107.
- Agostini CA, Brown PH. 2010. Inequality at low levels of aggregation in Chile. Rev Dev Econ. 14(2):213–226. doi: 10.1111/j.1467-9361.2010.00548.x.
- Araos F, Anbleyth-Evans J, Riquelme W, Hidalgo C, Brañas F, Catalán E, Núñez D, Diestre F. 2020. Marine indigenous areas: conservation assemblages for sustainability in Southern Chile. Coast Manage. 48(4):289–307. doi: 10.1080/08920753.2020.1773212.
- Atkinson G, Ovando P. 2021. Distributional issues in natural capital accounting: an application to land ownership and ecosystem services in Scotland. Environ Resource Econ. 81(2):215–241. doi: 10.1007/s10640-021-00613-6.
- Balvanera P, Calderón-Contreras R, Castro AJ, Felipe-Lucia MR, Geijzendorffer IR, Jacobs S, Martín-López B, Arbieu U, Speranza CI, Locatelli B, et al. 2017. Interconnected place-based social–ecological research can inform global sustainability. Curr Opin Environ Sustainability. 29:1–7. doi: 10.1016/j.cosust.2017.09.005.
- Bennett EM, Cramer W, Begossi A, Cundill G, Díaz S, Egoh BN, Geijzendorffer IR, Krug CB, Lavorel S, Lazos E, et al. 2015. Linking biodiversity, ecosystem services, and human well-being: three challenges for designing research for sustainability. Curr Opin Environ Sustain. 14:76–85. doi: 10.1016/j.cosust.2015.03.007.
- Benra F, de Frutos A, Gaglio M, Álvarez-Garretón C, Felipe-Lucia M, Bonn A. 2021. Mapping water ecosystem services: evaluating InVEST model predictions in data scarce regions. Environ Model Soft. 138:138. doi: 10.1016/j.envsoft.2021.104982.
- Benra F, Nahuelhual L. 2019. A trilogy of inequalities: land ownership, forest cover and ecosystem services distribution. Land Use Policy. 82:247–257. doi: 10.1016/j.landusepol.2018.12.020.
- Benra F, Nahuelhual L, Felipe-Lucia M, Jaramillo A, Jullian A, Bonn C. 2022. Balancing ecological and social goals in PES design – Single objective strategies are not sufficient. Ecosyst Serv. 53:101385. doi: 10.1016/j.ecoser.2021.101385.
- Binder CR, Hinkel J, Bots PWG, Pahl-Wostl C. 2013. Comparison of frameworks for analyzing social-ecological systems. Ecol Soc. 18(4). doi: 10.5751/ES-05551-180426.
- Bivand R, Keitt T, Rowlingson B. 2019. Rgdal: bindings for the ’geospatial’ data abstraction library. R package version 1.4-8. https://CRAN.R-project.org/package=rgdal.
- Blythe J, Armitage D, Alonso G, Campbell D, Esteves Dias AC, Epstein G, Marschke M, Nayak P. 2020. Frontiers in coastal well-being and ecosystem services research: a systematic review. Ocean Coast Manag. 185:105028. doi: 10.1016/j.ocecoaman.2019.105028.
- Bopp C, Engler A, Jara-Rojas R, Arriagada R. 2020. Are forest plantation subsidies affecting land use change and off-farm income? A farm-level analysis of Chilean small forest landowners. Land Use Policy. 91:104308. doi: 10.1016/j.landusepol.2019.104308.
- Bravo C, Loriaux T, Rivera A, Brock BW. 2017. Assessing glacier melt contribution to streamflow at Universidad Glacier, central Andes of Chile. Hydrol Earth Syst Sci. 21(7):3249–3266. doi: 10.5194/hess-21-3249-2017.
- Brück M, Abson DJ, Fischer J, Schultner J. 2022. Broadening the scope of ecosystem services research: disaggregation as a powerful concept for sustainable natural resource management. Ecosyst Serv. 53:101399. doi: 10.1016/j.ecoser.2021.101399.
- Bruley E, Locatelli B, Lavorel S. 2021. Nature’s contributions to people: coproducing quality of life from multifunctional landscapes. Ecol Soc. 26(1). doi: 10.5751/ES-12031-260112.
- Cabezas J, Galleguillos M, Valdés A, Fuentes JP, Pérez C, Perez-Quezada JF. 2015. Evaluation of impacts of management in an anthropogenic peatland using field and remote sensing data. Ecosphere. 6(12):1–24. doi: 10.1890/ES15-00232.1.
- Carpenter SR, Defries R, Dietz T, Mooney HA, Polasky S, Reid WV, Scholes RJ. 2006. Assessment: research needs. Science (1979). 314(5797):257–258. doi: 10.1126/science.1131946.
- Chanza N, Musakwa W. 2021. Indigenous practices of ecosystem management in a changing climate: prospects for ecosystem-based adaptation. Environ Sci Policy. 126:142–151. doi: 10.1016/j.envsci.2021.10.005.
- Chettri N, Aryal K, Thapa S, Uddin K, Kandel P, Karki S. 2021. Contribution of ecosystem services to rural livelihoods in a changing landscape: a case study from the Eastern Himalaya. Land Use Policy. 109:105643. doi: 10.1016/j.landusepol.2021.105643.
- CIREN CORFO. 1999. Digital cartography of rural properties.
- Comberti C, Thornton TF, Wylliede Echeverria V, Patterson T. 2015. Ecosystem services or services to ecosystems? Valuing cultivation and reciprocal relationships between humans and ecosystems. Glob Environ Change. 34:247–262. doi: 10.1016/j.gloenvcha.2015.07.007.
- Cooper NA, Kainer KA. 2018. To log or not to log: local perceptions of timber management and its implications for well-being within a sustainable-use protected area. Ecol Soc. 23(2). doi: 10.5751/ES-09995-230204.
- Cruz-Garcia GS, Sachet E, Blundo-Canto G, Vanegas M, Quintero M. 2017. To what extent have the links between ecosystem services and human well-being been researched in Africa, Asia, and Latin America? Ecosyst Serv. 25:201–212. doi: 10.1016/j.ecoser.2017.04.005.
- Cuni-Sanchez A, Pfeifer M, Marchant R, Burgess ND. 2016. Ethnic and locational differences in ecosystem service values: insights from the communities in forest islands in the desert. Ecosyst Serv. 19:42–50. doi: 10.1016/j.ecoser.2016.04.004.
- Dade MC, Robinson BE, Bennett EM, Robinson BE, Bennett EM, Bennett EM, Robinson BE, Dade MC. 2022. Property rights play a pivotal role in the distribution of ecosystem services among beneficiaries among beneficiaries. Ecosyst People. 18(1):131–145. doi: 10.1080/26395916.2022.2037715.
- Das M, Das A, Seikh S, Pandey R. 2022. Nexus between indigenous ecological knowledge and ecosystem services: a socio-ecological analysis for sustainable ecosystem management. Environ Sci Pollut Res. 29:61561–61578. doi:10.1007/s11356-021-15605-8.
- Daw T, Brown K, Rosendo S, Pomeroy R. 2011. Applying the ecosystem services concept to poverty alleviation: the need to disaggregate human well-being. Environ Conserv. 38(4):370–379. doi: 10.1017/S0376892911000506.
- Delgado LE, Marín VH. 2016. Well-being and the use of ecosystem services by rural households of the Río Cruces watershed, southern Chile. Ecosyst Serv. 21:81–91. doi: 10.1016/j.ecoser.2016.07.017.
- Delgado LE, Rojo Negrete IA, Torres-Gómez M, Alfonso A, Francisco Z-R. 2019. Social-ecological systems and human well-being. In: Delgado LE Marin VH, editors. Social-Ecological systems of Latin America: complexities and challenges. Cham, Switzerland: Springer Nature Switzerland AG; p. 53–69. doi: 10.1007/978-3-030-28452-7_4
- Díaz S, Demissew S, Carabias J, Joly C, Lonsdale M, Ash N, Larigauderie A, Adhikari JR, Arico S, Báldi A, et al. 2015. The IPBES conceptual framework - connecting nature and people. Curr Opin Env Sust. 14:1–16. doi: 10.1016/j.cosust.2014.11.002.
- Eigenbrod F, Tang Z, Eisner S, Flörke M, Zhao G. 2017. Spatial covariance of ecosystem services and poverty in China. Int J Biodivers Sci Ecosyst Serv Manag. 13(1):422–433. doi: 10.1080/21513732.2017.1397750.
- Ernstson H. 2013. The social production of ecosystem services: a framework for studying environmental justice and ecological complexity in urbanized landscapes. Landsc Urban Plan. 109(1):7–17. doi: 10.1016/j.landurbplan.2012.10.005.
- ESRI. 2022. ArcGIS pro: release 3.0.0. Redlands (CA): Environmental Systems Research Institute.
- Fan Y, Chen J, Shirkey G, John R, Wu SR, Park H, Shao C. 2016. Applications of structural equation modeling (SEM) in ecological studies: an updated review. Ecol process. Ecol Process. 5(1). doi: 10.1186/s13717-016-0063-3.
- Fang X, Wu J, He C. 2021. Assessing human-environment system sustainability based on regional safe and just operating space: the case of the inner mongolia grassland. Environ Sci Policy. 116:276–286. doi: 10.1016/j.envsci.2020.12.007.
- Fedele G, Locatelli B, Djoudi H. 2017. Mechanisms mediating the contribution of ecosystem services to human well-being and resilience. Ecosyst Serv. 28:43–54. doi: 10.1016/j.ecoser.2017.09.011.
- Felipe-Lucia MR, Guerrero AM, Alexander SM, Ashander J, Baggio JA, Barnes ML, Bodin Ö, Bonn A, Fortin M, Friedman RS, et al. 2022. Conceptualizing ecosystem services using social–ecological networks. Trends Ecol Evol. 37(3):211–222. doi: 10.1016/j.tree.2021.11.012.
- Fischer A, Eastwood A. 2016. Coproduction of ecosystem services as human-nature interactions-An analytical framework. Land Use Policy. 52:41–50. doi:10.1016/j.landusepol.2015.12.004.
- Fischer J, Riechers M. 2019. A leverage points perspective on sustainability. People Nat. 1(1):115–120. doi: 10.1002/pan3.13.
- Folke C. 2006. Resilience: the emergence of a perspective for social – ecological systems analyses. Glob Environ Change. 16(3):253–267. doi: 10.1016/j.gloenvcha.2006.04.002.
- Gadgil M, Berkes F, Folke C. 2019. Indigenous knowledge for conservation. Ambio. 22:151–156. doi: 10.1038/s41893-019-0341-z.
- Garnett ST, Burgess ND, Fa JE, Fernández-Llamazares Á, Molnár Z, Robinson CJ, Watson JEM, Zander KK, Austin B, Brondizio ES, et al. 2018. A spatial overview of the global importance of Indigenous lands for conservation. Nat Sustain. 1(7):369–374. doi: 10.1038/s41893-018-0100-6.
- Gomes Lopes LF, dos Santos Bento JMR, Arede Correia Cristovão AF, Baptista FO. 2015. Exploring the effect of land use on ecosystem services: the distributive issues. Land Use Policy. 45:141–149. doi: 10.1016/j.landusepol.2014.12.008.
- Guswa AJ, Asce AM, Hamel P, Meyer K. 2018. Curve number approach to estimate monthly and annual direct runoff. J Hydrol Eng. 23(2):1–10. doi: 10.1061/(ASCE)HE.1943-5584.0001606.
- Haines-Young R, Potschin M. 2010. The links between biodiversity, ecosystem services and human well-being. Ecosyst Ecol. 110–139. doi: 10.1017/CBO9780511750458.007.
- Hijmans RJ. 2020. Raster: geographic data analysis and modeling. R package version 3.0-12. https://CRAN.R-project.org/package=raster.
- Hobbs RJ, Higgs E, Harris JA. 2009. Novel ecosystems: implications for conservation and restoration. Trends Ecol Evol. 24(11):599–605. doi: 10.1016/j.tree.2009.05.012.
- Holling CS. 2001. Understanding the complexity of economic, ecological, and social systems. Ecosystems. 4(5):390–405. doi: 10.1007/s10021-001-0101-5.
- Hossain S, Dearing JA, Rahman MM, Salehin M. 2016. Recent changes in ecosystem services and human well-being in the Bangladesh coastal zone. Reg Environ Change. 16(2):429–443. doi: 10.1007/s10113-014-0748-z.
- Hossain MS, Eigenbrod F, Amoako Johnson F, Dearing JA. 2017. Unravelling the interrelationships between ecosystem services and human wellbeing in the Bangladesh delta. Int J Sust Dev World. 24(2):120–134. doi: 10.1080/13504509.2016.1182087.
- Hoyle RH. 2011. Structural equation modeling for social and personality psychology. London: SAGE Publications Ltd. doi: 10.4135/9781446287965.
- Hu LT, Bentler PM. 1999. Cutoff criteria for fit indexes in covariance structure analysis: conventional criteria versus new alternatives. Struct Equ Model. 6(1):1–55. doi: 10.1080/10705519909540118.
- Hull V, Liu J. 2018. Telecoupling: a new frontier for global sustainability. Ecol Soc. 23(4). doi: 10.5751/ES-10494-230441.
- INE. 2007. VII Censo nacional agropecuario y forestal. Resultados preliminares 2006-2007. Santiago, Chile: INE. Instituto Nacional de Estadísticas.
- INE. 2018. Síntesis de Resultados CENSO 2017.
- INFOR. 2018. Anuario forestal 2018. Boletin Estadístico N 163. Santiago de Chile.
- Inostroza L, Zasada I, König HJ. 2016. Last of the wild revisited: assessing spatial patterns of human impact on landscapes in Southern Patagonia, Chile. Reg Environ Change. 16(7):2071–2085. doi: 10.1007/s10113-016-0935-1.
- IPBES. 2019. Global Assessment Report of the Intergovernmental Science-Policy Platform on Biodiversity, IPBES secretariat.
- Jenkins M, Salzman J, Bennett G, Granfors J. 2020. Making the priceless valuable: forests and ecosystem services. Int Forest Rev. 22(1):104–112. doi: 10.1505/146554820829523998.
- Jullian C, Nahuelhual L. 2021. Land Size, Native Forests, and Ecosystem Service Inequalities in the Rural Chilean Patagonia. In: P. L. Peri, L. Nahuelhual, G. Martinez Pastur, editors. Springer Nature Switzerland; p. 379–396. doi:10.1007/978-3-030-69166-0_18
- Kang H, Ahn JW. 2021. Model setting and interpretation of results in research using structural equation modeling: a checklist with guiding questions for reporting. Asian Nurs Res (Korean Soc Nurs Sci). 15(3):157–162. doi: 10.1016/j.anr.2021.06.001.
- Keesstra S, Nunes J, Novara A, Finger D, Avelar D, Kalantari Z, Cerdà A. 2018. The superior effect of nature based solutions in land management for enhancing ecosystem services. Sci Total Environ. 610-611:997–1009. doi: 10.1016/j.scitotenv.2017.08.077.
- Killingsworth MA. 2021. Experienced well-being rises with income, even above $75,000 per year. Proc Natl Acad Sci. 118(4). doi: 10.1073/pnas.2016976118/-/DCSupplemental.
- King MF, Renó VF, Novo EMLM. 2014. The concept, dimensions and methods of assessment of human well-being within a socioecological context: a literature review. Soc Indic Res. 116(3):681–698. doi: 10.1007/s11205-013-0320-0.
- Kline RB. 2010. Principles and practice of structural equation modeling. New York: Guilford Press.
- Lakerveld RP, Lele S, Crane TA, Fortuin KPJ, Springate-Baginski O. 2015. The social distribution of provisioning forest ecosystem services: evidence and insights from Odisha, India. Ecosyst Serv. 14:56–66. doi: 10.1016/j.ecoser.2015.04.001.
- Lapointe M, Cumming GS, Gurney GG. 2019. Comparing ecosystem service preferences between urban and rural dwellers. Bioscience. 69(2):108–116. doi: 10.1093/biosci/biy151.
- Lau JD, Hicks CC, Gurney GG, Cinner JE. 2018. Disaggregating ecosystem service values and priorities by wealth, age, and education. Ecosyst Serv. 29:91–98. doi: 10.1016/j.ecoser.2017.12.005.
- Leviston Z, Walker I, Green M, Price J. 2018. Linkages between ecosystem services and human wellbeing: a nexus webs approach. Ecol Indic. 93:658–668. doi: 10.1016/j.ecolind.2018.05.052.
- Lima FP, Bastos RP. 2019. Perceiving the invisible: formal education affects the perception of ecosystem services provided by native areas. Ecosyst Serv. 40:101029. doi: 10.1016/j.ecoser.2019.101029.
- Liu J, Hull V, Batistella M, deFries R, Dietz T, Fu F, Hertel TW, Cesar Izaurralde R, Lambin EF, Li S, et al. 2013. Framing sustainability in a telecoupled world. Ecol Soc. 18(2). doi: 10.5751/ES-05873-180226.
- Liu J, Hull V, Luo J, Yang W, Liu W, Viña A, Vogt C, Xu Z, Yang H, Zhang J, et al. 2015. Multiple telecouplings and their complex interrelationships. Ecol Soc. 20(3). doi: 10.5751/ES-07868-200344.
- Liu L, Fang X, Wu J. 2022. How does the local-scale relationship between ecosystem services and human wellbeing vary across broad regions? Sci Total Environ. 816:151493. doi: 10.1016/j.scitotenv.2021.151493.
- Liu L, Wu J. 2021. Ecosystem services-human wellbeing relationships vary with spatial scales and indicators: the case of China. Resour Conserv Recycl. 172:105662. doi: 10.1016/j.resconrec.2021.105662.
- Lloret F, Escudero A, Iriondo JM, Martínez-Vilalta J, Valladares F. 2012. Extreme climatic events and vegetation: the role of stabilizing processes. Glob Chang Biol. 18(3):797–805. doi: 10.1111/j.1365-2486.2011.02624.x.
- Locher-Krause KE, Lautenbach S, Volk M. 2017. Spatio-temporal change of ecosystem services as a key to understand natural resource utilization in Southern Chile 2477–2493. Reg Environ Change. 17(8):2477–2493. doi: 10.1007/s10113-017-1180-y.
- Martínez-Harms MJ, Armesto JJ, Castilla JC, Astorga A, Aylwin J, Buschmann AH, Castro V, Daneri G, Fernández M, Fuentes-Castillo T, et al. 2022. A systematic evidence map of conservation knowledge in Chilean Patagonia. Conservat Sci And Prac. 4(1). doi: 10.1111/csp2.575.
- Max-Neef M. 1991. Human scale development: conception, application and further reflections. New York: The Apex Press.
- Metzger JP, Villarreal-Rosas J, Suárez-Castro AF, López-Cubillos S, González-Chaves A, Runting RK, Hohlenwerger C, Rhodes JR. 2021. Considering landscape-level processes in ecosystem service assessments. Sci Total Environ. 796:149028. doi: 10.1016/J.SCITOTENV.2021.149028.
- Michalski F, Metzger JP, Peres CA. 2010. Rural property size drives patterns of upland and riparian forest retention in a tropical deforestation frontier. Glob Environ Change. 20(4):705–712. doi: 10.1016/j.gloenvcha.2010.04.010.
- Millenium Ecosystem Assessment. 2005. Ecosystems and Human Well-being: synthesis. Washington: Island Press.
- Ministerio de Desarrollo Social y Familia. 2015. Base de datos Encuesta Casen 2015.
- Nahuelhual L, Benra F, Laterra P, Marin S, Arriagada R, Jullian C. 2018. Patterns of ecosystem services supply across farm properties: implications for ecosystem services-based policy incentives. Sci Total Environ. 634:941–950. doi: 10.1016/j.scitotenv.2018.04.042.
- Nahuelhual L, Carmona A, Lozada P, Jaramillo A, Aguayo M. 2013. Mapping recreation and ecotourism as a cultural ecosystem service: an application at the local level in Southern Chile. Appl Geogr. 40:71–82. doi: 10.1016/j.apgeog.2012.12.004.
- Norström AV, Agarwal B, Balvanera P, Baptiste B, Bennett EM, Brondízio E, Biggs R, Campbell B, Carpenter SR, Castilla JC, et al. 2022. The programme on ecosystem change and society (PECS)–a decade of deepening social-ecological research through a place-based focus. Ecosyst People. 18(1):598–608. doi: 10.1080/26395916.2022.2133173.
- Nyelele C, Kroll CN. 2020. The equity of urban forest ecosystem services and benefits in the Bronx, NY. Urban For Urban Green. 53:126723. doi: 10.1016/J.UFUG.2020.126723.
- ODEPA. 2019. Panorama de la Agricultura Chilena.152.
- Otsuka K, Liu Y, Yamauchi F. 2016. Growing advantage of large farms in Asia and its implications for global food security. Glob Food Sec. 11:5–10. doi: 10.1016/j.gfs.2016.03.001.
- Otto IM, Wiedermann M, Cremades R, Donges JF, Auer C, Lucht W. 2020. Human agency in the anthropocene. Ecol Econ. 167:167. doi: 10.1016/j.ecolecon.2019.106463.
- Paes Ferreira MD, Féres JG. 2020. Farm size and Land use efficiency in the Brazilian Amazon. Land Use Policy. 99:104901. doi: 10.1016/j.landusepol.2020.104901.
- Palomo I, Felipe-Lucia MR, Bennett EM, Martín-López B, Pascual U. 2016. Disentangling the pathways and effects of ecosystem service co-production. In: Advances in ecological research. Academic Press Inc; p. 245–283. doi: 10.1016/bs.aecr.2015.09.003.
- Peterson RA. 2021. Finding optimal normalizing transformations via bestNormalize. R J. 13(1):310–329. doi: 10.32614/RJ-2021-041.
- Potschin MB, Haines-Young RH. 2011. Ecosystem services: exploring a geographical perspective. Prog Phys Geogr. 35(5):575–594. doi: 10.1177/0309133311423172.
- Puhakka R. 2021. University students’ participation in outdoor recreation and the perceived well-being effects of nature. J Outdoor Recr Tour. 36:100425. doi: 10.1016/j.jort.2021.100425.
- Ramirez-Gomez SOI, van Laerhoven F, Boot R, Biermann F, Verweij PA. 2020. Assessing spatial equity in access to service-provisioning hotspots in data-scarce tropical forests regions under external pressure. Ecosyst Serv. 45:101151. doi: 10.1016/j.ecoser.2020.101151.
- Raudsepp-Hearne C, Peterson GD, Teng M, Bennett EM, Holland T, Benessaiah K, MacDonald GK, Pfeifer L. 2010. Untangling the environmentalist’s paradox: why is human well-being increasing as ecosystem services degrade? Bioscience. 60:576–589. doi: 10.1525/bio.2010.60.8.4.
- R Core Team. 2018. R: a language and environment for statistical computing. Vienna, Austria: R Foundation for Statistical Computing.
- Reyers B, Biggs R, Cumming GS, Elmqvist T, Hejnowicz AP, Polasky S. 2013. Getting the measure of ecosystem services: a social–ecological approach. Front Ecol Environ. 11(5):268–273. doi: 10.1890/120144.
- Reyes R, Blanco G, Lagarrigue A, Rojas F. 2016. Ley de Bosque Nativo: Desafíos Socioculturales para su Implementación. Instituto Forestal y Universidad Austral de Chile.
- Rey-Valette H, Blayac T, Salles JM. 2022. Evaluating the contribution of nature to well-being: the case of ecosystem services related to fish-farming ponds in France. Ecol Econ. 191:107217. doi: 10.1016/j.ecolecon.2021.107217.
- Ribot JC, Peluso NL. 2003. A theory of access. Rural Sociol. 68(2):153–181. doi: 10.1111/j.1549-0831.2003.tb00133.x.
- Robinson BE, Holland MB, Naughton-Treves L. 2014. Does secure land tenure save forests? A meta-analysis of the relationship between land tenure and tropical deforestation. Glob Environ Change. 29:281–293. doi: 10.1016/j.gloenvcha.2013.05.012.
- Robinson BE, Masuda YJ, Kelly A, Holland MB, Bedford C, Childress M, Fletschner D, Game ET, Ginsburg C, Hilhorst T, et al. 2018. Incorporating land tenure security into conservation. Conserv Lett. 11(2):1–12. doi: 10.1111/conl.12383.
- Rosseel Y. 2012. Lavaan: an R package for structural equation modeling. J Stat Softw. 48(2):1–36. doi: 10.18637/jss.v048.i02.
- Santos-Martín F, Martín-López B, García-Llorente M, Aguado M, Benayas J, Montes C, Thrush S. 2013. Unraveling the relationships between ecosystems and human wellbeing in spain. PLos One. 8(9):e73249. doi: 10.1371/journal.pone.0073249.
- Schlosser M. 2015. The neuroscience of agency and free will. In: Gruber C, Clark M, Klempe S Valsiner J, editors. Constraints of agency. Annals of theoretical psychology. Vol. 12. Cham: Springer. doi: 10.1007/978-3-319-10130-9_7.
- Schreiber J, Nora A, Stage F, Barlow E, Jing J. 2006. Reporting structural equation modeling and confirmatory factor analysis results: a Review. J Educ Res. 99(6):323–338. doi: 10.3200/JOER.99.6.323-338.
- Schröter M, Egli L, Brüning L, Seppelt R. 2021. Distinguishing anthropogenic and natural contributions to coproduction of national crop yields globally. Sci Rep. 11(1):11. doi: 10.1038/s41598-021-90340-1.
- Serenari C, Peterson MN, Leung YF, Stowhas P, Wallace T, Sills EO. 2015. Private development-based forest conservation in patagonia: comparing mental models and revealing cultural truths. Ecol Soc. 20(3). doi: 10.5751/ES-07696-200304.
- Serenari C, Peterson MN, Wallace T, Stowhas P. 2017. Indigenous perspectives on private protected areas in Chile. Nat Areas J. 37(1):98–107. doi: 10.3375/043.037.0112.
- Spangenberg JH, Görg C, Truong DT, Tekken V, Bustamante JV, Settele J. 2014a. Provision of ecosystem services is determined by human agency, not ecosystem functions. Four case studies. Int J Biodivers Sci Ecosyst Serv Manag. 10(1):40–53. doi: 10.1080/21513732.2014.884166.
- Spangenberg JH, von Haaren C, Settele J. 2014b. The ecosystem service cascade: further developing the metaphor. Integrating societal processes to accommodate social processes and planning, and the case of bioenergy. Ecol Econ. 104:22–32. doi: 10.1016/j.ecolecon.2014.04.025.
- SUBDERE. 2016. Estudios de Política Rural de la OCDE - Chile. 206
- Suich H, Howe C, Mace G. 2015. Ecosystem services and poverty alleviation: A review of the empirical links. Iss Environ Sci Tech. 12:137–147. doi:10.1016/j.ecoser.2015.02.005.
- Summers JK, Smith LM, Case JL, Linthurst RA. 2012. A review of the elements of human well-being with an emphasis on the contribution of ecosystem services. Ambio. 41(4):327–340. doi: 10.1007/s13280-012-0256-7.
- Summers JK, Smith LM, Fulford RS, Crespo RDJ. 2018. The role of ecosystem services in community well-being. Ecosyst Serv Global Ecol. doi: 10.5772/intechopen.74068.
- Szaboova L, Brown K, Fisher JA. 2020. Access to ecosystem benefits: more than proximity. Soc Nat. 33(2):244–260. doi: 10.1080/08941920.2018.1556759.
- Valdés AA. 2012. Estimación del contenido y balance de carbono en un bosque de Nothofagus pumilio y una turbera de Sphagnum magellanicum en Tierra del Fuego, Chile. Universidad de Chile.
- Völker S, Kistemann T. 2011. The impact of blue space on human health and well-being – Salutogenetic health effects of inland surface waters: a review. Int J Hyg Environ Health. 214(6):449–460. doi: 10.1016/j.ijheh.2011.05.001.
- Wang X, Dong X, Liu H, Wei H, Fan W, Lu N, Xu Z, Ren J, Xing K. 2017. Linking land use change, ecosystem services and human well-being: a case study of the manas river basin of Xinjiang, China. Ecosyst Serv. 27:113–123. doi: 10.1016/j.ecoser.2017.08.013.
- Wang Y, Hong S, Wang J, Lin J, Mu H, Wei L, Wang Z, Bryan BA. 2022. Complex regional telecoupling between people and nature revealed via quantification of trans-boundary ecosystem service flows. People Nat. 4(1):274–292. doi: 10.1002/pan3.10298.
- Ward RC, Robinson M. 2000. Principles of Hydrology. London: McGraw-Hill.
- Wei H, Liu H, Xu Z, Ren J, Lu N, Fan W, Zhang P, Dong X. 2018. Linking ecosystem services supply, social demand and human well-being in a typical mountain–oasis–desert area, Xinjiang, China. Ecosyst Serv. 31:44–57. doi: 10.1016/j.ecoser.2018.03.012.
- Whittaker TA. 2013. The impact of noninvariant intercepts in latent means models. Struct Equ Model. 20(1):108–130. doi:10.1080/10705511.2013.742397.
- Wickham H, Seidel D. 2020. Scales: scale Functions for Visualization. R package version 1.1.1. https://CRAN.R-project.org/package=scales.
- Wilkerson ML, Mitchell MGE, Shanahan D, Wilson KA, Ives CD, Lovelock CE, Rhodes JR. 2018. The role of socio-economic factors in planning and managing urban ecosystem services. Ecosyst Serv. 31:102–110. doi: 10.1016/j.ecoser.2018.02.017.
- Yamauchi F. 2016. Rising real wages, mechanization and growing advantage of large farms: evidence from Indonesia. Food Policy. 58:62–69. doi: 10.1016/j.foodpol.2015.11.004.
- Yang W, Dietz T, Kramer DB, Chen X, Liu J. 2013. Going beyond the millennium ecosystem assessment: an index system of human well-being. PLos One. 8(5):e64582. doi: 10.1371/journal.pone.0064582.
- Yang Y, Xu Y. 2019. Land endowment and education investment behavior of rural households: a field survey based on 887 administrative villages in 31 provinces of China. J Chin Sociol. 6(1):1–19. doi: 10.1186/s40711-019-0093-1.
- Yan Y, Zhao C, Quan Y, Lu H, Rong Y, Wu G. 2017. Interrelations of ecosystem services and rural population wellbeing in an ecologically-fragile area in North China. Sustainability (Switzerland). 9(5):9. doi: 10.3390/su9050709.
- Zafra-Calvo N, Balvanera P, Pascual U, Merçon J, Martín-López B, van Noordwijk M, Mwampamba TH, Lele S, Ifejika Speranza C, Arias-Arévalo P, et al. 2020. Plural valuation of nature for equity and sustainability: insights from the Global South. Glob Environ Change. 63:102115. doi: 10.1016/J.GLOENVCHA.2020.102115.
- Zhao S, Wu X, Zhou J, Pereira P. 2021. Spatiotemporal tradeoffs and synergies in vegetation vitality and poverty transition in rocky desertification area. Sci Total Environ. 752:141770. doi: 10.1016/j.scitotenv.2020.141770.
- Zimmerer KS, Lambin EF, Vanek SJ. 2018. Smallholder telecoupling and potential sustainability. Ecol Soc. 23(1). doi: 10.5751/ES-09935-230130.
Appendices
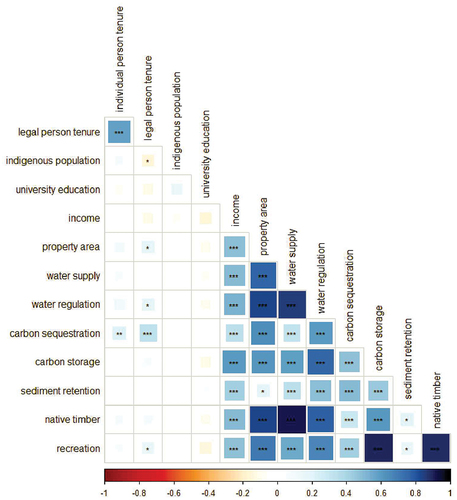
Figure A1. Correlations coefficients between explanatory variables of models 1 and 2 (see table 1 for variable description). p-value= *0.05, **0.01, *** 0.001.
Appendix B.
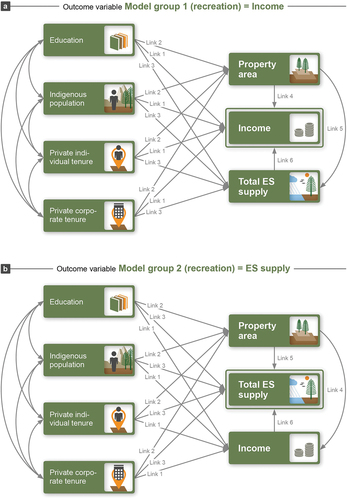
SEM conceptual model for the cultural ES recreation potential
Figure B1. Two hypothetical conceptual models of the causal relationships between ES supply and income for the ES recreation opportunities. Income and ES supply are the outcome variables in model group 1 and 2, respectively. The conceptual models do not include latent variables.