
ABSTRACT
Green Belts are longstanding planning designations, which primarily seek to prevent urban sprawl. Importantly, they form the open spaces close to where most people live, but we lack clarity over how Green Belts are used and valued by publics, and the cultural ecosystem services they provide. To address this policy and research gap, a public participatory mapping survey was conducted on the North-East England Green Belt, with 779 respondents plotting 2388 points. The results show for the first time that in addition to being a planning policy zone, Green Belts are important, and widely used open spaces for ‘everyday nature’, providing several cultural ecosystem services including recreation, connection with nature, sense of place and aesthetic value. Several factors were found to influence the supply of cultural ecosystem services in Green Belts, including proximity to urban areas, woodland land cover and access designations. Whereas most demand pressures on Green Belts were on public rights-of-way, nature designations and deciduous woodlands. Pervasive barriers inhibiting Green Belt’s full potential were identified including management issues, concerns over personal safety and lack of access. We argue that opportunities to further enhance the cultural ecosystem services provided Green Belts and peri-urban landscapes more broadly, not only come from planning policies themselves, but from the design and delivery of approaches integrating urban, rural and land-use policy silos. The findings have wider implications for policy including potential conflict with future development, and opportunities for greater access to greenspace.
Key policy highlights
As well as their primary policy purpose to prevent sprawl, Green Belts protect important open and greenspaces for people to enjoy and interact with nature, exercise and escape from pressures of everyday life.
To understand how people physically use and interact with Green Belts, primary data on use are needed, as relying on access designations alone will not account adequately for use patterns.
Public participatory mapping which involves people answering questions by placing points on a map can provide a useful way to identifying areas that are important; areas which may require improved management in the Green Belt, and opportunity areas for future improvements.
The areas of Green Belt closest to where people live where found to be some of the most heavily used and important in terms of being in nature.
Edited by:
1. Introduction
The supply of cultural ecosystem services (CES) is an important benefit provided by many peri-urban landscapes in Europe (Fagerholm et al. Citation2020; Shaw et al. Citation2020; Spyra et al. Citation2021). CES are the ‘nonmaterial benefits people obtain from ecosystems’ (Millennium Ecosystem Assessment Citation2005, p. 29), which include recreation, sense of place, interaction with nature and aesthetic value, amongst others. Through both direct and indirect pathways they can contribute to improved wellbeing (Fagerholm et al. Citation2020), as well as physical and mental health (Hartig et al. Citation2014). Although CES are being increasingly researched, they are understudied when compared to regulating and provisioning ecosystem services (ES), especially in peri-urban landscapes (Chen et al. Citation2019). Furthermore, this has also inhibited wider understanding of how CES are perceived by publics and consequent policy responses to promote these benefits (Cortinovis and Geneletti Citation2018; Maund et al. Citation2020; Zolyomi et al. Citation2023). This is particularly notable in peri-urban landscapes, which internationally are also neglected research and policy spaces (Scott et al. Citation2013; Chen et al. Citation2019).
A considerable extent of peri-urban landscapes are subject to urban growth management policies (UGMPs), such as Green Belts (GB), which in their most basic policy form designate zones which prevent urban-land uses from extending into peri-urban areas (Amati Citation2008). Such policies are also increasingly gaining research attention across a range of disciplines. Whilst they have been shown to provide a wide range of intended and unintended benefits, including ES, there is a lack of research into CES in GBs (Kirby et al. Citation2023). Yet, uniquely, GBs provide a rare policy example which seeks to govern complex peri-urban landscapes (Scott et al. Citation2013; Shaw et al. Citation2020). In some countries a new generation of multi-goal GBs exist to explicitly promote CES; for example, making them key policy spaces for wider connection with nature (Macdonald et al. Citation2021). However, these wider benefits are not currently mainstreamed in GB policy more widely, particularly in England, which is focused on tackling sprawl, highlighting a potential neglected opportunity space for people to interact with nature (Kirby and Scott Citation2023). This is in part due to a lack of evidence as to how GBs are physically used by people, and the CES they provide, which is needed for evidence-based policy- and decision-making. This gap is important given the increasing international focus on UGMPs and peri-urban areas post-pandemic to provide CES, whilst also accommodating demands for housing (Beckmann-Wübbelt et al. Citation2021; Mell and Whitten Citation2021; Pourtaherian and Jaeger Citation2022), as well as the renewed attention on English GBs to deliver targets to access nature (Defra Citation2023a).
In recent years, the use of public participatory GIS (PPGIS) has grown, and their value demonstrated in mapping perceived CES, including at the interface with planning and land-use policies (Kahila-Tani et al. Citation2016; García-Díez et al. Citation2020). However, they have not been widely applied in all geographies, including English peri-urban landscapes (Brown and Fagerholm Citation2015), thereby creating opportunities to apply PPGIS methods to new geographies and contexts.
Drawing on the outlined interrelating research agendas, and specific research and policy gaps, we undertook a PPGIS survey of the North-East GB (NEGB) with the overarching objective to understand and assess how urban and peri-urban residents use Green Belt and the cultural ecosystem services Green Belts are perceived to provide. Specifically, we pose four research questions: (1) How does Green Belt characteristics and proximity affect its physical use? (2) What cultural ecosystem services are perceived and valued in the Green Belt? (3) What factors within the Green Belt affect the supply of these cultural ecosystem services? and (4) What barriers exist to people physically using and benefitting from Green Belt?
1.1. International research on cultural ecosystem services in Green Belts
Internationally, the GB concept has been implemented in a wide range of urban and peri-urban landscapes (Amati Citation2008; Macdonald et al. Citation2021), but they have attracted limited attention in terms of CES (Kirby et al. Citation2023). Research has demonstrated the positive nature of multi-goal planning for GB as places for recreation and relaxation (Casado-Arzuaga et al. Citation2014; Greenbelt Foundation Citation2021), nature-based tourism (Aziz and Van Cappellen Citation2019), blue spaces (Zhao et al. Citation2021), health and wellbeing (Greenbelt Foundation Citation2021) including multiple forms of recreation (Caspersen and Olafsson Citation2010; Vejre et al. Citation2010). Interestingly, one comparative research between the GB of Edinburgh, Scotland, and Green Wedges of Ljubljana, Slovenia, showed contrasting use patterns (Žlender and Ward Thompson Citation2017).
Comparatively, research on English GBs is lacking, with research on its physical use last conducted over 30 years ago, preceding the rise of the ES framework (Ferguson and Munton Citation1979; Munton and Taylor Citation1981). Previous research revealed unequal distribution of sites especially around deprived areas (Ferguson and Munton Citation1979; Harrison Citation1981) and the importance of local proximity (Harrison Citation1983). More recently some research has shown strong links between ‘commons access’ and place attachment to the GB from people using it (Bradley Citation2019b). Therefore, research is needed to understand how the English peri-urban context compares with evidence from other European countries (Fagerholm et al. Citation2020), and additionally how English GBs as an area-based planning policy may contribute to the policy responses for better mainstreaming of these benefits (Hedblom et al. Citation2017).
1.2. Context: Green Belts, access, and recreation in England
Given the differing international GB and peri-urban contexts, it is important to outline the English GB context with regard to the research objective. The recreational use of GBs to benefit human health and wellbeing in England dates to the earliest inceptions of the policy as a ‘green lung’ for urban populations, where the London Metropolitan GBs goals were tangentially routed in managing sprawl and tackling social inequality (Abercrombie Citation1944). Whereas primarily seen as a policy to prevent sprawl (Mace Citation2018), stakeholders have advocated modernising English GB policy to deliver CES amongst other benefits (Amati and Taylor Citation2010; Campaign to Protect Rural England, & Natural England Citation2010; Bishop et al. Citation2020; House of Lords Citation2022; Thrift Citation2022; Kirby et al. Citation2023). A recent House of Lords Select Committee inquiry recommended that access to GB should be prioritised given its considerable potential to support peoples’ health and wellbeing (House of Lords Citation2022). Additionally, the enhancement of the GB for recreation has been highlighted as contributing to delivering the UK governments targets that ‘everyone should live within 15 minutes’ walk of a green or blue space’ (Defra Citation2023a, p. 245). Thus, there is a timely need for evidence to better understand GBs current and potential use by people to help inform effective policy responses.
There is a strong argument to be made for the potential importance of GBs for providing CES. Firstly, GBs form the countryside around towns and cities for around 30 million people in England (Campaign to Protect Rural England, & Natural England Citation2010). Secondly, international research suggests public gain benefits from the everyday greenspaces close to them, irrespective of outstanding biodiversity (Plieninger et al. Citation2013, Citation2019). This is further confirmed by research demonstrating increased use of greenspace close to where people lived during the pandemic (Venter et al. Citation2020).
However, in contrast to other European countries (e.g. Scotland, Sweden, and Finland) there is no right to roam in England, meaning policy responses are required to facilitate access to GBs. Presently, this is primarily through Public Rights of Way (PROW) networks, open access land and permitted access. Historically, these rights have presented a management challenge in the GB (Curry Citation1994) with a lower than average amount of fully accessible land, compared to non-GB land (Campaign to Protect Rural England, & Natural England Citation2010).
Although GBs are not access designations, planning guidance introduced secondary objectives in the early 2000s to encourage recreation and landscape enhancement in GBs (Office of the Deputy Prime Minister Citation2001); thereby developing it as a ‘progressive policy to open up public access to the countryside’ (Bishop et al. Citation2020, p. 30). Today these objectives are less prominent, with the guidance stating that GBs should be planned positively to ‘enhance their beneficial use, such as looking for opportunities to provide access … and recreation’ (para. 145) and loss of land in the GB should be compensated through improved accessibility (MHCLG Citation2021, para. 142). However, recent research shows that such guidance is highly varied in its interpretation and implementation (Kirby and Scott Citation2023). This raises a key question over how extensively they are used, compared to the policy goals they theoretically have.
Due to the complex nature of peri-urban landscapes (Shaw et al. Citation2020), potential barriers to accessing GBs are not unique to the English context and include alternative pressures from formal recreation such as golf courses (Gallent et al. Citation2004) and agricultural production (Gant et al. Citation2011). Additionally, development of GBs often occurs at the urban edges where development pressure is strongest (Mace Citation2018). However, it is uncertain how this compares and possibly conflicts with CES supply in the GB. Additionally, broader barriers include funding for green infrastructure, which has decreased following recent cuts to local authority and public agencies’ budgets (Mell Citation2021; Kirsop-Taylor Citation2022). Given the wider European transferability of these barriers, the results presented have important transferable and interdisciplinary relevance for other peri-urban landscapes and the wider mainstreaming of nature in planning.
2. Methods
2.1. Case region: North-East Green Belt
The PPGIS survey was applied to the case-region of the North-East Green Belt (NEGB) in England (), where a GB has been maintained around the conurbations of the North-East since the 1960s. Today it covers 772 km2, extending west from the main conurbations of Newcastle and Gateshead into Northumberland. It also extends South, around the conurbations of Sunderland and Durham. Regionally, the planning of the GB is sub-divided into the seven local authorities of Newcastle City Council, Gateshead Council, North Tyneside Council, South Tyneside Council, Sunderland City Council, Durham County Council and Northumberland County Council, with no formal strategic planning of the GB between them.
Figure 1. Geographical location and land use/land cover map of the North-East GB (2021).
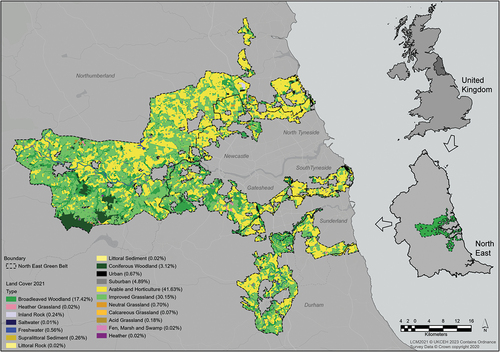
Historically, the region was mined for coal exports leading to its prominence in the industrial revolution. Throughout the early and mid-20th century it was home to heavy industry which declined in the latter 20th century. Today, the legacy of these industries has seen its land-use reclamation for agriculture, forestry, industry, and housing. As shown in , the NEGB is predominantly composed of arable land (42%); improved grassland (30%) and broadleaved woodland (17%). Notably, the NEGB contains historical landmarks, including remnants of Hadrian’s Wall. Socio-economically, the North-East is one of the most deprived regions in England with the highest proportion of households (55%) with at least one deprivation dimension (Office for National Statistics Citation2022).
2.2. Participatory mapping survey design
A PPGIS survey was designed and used to answer the research questions. PPGIS approaches seek to ‘understand location-specific human values, perceptions, behaviour, and preferences’ (Fagerholm et al. Citation2021, 1849). A PPGIS survey can be seen as an extension of a conventional online survey, but formed around map-based questions where participants plot locations to answer questions. Their value has been shown in mapping perceived CES by people at the landscape scale (Fagerholm et al. Citation2020; Gottwald et al. Citation2022). Capturing these human and environmental interactions is seen as important and influential in shaping public policy (Casado-Arzuaga et al. Citation2014).
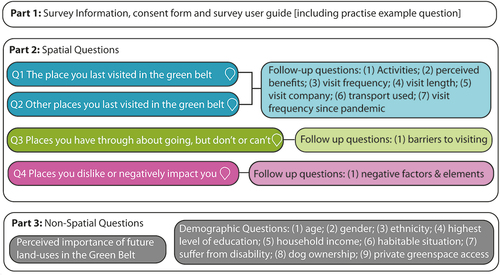
The PPGIS survey questions were co-developed with a stakeholder steering group consisting of regional and national stakeholders from local and private sector planning, professional institutes, politicians and environmental charities. The survey was ethically approved by Northumbria University (number: 29758) and consisted of spatial, and non-spatial questions as shown in . A short pilot survey was conducted between 27 September 2022 and 11 October 2022 with 12 people of different ages (25–64), genders with English as a first and second language. This resulted in minor changes being made to the survey. The full survey ran from 17 October 2022 to 25 January 2023 and was hosted on PPGIS platform Maptionnaire (https://maptionnaire.com). Based on the landscape literacy findings of Escobedo et al. (Citation2022), Google ‘style’ maps were selected as the primary base layer. Spatial data was collected as points, allowing the survey to be easier to use and provide more options for analysis (Brown and Pullar Citation2012). The survey interface and questions can be found in Appendix 1.
Figure 2. Overview of PPGIS survey questions and structure.
Respondent eligibility criteria for participation was based on the usage of the NEGB and being over 16 years of age. This was favoured over 18 years to include an underrepresented demographic. Respondents were primarily recruited through volunteer sampling, which has been shown to be effective for PPGIS research (Kahila-Tani et al. Citation2016). Due to the regional scale of the GB study area, key conurbations surrounding and bordering the GB were targeted for participant recruitment through advertising on local community social media groups; stakeholder networks; printed posters on noticeboards and presentations within secondary school geography lessons (16–17-year-olds). Schools were used to increase participation of younger people, who have been consistently shown to be one of the most underrepresented demographic in PPGIS and planning surveys (Czepkiewicz et al. Citation2017). Participants were primarily recruited through community social media groups and pages with relevant groups, identified through searches of name of conurbations within or near the NEGB and filtered by groups. Groups were mapped in a GIS to establish spatial representation (Appendix 2: Figure S1). In total, the survey was advertised through 72 social media groups. Self-selection of respondents may have been biased towards those interested in the GB, especially given it is a contentious topic. Conversely, it may have yielded a larger sample size than a non-contentious topic (Czepkiewicz et al. Citation2017).
2.3. Data processing and analysis
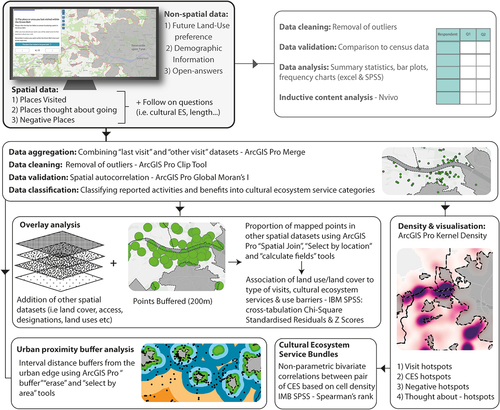
The data analysis was informed by Fagerholm et al. (Citation2021) framework for PPGIS analysis. Specifically, suitable approaches based on the data collected were selected from the ‘explore’ and ‘explain’ categories of their framework. Here ‘explore’ refers to ‘the exploratory and descriptive character of the analysis method’, whereas ‘explain’ aims to ‘understand the relationship between PPGIS data and other geospatial data sources’ (Fagerholm et al. Citation2021, 1853). A visualisation of the data analysis process is shown in .
Figure 3. Graphical overview of the PPGIS survey analytical approach.
Datasets were imported into ArcGIS Pro and shapefiles created from the coordinates for points plotted. Questions 1 (last place visited) and 2 (other places visited) were merged into a single shapefile for analysis. The datasets were cleaned by detecting, correcting, and removing inaccurate spatial records (Fagerholm et al. Citation2021). Points plotted outside the GB area were clipped and removed (n = 62). Demographic responses were imported into Microsoft Excel where summary statistics were created, and responses converted to percentages. Census 2021 data was used to assess representativeness of the respondents which was aggregated from the seven local authority areas. Additionally, the number of non-responses was also counted. Spatial data was tested for spatial autocorrelation (Global Moran’s I) in ArcGIS Pro to validate if spatial patterns of the CES were clustered or randomly distributed.
Activities and perceived benefits reported by respondents were translated into appropriate CES categories (). Classifications were based on previous studies (Plieninger et al. Citation2013; Baumeister et al. Citation2020; Beckmann-Wübbelt et al. Citation2021; Gottwald et al. Citation2022); themselves derived from the Millennium Ecosystem Assessment (Citation2005). Classifications were further adapted with the Common International Classification of Ecosystem Services v5.1 (Haines-Young and Potschin-Young Citation2018) where recreation and its specific forms dominated the CES profile.
Table 1. CES used in the study. Definitions adapted from Haines-Young and Potschin-Young (Citation2018).
Spatial density of points plotted were visualised using heat maps produced from kernel density estimates (Silverman Citation1986) using ArcGIS Pro’s ‘kernel density’ tool, which is regarded as one of the most accurate approaches to calculate density of points (Fagerholm et al. Citation2021). Due to the regional landscape scale of the study area, a cell size of 300 m and search radius of 1000 m was used and displayed using a standard deviation stretch.
Overlay analysis of points plotted with other spatial datasets was done in ArcGIS pro. Relevant publicly and non-publicly available spatial datasets (Appendix 2: Table S1 & Figure S2) were sourced, including access (i.e. PROW), protected nature areas, cultural sites, land cover and other land-uses. Cumulative proportions of mapped points which spatially overlapped with the respective spatial features were calculated. As the land cover had full coverage of the study area, original point data was used to avoid counting multiple land-use types per point. As such, the ‘Spatial Join (overlay)’ tool in ArcGIS Pro with ‘intersect’ was used to determine spatial overlay between points and land cover types. The number of points per land-use classifications was aggregated using the ‘summary statistic’ tool and converted into percentages.
For the other spatial datasets which occupied limited areas of the GB, and following comparative landscape studies (Fagerholm et al. Citation2019), 200-metre buffers were applied to the points using the ArcGIS Pro ‘buffer tool’. Application of buffers to the mapped points accepts both uncertainty in spatial precision of mapping, and the landscape context in which CES are supplied (Brown and Pullar Citation2012; Fagerholm et al. Citation2019). The ‘select by location’ feature in ArcGIS Pro was used to select spatial intersects with the respective features, and the ‘calculate field’ tool in ArcGIS Pro was used to record points which overlapped in the attribute tables. Firstly, to determine if points were proportionally plotted according to the land cover of the GB, z-scores were calculated for each land-cover class, with scores greater than 1.96 (α = 0.05) suggesting a significantly greater proportion of points than expected in the land cover class, and conversely scores less than −1.96 suggesting significantly less. This analysis has been applied by Brown (Citation2013) to account for the spatial area of points plotted per land cover. Secondly, to complement this analysis attribute tables were exported into IBM SPSS Statistics where the frequencies of the mapped attributes (CES and land cover) were cross tabulated along with Chi-Square Standardised Residuals to examine the statistical association. Chi-Square tests have been used in several comparable PPGIS studies as an effective way to show significant spatial associations (Fagerholm et al. Citation2019, Citation2021; Gottwald et al. Citation2022). Statistical analysis was repeated on negative factors and reported barriers.
Buffers were used to categorise the distances of points from the built-up area. Whereas, ‘home’ points are often used to determine distance travelled (Hasanzadeh Citation2022), given the interest in the urban edge as a potential conflict area with development, interval distance buffers were created extending from Ordnance Surveys ‘2023 Built Up Area’. Based on visual analysis of kernel density, buffers of 250 m, 500 m, 1000 m, 2000 m, 4000 m and 8000 m were chosen. At 8000 m all points were captured. Interval distance classes were created for 0–250 m, 251–500 m, 501–1000 m, 1001–2000 m, 2001–4000 m and 4001–8000 m using the erase tool in ArcGIS Pro. The number of points in the respective classes was selected and counted using the ‘select by area’ tool.
To determine if there were any statistically significant correlations between pairs of CES, non-parametric bivariate correlation (Spearman’s rank) was performed between perceived CES and benefits in IBM SPSS Statistics. A 1000 m grid was generated using the ‘fishnet’ tool in ArcGIS Pro, and cell densities for the respective CES calculated using the ‘spatial join’ tool in ArcGIS Pro. In line with other PPGIS studies, correlation coefficients were categorised as strong when ≥ 0.5, moderate from ≥ 0.3 to < 0.5, and weak when < 0.3 (Fagerholm et al. Citation2012; Garcia-Martin et al. Citation2017).
Non-spatial data were analysed in Microsoft Excel and IBM SPSS Statistics to calculate distributions, percentages, and data visualisations, including plots produced. Finally, open-ended question responses were analysed using inductive content analysis in QSR NVivo to thematically code responses. Limitations of the methods are addressed in Section 4.4.
3. Results
In total, 779 respondents plotted 2388 points. However, not all questions were responded to equally. Most points plotted related to visits made (the last place visited = 859 and other important places = 1168). The two other questions had notably fewer points plotted (places thought about going, but do not = 242 and negative places = 119). The reasons for this are unknown, but may be because people perceived fewer negative places, or they found the mapping element demanding. The survey took respondents on average 14 minutes to complete.
3.1. Respondent demographics
Compared with census data (2021), the demographic categories were broadly representative of the regional population albeit with some exceptions (). Age and Ethnicity closely matched with the highest proportion of respondents aged 55–64 (22.8%) and 35–44 (20.0%) and white (95.1%). Notably, there was an overrepresentation of females (61.6%), respondents with a university degree (75.6%), and couples (39.7%). Respondents’ income levels were relatively evenly distributed, across the groups. For all categories there was a considerable number of non-responses to the demographic questions. Similar results have been experienced in other volunteer sampled PPGIS surveys (Gottwald et al. Citation2022) and is a documented limitation of this sampling approach (Fagerholm et al. Citation2022). Therefore, use patterns and perceived CES identified in the subsequent sections may have differed with a more representative sample.
Table 2. Socio-demographic breakdown of survey respondents compared with census population.
3.2. Visit characteristics
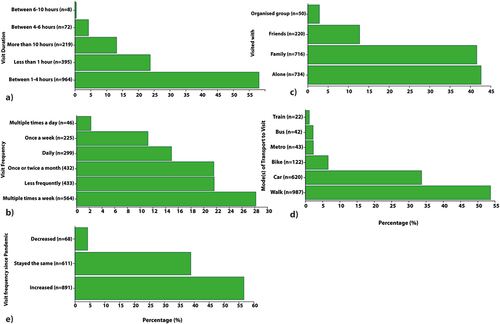
Most respondents spent 1–4 hours on a visit (58.1%) () and were most likely to visit () multiple times a week (28.2%), less frequently (21.7%) or once or twice a month (21.6%). However, over half (56.8%) of respondents reported their visit frequency had increased since the pandemic (). Most people visited the NEGB alone (42.7%) or with their family (41.6%) (). Over half of respondents walked to the NEGB (53.8%) followed by taking the car (33.8%), with the other transport groups much less frequently reported ().
Figure 4. Horizontal bar charts showing percentage of GB a) visit duration b) visit frequency c) visited with d) transport to visits & e) visit frequency since pandemic.
3.3. Spatial variation in GB use
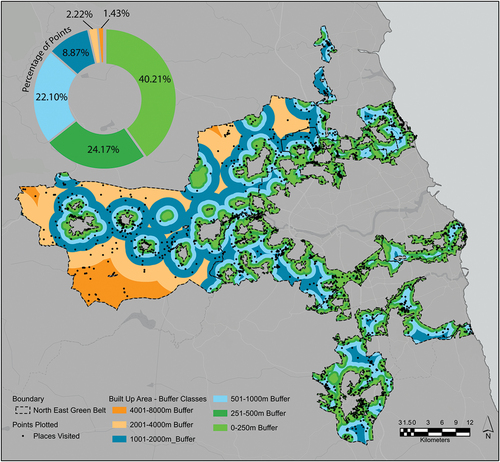
Viewed regionally, the kernel density of all visits plotted (n = 2027) in the NEGB show that higher densities of visits are concentrated in several hotspots, notably around conurbations, wedges, and coastal areas (). However, these hotspots are spread across the geography of the NEGB and a considerable amount of the NEGB is shown to be used, but at lower densities. Notably, the density is lower and more varied to the west. The results of the buffer analysis () further support this, showing that 40.2% of points visited are within 250 m of the built-up area (urban edge) and 64.0% within 500 m. In comparison, only 2.2% of visits occurred 2001–4000 m from the built-up area and 1.5% 4001–8000 m from it. Therefore, areas of the NEGB closer to the urban edge are used much more by respondents.
Figure 5. Kernel density heatmap of GB visits, darker colours represent higher density of visits.
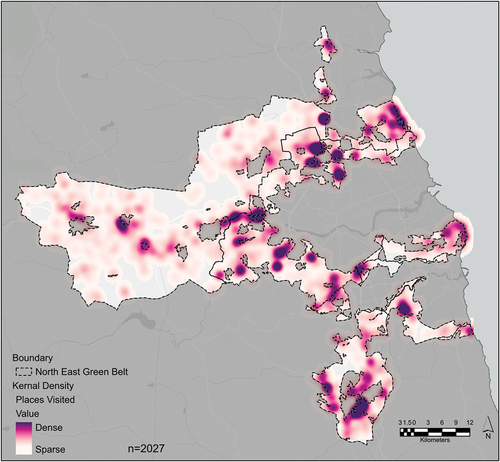
Figure 6. Points visited in the GB overlayed with buffered distance classes from the built-up area.
Most visits were plotted within areas of broadleaved woodland (32.2%, z score = 3.65), improved grassland (27.3%, z score = −0.71) and arable land (25.9%, z score = −3.89) (). However, as shown by the z scores, there was significantly higher proportion of visits in areas of broadleaved woodland, compared to its total proportional land cover (17.4%), suggesting higher demand compared to areas of improved grassland and arable land. Conversely, as shown by the z score arable land was used significantly less than its proportionate land cover (41.6%). In contrast, only 0.9% (z score = −0.55) of visits were within coniferous woodland which covers 3.1% of the NEGB. Other land cover types which had proportionally higher percentage of visits compared to percentage land cover were: freshwater (2.5% of visits, z score = 0.47), sediment (1.7% of visits, z score = 0.14), and suburban areas (7.3% of visits, z score, 0.61).
Table 3. Spatial overlay of all points plotted with GB features and designations.
Once a 200 m buffer was applied to the points plotted, 77.4% overlapped with at least one formal designation, publicly accessible path, or accessible greenspace (). Notably, PROW only cover 1.34% of the NEGB, but 60% of points overlapped with PROW, showing high use. There was also a high use of national cycle networks (12.65%) compared to its relative coverage (0.06%). Both nature designations (SSSI and LNRs) also had high usage (LNR = 9.83%, SSSI = 12.84%) compared to their coverage in the NEGB (LNR = 0.46%, SSSI = 0.69%). Accessible greenspaces (coverage = 3.95%) collectively accounted for 27.22% of visits, with public parks and golf courses the most used therein. Perhaps surprisingly country parks accounted for only 8% of visits, whereas they cover 0.63% of the NEGB. However, around 23% of points did not overlap with any of the designations suggesting considerable informal access in the NEGB.
3.4. Perceived cultural ecosystem services
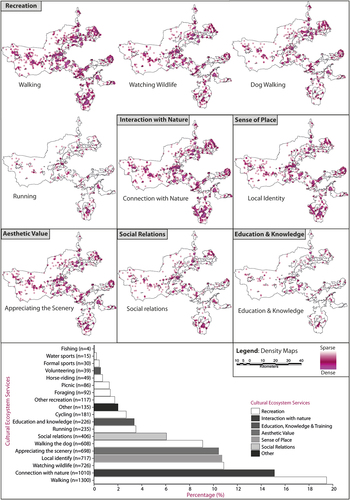
The NEGB was perceived to supply a range of CES () and associated benefits. The three benefits (physical health and exercise = 35.78%, mental health and wellbeing = 33.93% and providing an escape and peace = 30.29%) perceived to be derived from the CES were relatively evenly reported (Appendix 2, Figure S3). Conversely, the CES reported were more varied (). Recreation was the most reported of the CES categories, with walking reported in over half (n = 1300) of visits, followed by watching wildlife (n = 725), walking the dog (n = 608), and running (n = 235). Notably, connection with nature (n = 1010), local identity (n = 717) and appreciating the scenery (n = 698) were also highly reported CES. The content analysis of open-ended responses identified several other forms of recreation, notably; play (n = 10), photography (n = 17) and visiting historic sites (n = 13). Nearly all CES were found to be spatially clustered (Appendix 2: Table S2) except for foraging, other recreation, volunteering, and fishing, due to the low number of responses.
Figure 7. Overall proportion of CES reported from visits plotted. Kernel density heatmaps shown for nine most frequently reported CES.
Most CES pairs were significantly (p < 0.05) correlated with each other (Appendix 2: Table S3). However, strong (p ≥ 0.5) or moderate (p ≥ 0.3 to < 0.5) correlations were found both between (p 0.597) and relating to walking and watching wildlife, with other CES, including walking the dog (p0.388; p0. 333), education (p0.368; p0.354), appreciating the scenery (p0.624; p0.607), local identify (p0.487; p0.569), connection with nature (p0.569; p0.631) and social relations (p0.351; p0.354). Additionally, there was strong correlation with appreciating the scenery and local identify (p0.531), connection with nature (p0.564) and social relations (p0.410). Strong, or moderate strength correlations were also found between several CES and perceived benefits. Notably, no strong or moderate significant correlations were found with formal sports, other recreation, cycling, picnics, fishing, horse riding or fishing.
Chi-square cross tabulations show some of the perceived CES differ significantly (p < 0.05) by land cover (Appendix 2: Table S4), especially for land cover that had significant z scores. Specifically, walking (p = 0.025), watching wildlife (p = 0.001), foraging (p = 0.003), formal sports (p = 0.001), other recreation (p = 0.015), water sports (p = 0.001), volunteering (p = 0.013), education and knowledge (p = 0.029), connection with nature (p = 0.001), and mental health (p = 0.028). Of these, positive R score ranged from 0.1–6.4 (Appendix 2: Table S4). Notably, broadleaved woodland had significantly more frequency of walking (35.1%, R = 1.9), watching wildlife (37.1%, R = 2.3), foraging (34.8%, R = 0.4), education and knowledge (41.6%, R = 2.5), connection with nature (37.1%, R = 2.7) and mental health (43.3%, R = 1.4) than other land-covers. Not surprisingly, some land cover classes were found to have significantly more frequency of some recreational CES such as water sports with freshwater (R = 1.0) and the sediments classes, reflecting beach areas (littoral sediment R = 6.4, supralittoral sediment R = 2.1). Interestingly, of all land cover classes, arable land contributed significantly less to providing CES than other land-covers.
3.5. Barriers to using the Green Belt
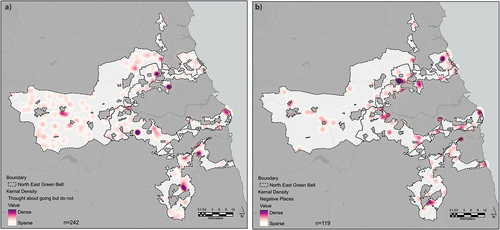
Two questions (Q3 & Q4: ) sought to understand the barriers to NEGB use. Notably, there were around 70% fewer points plotted as either negative, or places felt they could not visit, compared to points placed as visited. However, the kernel density maps show these areas are concentrated to several hotspots (). In both, there was a much lower density of points in the western extents of the NEGB. Hotspots cover serval different uses including an airport, golf courses, sports fields, protected nature site and country parks.
Figure 8. Kernel density heatmaps of (a) places people want to visit, but don’t or cannot. (b) negative places in the GB. Darker colours represented higher density.
In terms of the land cover of points placed (), points largely mirrored the land cover in the NEGB for both questions. For Q3 ‘places people wanted to visit’ points were mainly areas of broadleaved woodland (34.0%), improved grassland (29.1%), arable (19.5%) and freshwater (6.2%). Conversely, for Q4, ‘negative places’, arable land had the highest percentage of negative points (29.91%), followed by improved grassland (26.50%). There was not a statistically significant association between any of the barriers and the land cover of points (Appendix 2: Table S5 & S6). However, the lower sample size will have affected the ability to draw statistically significant findings from the analysis.
In contrast to places visited, the majority of points (60.7%) people ‘thought about going, but do not, or cannot’ did not overlap with any of the overlay analysis layers (). However, 69.75% of negative places plotted overlapped with at least one overlay layer. Notably, 49.57% with PROW and 21.84% with greenspace, nearly half of which were golf courses.
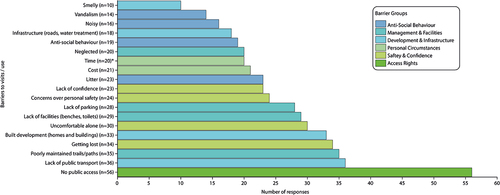
Reported barriers to NEGB use more broadly, provide context to some the observed patterns. shows the most frequently reported barriers to NEGB use. They can be grouped into: (1) management and facilities, (2) personal circumstances, (3) safety and confidence, (4) access rights, (5) anti-social behaviour and (6) development and infrastructure. With ‘access rights’, ‘management and facilities’, ‘safety and confidence’ and ‘development and infrastructure’ were most reported. Notably, ‘no public access’ was the most reported specific barrier to using the NEGB.
Figure 9. Frequency of reported barriers to GB use. *Category created from analysis of open-ended ‘other’ answers.
4. Discussion
This study sought to understand and assess how urban and peri-urban residents use GBs and the CES GBs are perceived to provide. Building on the results the following discussion unpacks the findings in relation to the wider research contexts and cross-cutting research and policy implications.
4.1. Green Belt: a planning policy opportunity space for cultural ecosystem services
The results show that, in addition to being a planning policy zone to prevent urban sprawl, the NEGB is an important, and widely used open space for everyday nature, providing several CES. These were focused on quiet and informal recreation, and people-nature interactions. The results not only extend findings on international GBs to England, but demonstrate a greater range of CES in GBs than those reported in different international contexts and geographies (Vejre et al. Citation2010; Casado-Arzuaga et al. Citation2014; Greenbelt Foundation Citation2021). Additionally, when compared to international research our results show the incidental benefits of GBs for CES through the protection of open space, even when such benefits are not explicit in policy aims (Kirby and Scott Citation2023). Although newer GBs such as those in Ontario (Macdonald et al. Citation2021) have such aims, GBs still provide important CES benefits. This is especially relevant given the wide range of variations in GB policy and governance approaches adopted internationally (Amati Citation2008), as well as new UGMP approaches being developed (Tan et al. Citation2022).
Several factors were found to influence the supply of CES in the NEGB, notably, proximity to urban areas, broadleaved woodland land cover and access designations. Similarly, wider peri-urban PPGIS research has shown the importance of woodland close to people, including their perceived importance to wellbeing during the pandemic (Beckmann-Wübbelt et al. Citation2021). Therefore, incentives to increase woodland cover, such as the recent North-East Community Forest initiative, may be highly beneficial to the supply of CES in these GB zones (Newcastle City Council Citation2023). Another spatial hotspot for visits and multiple CES were the coastal areas of the GB which, internationally, have also been shown to provide more abundant levels of CES when compared to non-coastal areas (Brown and Hausner Citation2017). However, the hotspots identified are also near the urban area making it hard to distinguish the importance of these coastal areas.
Conversely, arable land was perceived to supply relatively fewer CES; a finding mirrored internationally in agricultural landscapes (Brown Citation2013). Related to this, public preference for future landscapes in England are for more diverse mosaic land cover on agricultural landscapes, which may increase perceived CES (Rust et al. Citation2021). Here the agri-environmental schemes such as the proposed English replacement to the Common Agricultural Policy of the EU; the ‘environmental land management schemes’, may be a key enabler of land cover change in the GB, as well as an opportunity to combine and improve access. This is important, as previous schemes have been designed through a prevailing ‘rural’ lens which have neglected CES such as recreation (Eigenbrod et al. Citation2009). However, research from schemes in the EU show land owners are less willing to increase access in such schemes (Broch and Vedel Citation2012). Therefore, given the relevance of the results to GBs more broadly, and other peri-urban landscape, a purposely designed ‘peri-urban’ or GB specific agri-environmental scheme or programme may better respond to the unique context and trade-offs in the peri-urban, and promote interventions to improve CES, especially given the diversified nature of Europe’s peri-urban landscapes (Shaw et al. Citation2020). Such programmes could be comparable to other bespoke area-specific programmes which respond to specific challenges and needs through funded projects, such as the Farming in Protected Landscapes programme in Areas of Outstanding Natural Beauty, which has a strong cultural focus (Defra Citation2023b).
We argue that opportunities to further enhance the CES provided in areas of GB, and peri-urban landscapes more broadly, not only come from the planning policies themselves, but from a more holistic and joined up policy approach crossing urban, rural and land use policy silos, which is currently disintegrated (Scott et al. Citation2013). That being said, the results here catalyse improvement of GB policies which currently poorly account for CES given the need for evidence-based policy (Kirby and Scott Citation2023). For example, a stakeholder steering group assembled for wider research on GBs is in the early stages of using the results to support a new and more holistic approach to GB planning including promoting CES model policies, as well as exploring how the results can be mainstreamed using GB planning ‘hooks’ such as nature recovery and health. This addresses a notable gap in many ES studies which fail to consider policy implications of their work (Zolyomi et al. Citation2023).
4.2. Managing pervasive barriers in Green Belts
We argue that GBs represent important and positive peri-urban opportunity spaces for CES. However, the results identify several barriers to CES supply. This includes several pervasive barriers to GB’s use historically, as well as more general barriers to wider greenspace use internationally. For example, lack of access, poor maintenance, and concerns of personal safety were first highlighted throughout the latter 20th century in GBs (Curry Citation1994). Additionally, several similar barriers to greenspace use have been reported internationally. Specifically; personal circumstances, safety and personal confidence, access rights, litter, lack of time, neglect of site and anti-social behaviour in isolation and cumulatively, which can be the result of both social and individual drivers of disconnect (Beery et al. Citation2023).
In English GBs, PROW have historically experienced legal (e.g. enforcement) and management underinvestment resulting in blocked access, unlawful removal, poor conditions and lack of adequate signposting (Curry Citation1994). The wider recreational use of GBs is largely reliant on countryside management which has suffered from reduced funding during austerity (Scott et al. Citation2013; Mell Citation2021), meaning fewer resources and investment in recreational infrastructure delivery (Rotherham Citation2015). Barriers may be further exacerbated due to the statutory responsibility of PROW resting with highway authorities, as opposed to countryside or planning authorities (Curry Citation1994) and the prevailing silo mentality which still exists (Scott et al. Citation2013).
Based on the pervasive and prevalent nature of these barriers, we suggest several measures for their mitigation. Firstly, the findings support increased investment in the PROW network in the GB. Given ‘no access’ was the most reported barrier (), more access to GB land may be provided through expanded PROW or permitted access, which could also be delivered through future compensatory improvement from GB development (MHCLG Citation2021, para. 142). This may also help mitigate the high use pressure on existing PROW and protected nature sites as reported in the results, which have been an historic concern for areas in England and other densely populated countries, requiring evidence-based responses (Curry and Pack Citation1993). Here our results, as well as international research on UGMP zones (Caspersen and Olafsson Citation2010) reinforce that people use different peri-urban spaces to derive different CES. Therefore, mitigating negative effects of recreation on protected nature sites (Weitowitz et al. Citation2019) should not solely focus on ‘suitable alternative natural greenspace’ (which seek to shift recreation from protected sites) but wider recreational demands and patterns. Likewise, people may not be aware of where they can access nature. Here communication and themed walks could help increase underused areas of GB. In the Greater Golden Horseshoe Greenbelt, Ontario Canada, targeted information and adverts have been used, including new trails to increase wider use of its GB (Greenbelt Foundation Citation2020).
Additionally, accessing the NEGB through public transport was very low, and reported as a barrier to use (). Therefore, policy makers responsible for public transport should seek to provide more flexible services which may also reduce use pressure on GBs near the urban edge. Alternatively, policy responses to increase access in the GBs should take account of existing public transport networks, especially in areas where urban expansion in the GB may occur. For example, the newly created trail route ‘Greater Manchester Way’ across the GB was designed to be accessible at each stage by public transport (Greater Manchester Walking Citation2022).
Perhaps one of the most universal solutions to overcoming several of the barriers, regardless of geographical location is increased investment and planning. Internationally, the Greenbelt Foundation in Ontario, Canada is an example of a part public-funded organisation which promotes the use of the GB (Greenbelt Foundation Citation2020). In the Green Wedges of Copenhagen, their recreational use has be supported by long-term multi-scale planning (Caspersen et al. Citation2006). Just as in the past where grants were critical to new recreational areas in the GB (Curry Citation1994), emerging environmental legislation and ES markets may provide investment opportunities for CES. However, unless they are considered equally alongside nature recovery, there is a danger such benefits may be neglected, especially with the emphasis on biodiversity, as opposed to broader ES (Zu Ermgassen et al. Citation2021). Alternative payment for ES models, such as ‘visitor payback’, may be complementary to increase financial resources to manage CES alongside wider conservation goals, but have had mixed success and demand caution in their use (Scott et al. Citation2003).
4.3. Beyond Green Belts: wider implications and transferability to peri-urban decision-making
Beyond the North-East NEGB context, the results have wider implications for peri-urban planning and decision-making internationally, for CES in general and supply of CES in peri-urban spaces in particular. With regard to the former, the findings align with other recent PPGIS ES research in Europe, that CES are highly perceived closest to where people live (Plieninger et al. Citation2013, Citation2019; Fagerholm et al. Citation2019; Cusens et al. Citation2022). Arguably, this may support the proposition that in a European context, proximity may be more important than the objectively defined ‘quality’ of greenspace, in their perceived value and use. This is attested to in different contexts ranging from international protected sites (Cusens et al. Citation2022), rural landscapes (Fagerholm et al. Citation2019) and NEGB peri-urban landscapes (this study).
Given the interest in peri-urban planning and current poor inclusion of CES in planning (Cortinovis and Geneletti Citation2018; Spyra et al. Citation2021), the results illustrate the merits of PPGIS mapping as a mechanism to better understand perceived supply of CES. GBs are under renewed and increasing pressure to accommodate new development (Mace Citation2018) and whilst planning is often evidence-based, the current approach which account for designations in the decision-making process through development plan policies does fully account for use patterns in the GB, as shown in our results (Section 3.3). This becomes significant given emerging plans in the NEGB looking are to expand into sites at the urban edge, which has potential to conflict with supply of CES. This scenario is not limited to the English GB context, but transferable to many peri-urban landscapes internationally which are expanding or under pressure to expand through urbanisation (Nilsson et al. Citation2013). Here use of comparable PPGIS methods may help identify and thus mainstream CES use and value in policy- and decision-making, regardless of UGMPs, and help manage land-use tensions where CES hitherto have not been fully included in the process (Bradley Citation2019a). For example, in Finland where PPGIS approaches are becoming mainstreamed in decision-making, there has been broader demographic engagement observed concomitant with a broader range of values to be quantified (Kahila-Tani et al. Citation2019). Furthermore, several of the results have potential transferable findings for other peri-urban areas which may not have GBs, for example the importance of woodlands in peri-urban landscapes as well as formal rights of access and designated nature site in the peri-urban. Such landscape features and policies are likely important for CES in many peri-urban landscape internationally (Beckmann-Wübbelt et al. Citation2021).
4.4. Limitations and future research
Notwithstanding specific methodological limitations outlined throughout Sections 2 and 3 (e.g. uneven sample demographic, contentious policy, differing sample size per questions), there are several wider limitations of this study and the consequent results which merit discussion. First, the direct transferability of the study to other English and International GBs. Whereas this is the first study in over 30 years to demonstrate the CES benefits and physical use patterns of an English GB, there is a need for comparative research in other English GBs to differentiate between this case-specific GB and more general findings. Given the similarity of our findings with other international studies (Vejre et al. Citation2010; Casado-Arzuaga et al. Citation2014; Fagerholm et al. Citation2019; Greenbelt Foundation Citation2021), we might expect similar findings from other English GBs but the place-based context matters.
A second limitation is that this study only considers CES, and a notable gap still exists in studying cultural, regulating and provisioning ES together and their cumulative impact and trade-offs in GB; both in England and international contexts (Kirby et al. Citation2023). This is especially important for understanding GB and wider peri-urban landscapes through the lens of multifunctionality, where research shows that trade-offs between ES are complicated and contested, due to different public perceptions of supply and demand for these services (Filyushkina et al. Citation2022). Such research may support much needed investment by recognising CES with other ESs such as flood mitigation which then can demonstrate multiple benefits and open up new funding opportunities and mechanisms (Walsh et al. Citation2022).
Finally, in terms of some of the specific findings, nearly 30% of points did not overlay with designations, meaning our analysis was limited in understanding the factors’ contribution to CES. Here further participatory place-based methodologies utilising GPS or photovoice approaches may help understand these more informal uses (Long et al. Citation2015; Baldwin et al. Citation2017). Likewise, PROW were extensively used, but the use of point data limited any meaningful understanding the analysis of routes taken. Whereas this was a conscious trade-off in the use of point vs line data, the latter would be more suitable to demonstrate this. Consequently, we currently lack sufficient spatial evidence to target the investment in PROW.
5. Conclusions
Participatory mapping of the NEGB shows a highly used and valued peri-urban landscape which supplies a diverse range of CES, notably: recreation, sense of place and connection with nature, close to large urban populations. Conversely, it also shows pervasive barriers to realising its full potential. It is argued that the findings presented have direct and transferable importance for peri-urban planning and environmental policy in England, and internationally in terms of access to nature. Future land-use decisions in these highly contentious GB areas may be reduced through the generation and inclusion of public participatory data in the decision-making process. In an English context, the findings demonstrate the place-based importance of these policy zones, beyond their core goal to prevent urban sprawl. With a growing ambition amongst some stakeholders for more multifunctional GB, the results of this study contribute a key evidence base to further understand trade-offs, baseline conditions and future spatial priorities for improving the benefits people get from nature close to towns and cities both in England and internationally.
Supplemental Material
Download PDF (468.1 KB)Supplemental Material
Download PDF (3.7 MB)Acknowledgements
We wish to thank, Catriona Riddell, Nicky Gavron, Andrew Wood, Gayle Wootton, Tim Crawshaw and Neil Wilkinson, who are members of M Kirby’s stakeholder steering group for co-developing the participatory mapping themes and questions. As well as Jason Luger for comments on early drafts of the paper. We also wish to thank the residents of North-East England who responded to our survey. Additionally, we are very grateful to the two anonymous peer-reviewers for their helpful comments and recommendations which has improved this manuscript.
Disclosure statement
No potential conflict of interest was reported by the author(s).
Supplementary material
Supplemental data for this article can be accessed online at https://doi.org/10.1080/26395916.2023.2276752
Additional information
Funding
References
- Abercrombie P. 1944. Greater London Plan 1944. London: H.M. Stationery Office.
- Amati M. 2008. Urban Green Belts in the Twenty-first Century. Aldershot, Hampshire, England; Burlington (VT): Routledge.
- Amati M, Taylor L. 2010. From Green Belts to Green Infrastructure. Plann Pract Res. 25(2):143–19. doi: 10.1080/02697451003740122.
- Aziz T, Van Cappellen P. 2019. Comparative valuation of potential and realized ecosystem services in Southern Ontario, Canada. Environ Sci Policy. 100:105–112. doi: 10.1016/j.envsci.2019.06.014.
- Baldwin C, Smith T, Jacobson C. 2017. Love of the land: social-ecological connectivity of rural landholders. J Rural Stud. 51:37–52. doi: 10.1016/j.jrurstud.2017.01.012.
- Baumeister CF, Gerstenberg T, Plieninger T, Schraml U. 2020. Exploring cultural ecosystem service hotspots: linking multiple urban forest features with public participation mapping data. Urban For Urban Green. 48:126561. doi: 10.1016/j.ufug.2019.126561.
- Beckmann-Wübbelt A, Fricke A, Sebesvari Z, Yakouchen-kova IA, Fröhlich K, Saha S. 2021. High public appreciation for the cultural ecosystem services of urban and peri‑urban forests during the COVID-19 pandemic. Sustain Cities Soc. 74:103240. doi: 10.1016/j.scs.2021.103240.
- Beery T, Stahl Olafsson A, Gentin S, Maurer M, Stålhammar S, Albert C, Bieling C, Buijs A, Fagerholm N, Garcia-Martin M, et al. 2023. Disconnection from nature: expanding our understanding of human–nature relations. People Nat. 5(2):470–488. doi: 10.1002/pan3.10451.
- Bishop P, Perez AM, Roggema R, Williams L. 2020. Repurposing the Green Belt in the 21st Century. UCL Press. doi: 10.14324/111.9781787358843.
- Bradley Q. 2019a. Combined authorities and material participation: the capacity of Green Belt to engage political publics in England. Local Econ. 34(2):181–195. doi: 10.1177/0269094219839038.
- Bradley Q. 2019b. Public support for Green Belt: common rights in countryside access and recreation. J Environ Pol Plan. 21(6):692–701. doi: 10.1080/1523908X.2019.1670049.
- Broch SW, Vedel SE. 2012. Using choice experiments to investigate the policy relevance of heterogeneity in Farmer agri-environmental contract preferences. Environ Resour Econ. 51(4):561–581. doi: 10.1007/s10640-011-9512-8.
- Brown G. 2013. The relationship between social values for ecosystem services and global land cover: an empirical analysis. Ecosyst Serv. 5:58–68. doi: 10.1016/j.ecoser.2013.06.004.
- Brown G, Fagerholm N. 2015. Empirical PPGIS/PGIS mapping of ecosystem services: a review and evaluation. Ecosyst Serv. 13:119–133. doi: 10.1016/j.ecoser.2014.10.007.
- Brown G, Hausner VH. 2017. An empirical analysis of cultural ecosystem values in coastal landscapes. Ocean Coast Manag. 142:49–60. doi: 10.1016/j.ocecoaman.2017.03.019.
- Brown G, Pullar DV. 2012. An evaluation of the use of points versus polygons in public participation geographic information systems using quasi-experimental design and Monte Carlo simulation. Int J Geogr Inf Sci. 26(2):231–246. doi: 10.1080/13658816.2011.585139.
- Campaign to Protect Rural England, & Natural England. 2010. Green belts: a greener future. London: CPRE ; Natural England.
- Casado-Arzuaga I, Onaindia M, Madariaga I, Verburg PH. 2014. Mapping recreation and aesthetic value of ecosystems in the Bilbao Metropolitan Greenbelt (northern Spain) to support landscape planning. Landsc Ecol. 29(8):1393–1405. doi: 10.1007/s10980-013-9945-2.
- Caspersen OH, Konijnendijk CC, Olafsson AS. 2006. Green space planning and land use: an assessment of urban regional and green structure planning in Greater Copenhagen. Geogr Tidsskr. 106(2):7–20. doi: 10.1080/00167223.2006.10649553.
- Caspersen OH, Olafsson AS. 2010. Recreational mapping and planning for enlargement of the green structure in greater Copenhagen. Urban For Urban Green. 9(2):101–112. doi: 10.1016/j.ufug.2009.06.007.
- Chen X, de Vries S, Assmuth T, Dick J, Hermans T, Hertel O, Jensen A, Jones L, Kabisch S, Lanki T, et al. 2019. Research challenges for cultural ecosystem services and public health in (peri-)urban environments. Sci Total Environ. 651:2118–2129. doi: 10.1016/j.scitotenv.2018.09.030.
- Cortinovis C, Geneletti D. 2018. Ecosystem services in urban plans: what is there, and what is still needed for better decisions. Land Use Policy. 70:298–312. doi: 10.1016/j.landusepol.2017.10.017.
- Curry N. 1994. Countryside recreation, access and land use planning. Taylor & Francis. doi: 10.4324/9780203992807.
- Curry N, Pack C. 1993. Planning on presumption: strategic planning for countryside recreation in England and Wales. Land Use Policy. 10(2):140–150. doi: 10.1016/0264-8377(93)90005-U.
- Cusens J, Barraclough AMD, Måren IE. 2022. Participatory mapping reveals biocultural and nature values in the shared landscape of a Nordic UNESCO biosphere reserve. People Nat. 4(2):365–381. doi: 10.1002/pan3.10287.
- Czepkiewicz M, Jankowski P, Młodkowski M. 2017. Geo-questionnaires in urban planning: Recruitment methods, participant engagement, and data quality. Cartogr Geogr Inf Sci. 44(6):551–567. doi: 10.1080/15230406.2016.1230520.
- Defra, D. for E., Food and Rural Affairs. 2023a. Environmental improvement Plan 2023 first revision of the 25 year Environment Plan. HM Goverment.
- Defra, D. for E., Food and Rural Affairs. 2023b. Get funding for farming in protected landscapes. GOV.UK. https://www.gov.uk/guidance/funding-for-farmers-in-protected-landscapes.
- Eigenbrod F, Anderson BJ, Armsworth PR, Heinemeyer A, Jackson SF, Parnell M, Thomas CD, Gaston KJ. 2009. Ecosystem service benefits of contrasting conservation strategies in a human-dominated region. Proc R Soc B. 276(1669):2903–2911. doi: 10.1098/rspb.2009.0528.
- Escobedo FJ, Bottin M, Clerici N, Camargo SG, Feged-Rivadeneira A. 2022. Evaluating the role of spatial landscape literacy in public participation processes and opinions on environmental issues and ecosystem services. Environ Manage. 69(2):244–257. doi: 10.1007/s00267-021-01591-7.
- Fagerholm N, García-Martín M, Torralba M, Bieling C, Plieninger T. 2022. Public participation geographical information systems (PPGIS): participatory research methods for sustainability ‐ toolkit #1. GAIA - Ecol Perspect Sci Soc. 31(1):46–48. doi: 10.14512/gaia.31.1.10.
- Fagerholm N, Käyhkö N, Ndumbaro F, Khamis M. 2012. Community stakeholders’ knowledge in landscape assessments – mapping indicators for landscape services. Ecol Indic. 18:421–433. doi: 10.1016/j.ecolind.2011.12.004.
- Fagerholm N, Martín‐López B, Torralba M, Oteros‐Rozas E, Lechner AM, Bieling C, Olafsson AS, Albert C, Raymond CM, Garcia‐Martin M, et al. 2020. Perceived contributions of multifunctional landscapes to human well-being: evidence from 13 European sites. People Nat. 2(1):217–234. doi: 10.1002/pan3.10067.
- Fagerholm N, Raymond CM, Olafsson AS, Brown G, Rinne T, Hasanzadeh K, Broberg A, Kyttä M. 2021. A methodological framework for analysis of participatory mapping data in research, planning, and management. Int J Geogr Inf Sci. 35(9):1848–1875. doi: 10.1080/13658816.2020.1869747.
- Fagerholm N, Torralba M, Moreno G, Girardello M, Herzog F, Aviron S, Burgess P, Crous-Duran J, Ferreiro-Domínguez N, Graves A, et al. 2019. Cross-site analysis of perceived ecosystem service benefits in multifunctional landscapes. Glob Environ Chan. 56:134–147. doi: 10.1016/j.gloenvcha.2019.04.002.
- Ferguson MJ, Munton RJC. 1979. Informal Recreation Sites in London’s Green Belt. Area. 11(3):196–205.
- Filyushkina A, Komossa F, Metzger MJ, Verburg PH. 2022. Multifunctionality of a peri-urban landscape: exploring the diversity of residents’ perceptions and preferences. Ecosyst People. 18(1):583–597. doi: 10.1080/26395916.2022.2131911.
- Gallent N, Shoard M, Andersson J, Oades R, Tudor C. 2004. Inspiring England’s urban fringes: multi-functionality and planning. Local Environ. 9(3):217–233. doi: 10.1080/1354983042000219342.
- Gant R, Robinson G, Fazal S. 2011. Land-use change in the ‘edgelands’: policies and pressures in London’s rural–urban fringe. Land Use Policy. 28(1):266–279. doi: 10.1016/j.landusepol.2010.06.007.
- García-Díez V, García-Llorente M, González JA. 2020. Participatory mapping of cultural ecosystem services in Madrid: insights for landscape planning. Land. 9(8):Article 8. doi: 10.3390/land9080244.
- Garcia-Martin M, Fagerholm N, Bieling C, Gounaridis D, Kizos T, Printsmann A, Müller M, Lieskovský J, Plieninger T. 2017. Participatory mapping of landscape values in a pan-European perspective. Landsc Ecol. 32(11):2133–2150. doi: 10.1007/s10980-017-0531-x.
- Gottwald S, Albert C, Fagerholm N. 2022. Combining sense of place theory with the ecosystem services concept: empirical insights and reflections from a participatory mapping study. Landsc Ecol. 37(2):633–655. doi: 10.1007/s10980-021-01362-z.
- Greater Manchester Walking. 2022. GM ringway—route overview. https://gmwalking.co.uk/walking-routes/gm-ringway-route-overview/.
- Greenbelt Foundation. 2020. Learn how the Greenbelt Foundation enhances the natural systems across Ontario’s Greenbelt. Greenbelt Foundation. https://www.greenbelt.ca/natural_systems.
- Greenbelt Foundation. (2021). The Greenbelt value of nature survey for recreation in the Greater Golden Horseshoe (Working paper series greenbelt foundation). Greenbelt Foundation. https://www.greenbelt.ca/value_of_nature
- Haines-Young R, Potschin-Young M. 2018. Revision of the Common international Classification for ecosystem services (CICES V5.1): a policy brief. One Ecosyst. 3:e27108. doi: 10.3897/oneeco.3.e27108.
- Harrison C. 1981. A playground for whom? Informal recreation in London’s Green Belt. Area. 13(2):109–114.
- Harrison C. 1983. Countryside recreation and London’s urban fringe. Trans Inst Br Geogr. 8(3):295–313. doi: 10.2307/622046.
- Hartig T, Mitchell R, de Vries S, Frumkin H. 2014. Nature and health. Annu Rev Public Health. 35(1):207–228. doi: 10.1146/annurev-publhealth-032013-182443.
- Hasanzadeh K. 2022. Use of participatory mapping approaches for activity space studies: a brief overview of pros and cons. GeoJournal. 87(4):723–738. doi: 10.1007/s10708-021-10489-0.
- Hedblom M, Andersson E, Borgström S. 2017. Flexible land-use and undefined governance: from threats to potentials in peri-urban landscape planning. Land Use Policy. 63:523–527. doi: 10.1016/j.landusepol.2017.02.022.
- House of Lords, L. U. in E. C. (2022). Making the most out of England’s land (HL Paper 105; Report of Session 2022–23). Land Use in England Committee.
- Kahila-Tani M, Broberg A, Kyttä M, Tyger T. 2016. Let the Citizens map—public participation GIS as a planning support System in the Helsinki master Plan process. Plann Pract Res. 31(2):195–214. doi: 10.1080/02697459.2015.1104203.
- Kahila-Tani M, Kytta M, Geertman S. 2019. Does mapping improve public participation? Exploring the pros and cons of using public participation GIS in urban planning practices. Landsc Urban Plan. 186:45–55. doi: 10.1016/j.landurbplan.2019.02.019.
- Kirby MG, Scott AJ. 2023. Multifunctional Green Belts: a planning policy assessment of Green Belts wider functions in England. Land Use Policy. 132:106799. doi: 10.1016/j.landusepol.2023.106799.
- Kirby MG, Scott AJ, Luger J, Walsh CL. 2023. Beyond growth management: a review of the wider functions and effects of urban growth management policies. Landsc Urban Plan. 230:104635. doi: 10.1016/j.landurbplan.2022.104635.
- Kirsop-Taylor N. 2022. Leaping forwards, bouncing forwards, or just bouncing back: resilience in environmental public Agencies through after the austerity decade. Environ Manage. 70(5):697–709. doi: 10.1007/s00267-022-01701-z.
- Long Y, Han H, Tu Y, Shu X. 2015. Evaluating the effectiveness of urban growth boundaries using human mobility and activity records. Cities. 46:76–84. doi: 10.1016/j.cities.2015.05.001.
- Macdonald S, Monstadt J, Friendly A. 2021. Rethinking the governance and planning of a new generation of greenbelts. Reg Stud. 55(5):804–817. doi: 10.1080/00343404.2020.1747608.
- Mace A. 2018. The Metropolitan Green Belt, changing an institution. Prog Plann. 121:1–28. doi: 10.1016/j.progress.2017.01.001.
- Maund PR, Irvine KN, Dallimer M, Fish R, Austen GE, Davies ZG. 2020. Do ecosystem service frameworks represent people’s values? Ecosyst Serv. 46:101221. doi: 10.1016/j.ecoser.2020.101221.
- Mell I. 2021. ‘But who’s going to pay for it?’ contemporary approaches to green infrastructure financing, development and governance in London, UK. J Environ Pol Plan. 1–18. doi: 10.1080/1523908X.2021.1931064.
- Mell I, Whitten M. 2021. Access to nature in a post covid-19 world: opportunities for Green infrastructure financing, distribution and equitability in urban planning. Int J Env Res Pub He. 18(4):Article 4. doi: 10.3390/ijerph18041527.
- MHCLG. 2021. National planning policy framework. London: Ministry of Housing Communities and Local Government.
- Millennium Ecosystem Assessment (Program) (Ed.). 2005. Ecosystems and human well-being. Washington (DC): Island Press.
- Munton RJC, Taylor MJ (1981). Management expenditure on informal recreation sites in the London green belt. Management Expenditure on Informal Recreation Sites in the London Green Belt., No.5. https://www.cabdirect.org/cabdirect/abstract/19801869494.
- Newcastle City Council. (2023). North East community forest. https://www.newcastle.gov.uk/northeastcommunityforest.
- Nilsson K, Pauleit S, Bell S, Aalbers C, Sick Nielsen TA, editor. 2013. Peri-urban futures: scenarios and models for land use change in Europe. Berlin Heidelberg: Springer. doi: 10.1007/978-3-642-30529-0.
- Office for National Statistics. 2022. The rise of the UK warehouse and the “golden logistics triangle. Office for National Statistics. https://www.ons.gov.uk/businessindustryandtrade/business/activitysizeandlocation/articles/theriseoftheukwarehouseandthegoldenlogisticstriangle/2022-04-11.
- Office of the Deputy Prime Minister. 2001. Strategic gap and green wedge policies in structure plans: main report. Office of the Deputy Prime Minister.
- Plieninger T, Dijks S, Oteros-Rozas E, Bieling C. 2013. Assessing, mapping, and quantifying cultural ecosystem services at community level. Land Use Policy. 33:118–129. doi: 10.1016/j.landusepol.2012.12.013.
- Plieninger T, Torralba M, Hartel T, Fagerholm N. 2019. Perceived ecosystem services synergies, trade-offs, and bundles in European high nature value farming landscapes. Landsc Ecol. 34(7):1565–1581. doi: 10.1007/s10980-019-00775-1.
- Pourtaherian P, Jaeger JAG. 2022. How effective are greenbelts at mitigating urban sprawl? A comparative study of 60 European cities. Landsc Urban Plan. 227:104532. doi: 10.1016/j.landurbplan.2022.104532.
- Rotherham ID. 2015. The rise and Fall of countryside management: a historical account. Routledge. doi: 10.4324/9780203754214.
- Rust NA, Rehackova L, Naab F, Abrams A, Hughes C, Merkle BG, Clark B, Tindale S. 2021. What does the UK public want farmland to look like? Land Use Policy. 106:105445. doi: 10.1016/j.landusepol.2021.105445.
- Scott A, Carter C, Reed MR, Larkham P, Adams D, Morton N, Waters R, Collier D, Crean C, Curzon R, et al. 2013. Disintegrated development at the rural–urban fringe: re-connecting spatial planning theory and practice. Prog Plann. 83:1–52. doi: 10.1016/j.progress.2012.09.001.
- Scott A, Christie M, Tench H. 2003. Visitor payback: panacea or pandora’s box for conservation in the UK? J Environ Plan Manag. 46(4):583–604. doi: 10.1080/0964056032000133170.
- Shaw BJ, van Vliet J, Verburg PH. 2020. The peri-urbanization of Europe: a systematic review of a multifaceted process. Landsc Urban Plan. 196:103733. doi: 10.1016/j.landurbplan.2019.103733.
- Silverman BW. 1986. Density estimation for statistics and data analysis. Chapman and Hall.
- Spyra M, Kleemann J, Calò NC, Schürmann A, Fürst C. 2021. Protection of peri-urban open spaces at the level of regional policy-making: examples from six European regions. Land Use Policy. 107:105480. doi: 10.1016/j.landusepol.2021.105480.
- Tan R, Liu P, Zhou K, He Q. 2022. Evaluating the effectiveness of development-limiting boundary control policy: spatial difference-in-difference analysis. Land Use Policy. 120:106229. doi: 10.1016/j.landusepol.2022.106229.
- Thrift J. 2022. Solutions hiding in plain sight—the potential of England’s green belts. Town Country Planning. 164–173.
- Vejre H, Jensen FS, Thorsen BJ. 2010. Demonstrating the importance of intangible ecosystem services from peri-urban landscapes. Ecol Complex. 7(3):338–348. doi: 10.1016/j.ecocom.2009.09.005.
- Venter ZS, Barton DN, Gundersen V, Figari H, Nowell M. 2020. Urban nature in a time of crisis: recreational use of green space increases during the COVID-19 outbreak in Oslo, Norway. Environ Res Lett. 15(10):104075. doi: 10.1088/1748-9326/abb396.
- Walsh CL, Glendinning S, Dawson RJ, O’Brien P, Heidrich O, Rogers CDF, Bryson JR, Purnell P. 2022. A systems framework for infrastructure business models for resilient and sustainable urban areas. Front Sustain Cities. 4. doi: 10.3389/frsc.2022.825801.
- Weitowitz DC, Panter C, Hoskin R, Liley D. 2019. The effect of urban development on visitor numbers to nearby protected nature conservation sites. J Urban Ecol. 5(1):juz019. doi: 10.1093/jue/juz019.
- Zhao W, Wang Y, Chen D, Wang L, Tang X. 2021. Exploring the influencing factors of the recreational Utilization and evaluation of urban ecological Protection Green Belts for urban renewal: a case study in Shanghai. Int J Env Res Pub He. 18(19):Article 19. doi: 10.3390/ijerph181910244.
- Žlender V, Ward Thompson C. 2017. Accessibility and use of peri-urban green space for inner-city dwellers: a comparative study. Landsc Urban Plan. 165:193–205. doi: 10.1016/j.landurbplan.2016.06.011.
- Zolyomi A, Franklin A, Smith B, Soliev I. 2023. Ecosystem services as the silver bullet? A systematic review of how ecosystem services assessments impact biodiversity prioritisation in policy. Earth Sys Govern. 16:100178. doi: 10.1016/j.esg.2023.100178.
- Zu Ermgassen SOSE, Marsh S, Ryland K, Church E, Marsh R, Bull JW. 2021. Exploring the ecological outcomes of mandatory biodiversity net gain using evidence from early-adopter jurisdictions in England. Conserv Lett. 14(6):e12820. doi: 10.1111/conl.12820.