
ABSTRACT
Intensification of agricultural land use in traditional Andean production landscapes has led to changes in the provision of nature’s contributions to people (NCP) that can threaten people’s wellbeing. Understanding local stakeholders’ valuation of these NCP is crucial for improving land use decisions. We implemented a spatially explicit and participatory NCP valuation method, using semi-structured interviews and participatory mapping, followed by a spatial multi-criteria decision analysis, to identify priority areas for NCP provision in a highly intensified production landscape in the Colombian Andes. We considered multiple value types, ecological, economical and sociocultural, and the points of view of different actors, orienting this towards decision-making on land use. Our results show that local actors can identify and value a wide range of NCP. However, there are also significant differences between actors. Environmentalists attached special importance to regulating NCP, while agricultural laborers focused more on agriculture-related material NCP. As we expected, tourism entrepreneurs especially valued non-material NCP related to their business experiences. Small-scale farmers tended to put more importance on regulating and non-material NCP than big farmers did. Although there was a consensus between actors as to the importance of natural ecosystems for NCP provision, agricultural actors tended to attach more importance to material NCP in areas deemed important for regulating and non-material NCP by other actors. Our main results confirm the importance of involving different stakeholders in spatial NCP valuation exercises, recognizing their different points of view to help identify possible trade-offs and synergies related to land use.
EDITED BY:
Introduction
Ecosystem services, or the benefits that people obtain from the natural world, are vital for the wellbeing of people around the globe (MEA Citation2005). The Intergovernmental Science-Policy Platform on Biodiversity and Ecosystem Services (IPBES) adopted the term nature’s contributions to people (NCP) in relation to these benefits (Díaz et al. Citation2018). These NCP and the wellbeing they create are the result of different types of co-production, combining natural and human capital (Bruley et al. Citation2021). In fact, for the purpose of obtaining the NCP needed for their wellbeing, communities around the globe have intervened in their surroundings, creating mosaics of natural habitats and more production-oriented land uses, dubbed socio-ecological production landscapes (SEPLs) (Gu and Subramanian Citation2014). Where traditionally these SEPLs balanced biodiversity conservation and production (UNU-IAS et al. Citation2014), the continuing world-wide unsustainable intensification and expansion of agricultural production has led to dramatic changes in land use, at the expense of natural ecosystems and the biodiversity they harbor (Foley et al. Citation2005; Newbold et al. Citation2016; IPBES Citation2019).
This process of landscape transformation is a global phenomenon, which has led to a homogenous global production ecosystem, driven by the need to feed a growing world population, and aimed at satisfying the need for harvestable biomass in the short term (Nyström et al. Citation2019). The disadvantages of this transformation process are becoming more and more apparent, culminating in the IPBES’s stark warning that up to 75% of the planet’s land surface has already been modified by human action (Ellis and Ramankutty Citation2008). As a result, up to one million species worldwide may now face the risk of extinction (IPBES Citation2019), and the world appears to be headed for a sixth mass extinction (Bradshaw et al. Citation2021). Loss, but especially fragmentation of natural habitats, increases this risk, especially in the tropics (Betts et al. Citation2019), generating important questions about the implications for human wellbeing in tropical regions impacted by these changes. In fact, these changes already have profound impacts on the provision of vital NCP, endangering the long-term provision of regulating and non-material benefits by natural ecosystems, while prioritizing the short-term provision of material benefits linked to agricultural production (Foley et al. Citation2005; MEA Citation2005; IPBES Citation2019). Land use decisions, therefore, are of vital importance, because of their potential to transform landscapes, impacting NCP provision, and ultimately, our wellbeing. These land use decisions, implicitly or explicitly, entail the valuation of NCP.
Although ecosystem services valuation has been receiving increased attention in recent years, the field continues to be plagued by fundamental concerns (Chan and Satterfield Citation2020), with ecosystem services continuing to be poorly quantified in many cases (Boerema et al. Citation2017). In spite of the fact that the integral valuation of ecosystem services, considering ecological, economical and sociocultural values, has been gaining traction (Jacobs et al. Citation2016) and the IPBES explicitly stresses the importance of a pluralistic valuation of NCP in decision-making (Pascual et al. Citation2017), many NCP valuations remain focused on the economic aspect (Torres et al. Citation2021). Moreover, the spatially explicit valuation of NCP is important for decision makers (Tallis and Polasky Citation2009), given the spatial heterogeneity of biophysical and socioeconomic conditions that influence NCP supply and demand (Schägner et al. Citation2013). Nevertheless, inconsistency remains in methods used to quantify and map NCP (Crossman et al. Citation2013), there is no clear consensus on what methods are best (Ochoa and Urbina-Cardona Citation2017), and there are no definite guidelines on how to proceed with the mapping of NCP in a specific context (Brown and Fagerholm Citation2015). NCP valuations and maps are frequently produced without the participation of relevant stakeholders (Nahuelhual et al. Citation2015; Boerema et al. Citation2017), even though this participation is important for improving the salience, credibility and legitimacy of maps produced, as is the inclusion of different points of view (Hauck et al. Citation2013; Wright et al. Citation2017). Many NCP valuations are also limited in the number of NCP they consider (Boerema et al. Citation2017; Ochoa and Urbina-Cardona Citation2017), and there is a clear geographical bias (Ochoa and Urbina-Cardona Citation2017), with few studies being conducted in regions like Latin America (Crossman et al. Citation2013).
We aimed to address these shortcomings in our study, using a spatially explicit and participatory NCP valuation method that can be used in data scarce areas, with the goal of identifying priority areas for NCP provision in a SEPL in the Colombian Andes subject to intensifying agricultural production, considering multiple value types, and the points of view of different stakeholders, orienting this towards decision-making on land use. Our main findings confirm the importance of involving different stakeholders in spatial NCP valuation exercises, recognizing their different points of view to help identify possible synergies and trade-offs related to preferred land use, reducing the risk of conflicts between actors, especially in SEPLs subject to a strong dynamic of transformation.
Materials and methods
Study area
Aquitania is a municipality in Colombia’s Boyacá department and is located within the watershed of Lake Tota, Colombia’s largest freshwater lake, and a source of drinking water for some 20% of Boyacá’s population (Conpes Citation2014). The municipality had a population of 15,546 in 2020, 38.7% of which lives in the town of Aquitania itself, while the remaining 61.3% lives dispersed over the municipality’s 16 rural veredas (villages and hamlets) (Alcaldía de Aquitania Citation2020). Aquitania’s economy used to be dominated by small-scale farmers growing wheat, barley, potatoes and broad beans, and tending cattle and sheep at subsistence level (Raymond Citation1990). This traditional SEPL changed drastically with the introduction of large-scale commercial spring onion production in the mid-1960s. Nowadays, this crop is cultivated annually on 3,800 ha, about 9.3% of the municipality’s arable land, reaching a production of 100,750 tons. Spring onion production has greatly improved the economic situation of much of Aquitania’s population, making up 70% of the municipality’s economy, and providing employment to the majority of people (Alcaldía de Aquitania Citation2020). Nevertheless, the transition from a traditional, subsistence oriented SEPL to one dominated by intensive, commercial agriculture, has caused a number of environmental problems. The indiscriminate use of agrochemicals causes pesticide runoff to rivers and streams, and eventually the lake (Mojica and Guerrero Citation2013). With the expansion of onion production, cattle grazing has moved to higher areas, causing an expansion of the agricultural frontier into the high mountain ecosystem of the páramo (highly biodiverse Andean moorlands above the tree line that play a key role in the water cycle), damaging native vegetation and reducing water flow to the lake (Alcaldía de Aquitania Citation2020).
We focused our study on the vereda of Suse, a rural area with a disperse population in the west of Aquitania, on the southern shore of Lake Tota, that is home to about 10% of Aquitania’s population (Alcaldía de Aquitania Citation2016) and covers some 10,953 ha, about 11.6% of the municipality’s total land area. We chose this area because it still conserves many aspects of Aquitania’s traditional SEPL, with small-scale farmers dedicated to the production of a variety of crops and livestock (Raymond Citation1990). However, Suse is subject to a process of change, in which farmers move more and more towards the commercial production of spring onion. For reasons of practicality (being able to work with maps of a manageable size and scale), about half of the vereda’s territory (5,889 ha) was included in our study. This area included an altitudinal gradient from Lake Tota at 3,015 m above sea level, to the páramo at more than 4,000 m, and covered the entire populated part of the vereda (). Included in this area was a patchwork of agricultural areas (onion, more traditional crops, and meadows) and natural areas (the lake, the páramo and patches of remnant forest) (). The study area also included various rivers and streams, the most important of which are the Olarte river and the Upía river, this last being the main drainage of the lake ().
Figure 1. The study area.
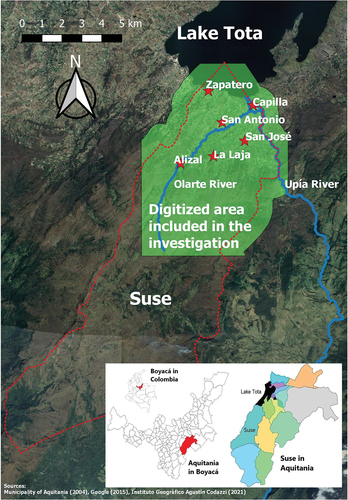
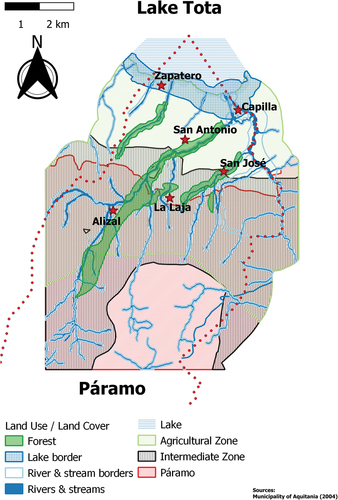
Figure 2. Map of the study area’s land use/land cover, as identified by study participants.
Data collection and analysis
We used a methodology made up of two different steps: (1) semi-structured interviews and participatory mapping to identify NCP, their importance, and associated values in Suse, and (2) a spatial multi-criteria decision analysis (MCDA) to identify priority areas for NCP provision. During this second phase, we held two workshops: (i) one to obtain the relative weights that people attached to four factors determining the importance of different parts of the territory for the provision of the NCP identified, and (ii) a final session to discuss this importance and preferred land use.
Semi-structured interviews followed the design proposed by Díaz-Bravo et al. (Citation2013) and were performed in the field between March and June 2018. The interview guide used is available as Supplementary Material S1. A total of 24 interviews were held with 26 people: big onion producers (3), small-scale farmers (9), agricultural laborers (3), tourism entrepreneurs (5), decision makers (2) and environmentalists (4). We chose these actors because they represent the most important parts of the local economy, and because they have a direct influence on land use, either through direct use, or because of their role in land use planning. In order not to influence participants’ responses, we did not use the terms ‘ecosystem services’ and ‘nature’s contributions to people’, nor did we present interviewees with examples or a pre-defined list of NCP. We wanted people to describe, in their own words, what ‘products, services, experiences, advantages, or other benefits’ they ‘obtain from specific sites or areas’, or which they ‘consider coming from those sites or areas’ in Suse (inspired by Roldán Ortiz Citation2004). We also did not provide people with any spatial definitions of the terms ‘site’ or ‘area’, as we wanted participants to be able to freely draw points, lines and polygons representing NCP, as they saw fit. We invited participants to mark these points, lines and polygons representing NCP on a map, printed at a scale of 1:10,000. For each NCP marked on the map, we asked people to specify how important they considered it to be, using a Likert scale from 1 (‘very little important’) to 5 (‘extremely important’). Based on their appreciation of why an NCP was important, we assigned it either an economical, an ecological, or a sociocultural value, or a combination of these. We partially transcribed interviews and georeferenced and digitized maps using a geographic information system (GIS), creating polygons for each unique NCP-land cover combination with importance and value types attached to them. Line elements, the majority of these associated with rivers and streams, were digitized as linear-shaped polygons with a width of 2 m. However, NCP-land cover combinations mapped as points were excluded from the digitization. This was decided because it became clear during the interviews that there was a high probability of error associated with participants mapping NCP as points.
We used the information generated in the first part of the study in a spatially explicit MCDA aimed at identifying where in Suse are the priority areas for the provision of the NCP identified. This study used multi-criteria evaluation (MCE) (Eastman et al. Citation1995) to evaluate four pre-defined factors, following the steps identified by Estoque (Citation2011). These were:
Number of NCP overlapping: a location on the map was deemed more important for NCP provision when it had more NCP assigned to it.
Number of different actors that recognized an NCP: a location on the map was deemed more important for NCP provision when more different actor types recognized the NCP assigned to it.
Number of different value types associated with an NCP: a location on the map was deemed more important for NCP provision when the NCP assigned to it had more different value types (economical, ecological and/or sociocultural) associated with it.
The importance of an NCP: a location on the map was deemed more important for NCP provision when the NCP assigned to it was given a higher importance.
We standardized these factors, converting the vector GIS data generated in the first part of the study into four raster representing the factors, with a resolution of 3 × 3 m, and cells assuming values between 0 and 1. All spatial analyses were performed using R Programing Language (R Core Team Citation2015), with code adapted from Mecum (Citation2014), Whitehead (Citation2014), and Restrepo Calle (Citation2019).
We presented and discussed these four factors during a workshop in Suse on the 27th of January 2019. 21 people participated in this workshop, 12 of whom had previously participated in the interviews and mapping. We divided these participants in groups, according to the six different actor types. Each group then assigned a relative weight to each factor, using a simplified version of the Analytic Hierarchy Process (AHP) (Saaty Citation1987). Group members compared each of the four factors to every other factor and decided which one they considered more important. Once they had reached consensus, they then decided how much more important they considered this factor to be over the other, using a Likert scale of 1 (‘the factor is only slightly more important than the other factor’) to 5 (‘the factor is extremely more important than the other factor’). Relative weights for each factor according to each actor type were obtained by normalizing the scores assigned.
We then fed these weights into a weighted linear combination (Eastman et al. Citation1995; Estoque Citation2011), producing raster maps showing the importance of the different parts of Suse for the provision of NCP. We validated and discussed the resulting maps with participants during a second workshop on the 24th of February 2019. During this workshop, in which eight people participated, participants were invited to draw a map of preferred land use for Suse. Although not formally part of the MCDA, we wanted to know how participants would use the study outcomes when considering land use decisions.
The methodology used in this study, including the script and interview guide, was approved by two evaluators before the start of the research. All personal information of human research participants was kept strictly private, and results of the investigation were presented in an anonymized, aggregated manner, where none of these results could be attributed to individual research participants. Research participants were informed of this, and the purpose of the investigation, prior to their participation in the study. All human research participants provided informed verbal consent before taking part in the study, as detailed in the script and interview guide used in the research (Supplementary Material S1). Audio recordings of this have been stored by the researchers.
Results
In this section, we first give an overview of the NCP identified by the different actors involved in our study. We then focus on the differences that exist between different actors. We will also show how the valuation of these NCP changes across different land cover types. Lastly, we present how this participatory, spatial valuation of Suse’s NCP, involving the points of view of different actors, helped to identify priority areas for NCP provision, and how that links to actual and preferred land use.
Nature’s contributions to people in Suse, Aquitania
During the semi-structured interviews and participatory mapping participants mapped a total of 323 polygons (or lines later digitized as polygons), representing an average of 12.4 per participant. These polygons represented 32 distinct NCP. These NCP were evenly distributed over the IPBES’s three NCP groups, with 11 being material NCP, 11 non-material NCP and 10 regulating NCP, falling within 16 of the IPBES’s 18 reporting categories. The only categories in which no NCP were identified were ‘regulation of ocean acidification’ and ‘regulation of organisms detrimental to humans’. Water, as a material NCP apart from the regulating NCP of ‘water flow regulation’, was recognized to be of primary importance throughout most of the territory by all different actors and was, for that reason, included in this study in a category of its own. gives an overview of the NCP that were identified in this study, while shows the number of distinct NCP recognized by each actor. The map in Supplementary Material S2 gives an impression of overall mapping density.
Figure 3. Number of nature’s contributions to people (NCP) identified by each actor.
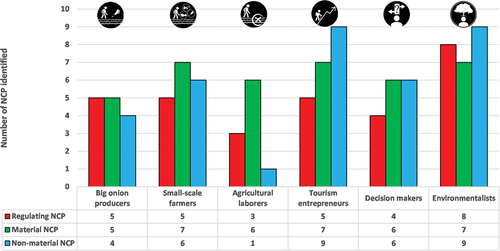
Table 1. Nature’s contributions to people (NCP) identified by different actors in Suse, Aquitania.
Differences between actors
One important finding of our study was, that different actors tended to focus on different (groups of) NCP, differing in the number of NCP they recognized in certain groups. Also, they differed in the importance and/or value types they attributed to them.
The presence of environmentalists in Suse is due to the importance of Lake Tota and its watershed, in the defense of which various local and regional environmental organizations are involved. This actor recognized the largest number of regulating NCP, and attached a high importance to these, with average importance over the entire territory not being lower than 4.0 (‘very important’) for any individual NCP. This actor also recognized regulating NCP not recognized by any of the other actors, such as ‘flood and drought mitigation’ and ‘CO2 sequestration’ (). This last one was deemed important not only for Suse: ‘There are (…) national benefits, even global ones, because they play a role in mitigating climate change (…). These services have no borders’ (environmentalist, ♂, 51, 7 May 2018). also shows that environmentalists and decision makers, more often than other actors, attributed an ecological value to the NCP they identified, with environmentalists and decision makers assigning this value to 11 (45.8% of the total number recognized by this actor) and 9 (56.3%) distinct NCP, respectively, mostly in the regulating and non-material groups.
Figure 4. Importance and values associated with NCP according to different actors.
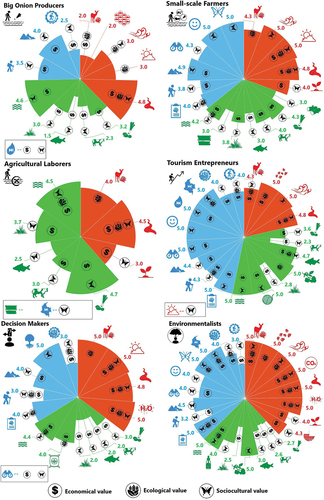
In contrast, the actor recognizing the least amount of NCP were agricultural laborers. These play an important role in Aquitania’s agricultural economy, attracted by the high rural wages. The agricultural laborers working in Aquitania’s onion fields typically do not have land of their own, or at best, have access to a small garden around their house. As can be seen in , this actor focused strongly on material NCP, especially those associated with agricultural production, to which they assigned economical and sociocultural value, and where especially ‘crops’ were assigned a very high average importance over the entire territory (4.7): ‘Agriculture benefits us a lot, of course!’ (agricultural laborer, ♂, 35, 6 May 2018). Striking is the near absence of non-material NCP among those identified by agricultural laborers, as compared to other actors, that all recognized the non-material group as an important part of Suse’s NCP.
An actor that did show a special focus on the non-material NCP were the tourism entrepreneurs. Tourism, because of the scenic beauty of Lake Tota and its watershed, is an important economic activity in Aquitania. Suse’s tourism entrepreneurs were the ones that recognized the largest number of non-material NCP (together with the environmentalists) (), and they seemed to attach a slightly higher importance to this group of NCP than other actors, with none being assigned an average importance across the territory of less than 4.0 (‘very important’). What can also be gleaned from , is that the tourism entrepreneurs were among the actors that most frequently assigned an economical value to non-material NCP (7 distinct non-material NCP, 77.8% of the total number recognized by this actor in that group): ‘It is true that it is an economic potential [tourism in the páramo], for health also’ (tourism entrepreneur, ♂, 53, 13 June 2018).
Finally, farmers still make up the bulk of Suse’s population. Almost all of these are small-scale farmers, that grow a variety of crops on small land holdings, particularly potatoes, broad beans, and the in Aquitania ubiquitous spring onions. Many augment this by raising animals. With the intensification of agricultural production in Suse, which goes hand in hand with the expansion of onion production, the influence of big onion producers in the territory grows. These individuals devote relatively large land holdings to the exclusive production of spring onions. Many of them don’t live in Suse, but in the Aquitania town center, or even the provincial capital Sogamoso. It is interesting to note that big onion producers seemed to recognize less NCP during interviews and mapping than small-scale farmers did, especially in the material and non-material groups. And, although they recognized the same number, and similar, regulating NCP as small-scale farmers, big onion producers attached less importance to these than not only did small-scale farmers but also most other actors (). Finally, in it can be seen that small-scale farmers more often associated a sociocultural value with the NCP they identified than big onion producers did (17 distinct NCP, or 94.4% of the total recognized by this actor, versus 11 distinct NCP, or 78.6%). In interviews, small-scale farmers often expressed strong feelings about their territory: ‘The páramo (…) sustains life’ (small-scale farmer, ♂, 24, 6 March 2018), ‘A lot of beauty (…) in every way, very special to have a lake like this’ (small-scale farmer, ♀, 59, 14 March 2018), ‘It’s like a treasure. It is a wonderful thing to see one of these animals [deer]’ (small-scale farmer, ♂, 66, 8 March 2018).
Spatial differences
Another important finding of our study was, that NCP, with their associated values and importance, were not evenly distributed throughout the territory. Actors assigned these to different land cover types that they themselves described and delineated on the map during the semi-structured interviews and participatory mapping. and show the different land cover types identified by the study participants.
Table 2. Land cover types identified by different actors in Suse, Aquitania.
What stood out, was the importance that actors attached to natural ecosystems with a lower level of human intervention, especially the high mountain páramo, and Lake Tota, that had the highest number of NCP associated with them (). The páramo was associated with a large number of regulating and non-material NCP, and Lake Tota was deemed important especially for its non-material NCP. The NCP related to these land cover types also more frequently had ecological values associated with them than land cover types with more human intervention. Although actors recognized the presence of productive activities in these land cover types, like trout farming in Lake Tota, and crop production and animal husbandry in the páramo, the material NCP associated with these activities were deemed of lesser importance than the regulating and non-material NCP in these land cover types (). These production-related material NCP took on a much higher importance in the agricultural zone, that also turned out to be important for non-material NCP. Of note is the near absence of regulating NCP and of ecological values in the agricultural zone (). Between the agricultural zone, and the páramo, many actors identified an intermediate zone, that was given different names and descriptions during the interviews (), being variedly described as a buffer zone between agriculture and páramo, or as a zone where the agricultural frontier is expanding into the páramo. Although agricultural production-related material NCP in this zone were assigned a lower importance than these same NCP in the agricultural zone, their importance was still higher than in the páramo. Of note is that small-scale farmers and agricultural laborers did not recognize this zone during interviews, extending the agricultural zone right up to the edge of the páramo.
Figure 5. Number of nature’s contributions to people (NCP) identified in different land cover types.
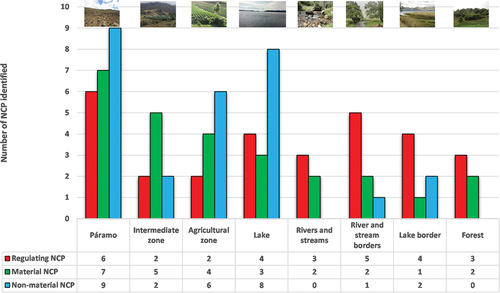
Figure 6. Importance and values associated with NCP in different land cover types.
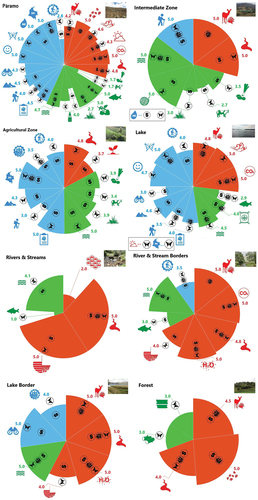
What also shows is the importance attached to buffer zones around Lake Tota and rivers and streams. These zones were identified as especially important for their regulating NCP. It must be noted however, that only decision makers and environmentalists specifically recognized this land cover type and its associated NCP. Of note is again that small-scale farmers and agricultural laborers did not mention these buffer zones at all and extended the agricultural zone right up to the edge of Lake Tota and the territory’s rivers and streams, a fact noted during interviews: ‘A high percentage of the streams here do not meet the requirement [of a 30-meter buffer zone]. (…) Easily 70–80% of the streams do not meet this minimum’ (environmentalist, ♂, 51, 7 May 2018).
NCP provision and land use
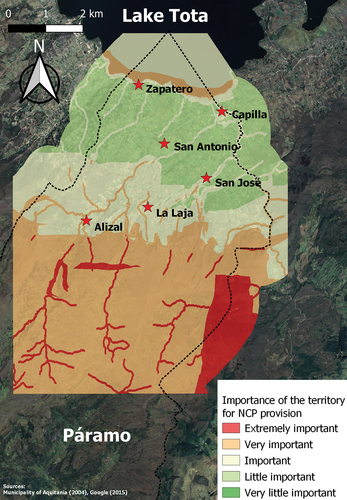
Despite the differences between actors, our study found a certain consensus among actors as to where the priority areas for NCP provision in Suse are. Based on the outcomes of the MCDA, it was possible to produce maps showing the importance of the territory for NCP provision. The map in shows the territory’s overall importance for the provision of all NCP identified by all different actors. From this map, the importance of the páramo for NCP provision once again becomes clear: this area was deemed ‘very important’ to ‘extremely important’ for NCP provision. That importance diminishes going downhill through the intermediate zone towards the agricultural zone. Lake Tota also stands out as important for NCP provision, as do the buffer zones around the lake and around Suse’s rivers and streams. As can be seen from the different maps in this viewer: https://rpubs.com/robertk/Suse_leaflet, despite variations in intensity and extent, these zones stand out as important for NCP provision across all of Suse’s different actors, with small-scale farmers and decision makers however attaching extreme importance to the largest extent of páramo. When only considering non-material NCP, the páramo and Lake Tota consistently stand out as ‘very’ or ‘extremely important’ for the provision of this NCP group across all actors.
Figure 7. Map of the territory’s importance for NCP provision.
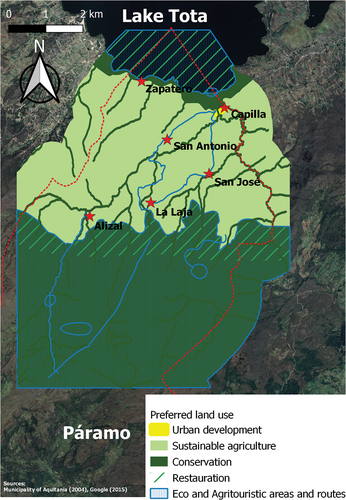
When participants were asked to draw a map of preferred land use, that map showed a land use that seemed well-adjusted to the areas identified as most important for NCP provision (). Participants assigned conservation and restauration-related land uses to the páramo, Lake Tota and the buffer zones around lake and rivers. Although the aforementioned areas enjoy formal protection in Suse, it must be mentioned that the actual land use in the territory often does not respect these areas and does not conform to the preferred land use map drawn in the workshop. This expansion of the agricultural frontier becomes apparent from the results of this study and was explicitly mentioned by several of the workshop participants.
Figure 8. Preferred land use in Suse.
Discussion
In our study, we used semi-structured interviews and participatory mapping, followed by an MCDA, to identify priority areas for the conservation of NCP in the SEPL of Suse, Aquitania, in the Colombian Andes. We did so, taking into account different value types, and considering the points of view of different actors in the territory. We also sought to orient this towards decision-making on land use.
Local stakeholders know their territory
The 32 NCP identified by the participants in our study indicate that local stakeholders know very well what their territory has to offer. This number exceeds, or rivals, the number of NCP recognized by local stakeholders in other studies that applied a participatory approach. In Spain for instance, Iniesta-Arandia et al. (Citation2014) found 25 NCP, while Oteros-Rozas et al. (Citation2014) identified 34. Cáceres et al. (Citation2015) found 22 in Argentina. And Leroy and Barrasa García (Citation2021) identified 13 NCP during a participatory study in Colombia and Venezuela. In 2017, experts identifying NCP related to wetland ecosystems in Colombia, that included páramos, lakes and rivers, also identified a total of 32 NCP (Ricaurte et al. Citation2017). Colombian wetlands, especially the páramos, because of the very high levels of biodiversity they support, tend to be important areas for NCP supply (Llambí et al. Citation2020; Diazgranados et al. Citation2021). Many of the NCP identified in the Ricaurte et al. (Citation2017) study were similar to the NCP recognized by the actors in Suse. We believe this adds to the evidence stressing the importance of involving local actors in NCP valuation studies, something also pointed out by other authors (Hauck et al. Citation2013; Nahuelhual et al. Citation2015; Wright et al. Citation2017).
Different perceptions
Our study also shows that the inclusion of different points of view is important in order to obtain information on the total palette of NCP and their associated values and importance, as do Masao et al. (Citation2022). The presence of an environmental movement in the Lake Tota watershed for instance proves important for enhancing NCP recognition, with environmentalists identifying more NCP than any other actor, focusing on regulating NCP. This is a result similar to that found in Canada by Darvill and Lindo (Citation2015), where environmentalists were among the actors that recognized the largest number of NCP, and to that found by Cáceres et al. (Citation2015) in Argentina, where ‘conservation agencies’ (and ‘policy makers’) tended to recognize a wide variety of NCP, while focusing on regulating services. García-Nieto et al. (Citation2015) point out that these actors with a high influence on the environmental decision-making process tend to have more technical knowledge, which may explain this focus on regulating NCP. Effectively, environmentalists and policy makers in Suse are among the actors with the highest levels of formal education. Interestingly, the actor with the lowest levels of formal education in Suse, the agricultural laborers, recognizes the lowest number of NCP, focusing strongly on agricultural production-related material NCP, neglecting regulating, and especially non-material NCP. This resonates with Elwell et al. (Citation2018), who found that those actors that make direct use of an NCP tend to give more importance to that NCP. It also points towards the importance of formal education in enhancing the recognition of (the importance of) NCP in a territory, something also stressed by Martín-López et al. (Citation2012) and Oteros-Rozas et al. (Citation2014). In the case of Suse, this means that involving agricultural laborers in environmental education initiatives may be important in raising awareness on the territory’s NCP, considering that this is an important and numerous actor in Aquitania’s commercial onion farming business. In fact, Masao et al. (Citation2022) found that stakeholders themselves identified education as an important action for conserving and restoring NCP.
Although agricultural laborers neglect Suse’s non-material NCP, it is encouraging to notice that most other actors in the territory recognize a large number of these and assign them high importance. As Plieninger et al. (Citation2013) mentioned, this NCP group tends to be irreplaceable, making their protection and conservation imperative. This is especially true in Aquitania, where the tourism industry, that strongly depends on this NCP group, is gaining importance, a fact recognized not only by the territory’s tourism entrepreneurs: ‘It seems that day by day, tourism is becoming more important than agriculture’ (big onion producer, ♂, 56, 5 May 2018). In that respect, it is interesting to notice that Leroy and Barrasa García (Citation2021), who also interviewed farmers in Aquitania, found very little recognition of non-material NCP, a result that is very different from what we found in our study, where especially small-scale farmers recognized the importance of the territory’s non-material NCP. We did find an important difference though between small-scale farmers and big onion producers, with the latter attaching less importance to regulating and non-material NCP than the former. This difference between small-scale and big farmers was also found by Cáceres et al. (Citation2015), who argued that this may be explained by the fact that big farmers, because of their greater access to external inputs, are less dependent on the territory’s NCP. This is an important finding that suggests that great care should be taken vis-à-vis the continuing intensification of large-scale onion farming in Suse, in order to avoid the loss of focus on especially regulating and non-material NCP, also given the fact that more traditional, multi-functional agricultural landscapes provide more NCP than intensive agricultural landscapes dominated by material NCP (García-Nieto et al. Citation2015). Felipe-Lucia et al. (Citation2022) also found that it is better to focus on land management scenarios that promote active ecological restoration, rather than on increasing the supply of material NCP, as these tend to supply more services and tend to benefit a larger range of societal sectors.
Spatial differences
These differences in perception between actors can also be seen in the spatial distribution of NCP, their values and importance. The most notable difference exists between actors that depend directly on agricultural land use (notably small-scale farmers and agricultural laborers) and those that do not. The former tend to draw a sharp line between the agricultural zone, with high importance for agriculture-related material NCP, and the páramo, that is far more important for regulating and non-material NCP (similar to that observed by Leroy and Barrasa García Citation2021), while the latter tend to recognize an ‘intermediate zone’ between the two, where functions mix. This is indicative of the expansion of the agricultural frontier into the páramo, where agricultural actors tend to extend the agricultural zone further uphill than decision makers do. This expansion of the agricultural frontier is also reflected in the non-recognition of the importance of lake and river borders for regulating NCP by these same agricultural actors. This trade-off between material NCP and regulating and non-material NCP is very common (Foley et al. Citation2005; Martín-López et al. Citation2012; García-Nieto et al. Citation2015; IPBES Citation2019), and constitutes an important difference in perception between those actors in Suse that make direct use of the land, and those that do not, with the first focusing more on material NCP in zones that are deemed important for regulating NCP by the latter. It is important to realize that, as Ellis et al. (Citation2019) note, this trade-off is mediated and determined by the power relationships between these actors, where institutional actors get to dictate the formal rules that govern land use.
Is conflict inevitable?
The aforementioned becomes apparent when reviewing the territory’s official land use and zoning plans. The Municipality of Aquitania’s Zoning Plan (Alcaldía de Aquitania Citation2004), as well as the Watershed Zoning and Management Plan for the Lake Tota watershed (Corpoboyacá & PUJ Citation2006) impose restrictions on agricultural activities in the borders around water bodies and in all areas roughly above 3,300 m above sea level. The official delimitation of the páramo complex of Tota-Bijagual-Mamapacha (IAvH Citation2017) even lowered that limit to 3,100 m above sea level. In the case of Suse, this means that the vast majority of territory is subject to some form of use restriction, including much of the populated part of the vereda. The potential for conflict between ‘environmental and local development professionals’ and ‘locals depending on provisioning ecosystem services’ identified by Iniesta-Arandia et al. (Citation2014), does lead to land use conflicts in Suse. During the workshops, participants belonging to the local community expressed their perception of being mostly on the receiving end of sanctions, instead of help and support, from institutional actors. At the same time, participants recognized that the economic realities of the territory not always match with preferred or allowed land use: ‘There are those that, because of the urgency of (…) obtaining economic security, food security, because of that urgency, they have more and more neglected conservation’ (tourism entrepreneur, ♂, 53, 27 January 2019).
Still, there is the potential for synergies, given the level of consensus between different actors in Suse as to what the priority areas for NCP provision are. The importance of more natural, less-intervened ecosystems like the páramo and the lake, especially when it comes to regulating and non-material NCP, is recognized by most actors. This importance of natural ecosystems for NCP provision is recognized in other studies as well (Cáceres et al. Citation2015; Clemente et al. Citation2015; Hashimoto et al. Citation2015; Angarita-Baéz et al. Citation2017; Ricaurte et al. Citation2017; Leroy and Barrasa García Citation2021), and offers opportunities for the protection and conservation of these areas, with a remarkable agreement between small-scale farmers and decision makers: ‘The páramo (…) is the zone that is 100% primordial for subsistence. If that zone is not conserved, there is nothing, we’ll destroy everything’ (small-scale farmer, ♂, 24, 6 March 2018), and: ‘I think that we always [have though] that here, nobody is interested in conservation any more, and that stigmatizes a little, because (…) there is a recognition on behalf of the locals of the importance that these ecosystems have’ (decision maker, ♀, 24 February 2019).
Limitations and future research directions
Although we believe that the results of our study are important to shed light on local stakeholders’ perceptions of the value of NCP as associated with different land use/land cover types, it is important to note some limitations of our findings. Our study constitutes a sociocultural assessment of Suse’s NCP, being based on local stakeholders’ perceptions of NCP values and distribution. However, in order to achieve a more robust understanding of the diverse NCP values in any given territory, it is important to combine these sociocultural, participatory data with biophysical and socioeconomic indicators associated with the territory and its people in future studies (Clemente et al. Citation2015), permitting a more complete, integrated NCP valuation (Jacobs et al. Citation2016). As such, the results of our study provide an important starting point for a better understanding of Suse’s NCP, providing important insights for decision-makers, but being a sociocultural assessment only, they should not be treated as an endpoint, as also pointed out by Ramirez-Gomez et al. (Citation2015).
It is also relevant to note that our study included only positive perceptions of NCP, ignoring negative perceptions that some local stakeholders may also have of certain NCP. These positive or negative perceptions depend heavily on context, point of view, past experiences, personal values, and culture. A farmer removing fertile soil from the páramo to use it on his or her field, may have a positive perception of this NCP. But this may not be the case for other actors: ‘There is a problem (…) that some onion producers go to the páramo, take black soil to bring it down, and obviously mix it as fertilizer in their cultivation process. What does that imply? Well, an impact on the páramo, because it constitutes a removal of the vegetation’ (decision-maker, ♀, 33, 3 May 2018). In order to achieve a better understanding of the full range of local stakeholders’ perceptions of NCP values, future studies would have to take into account these negative values of NCP as perceived by different sociocultural groups, as understanding this will be important to prevent or solve controversies in the land use decision-making process (Lyytimäki Citation2015).
Lastly, it is important to understand that our study limits itself to mapping stakeholders’ perceptions of NCP values onto land use/land cover. As such, we did not consider other spatial factors or variables that might influence where participants map NCP. For example, Fagerholm et al. (Citation2019) demonstrate that the benefits people perceive from NCP, are linked to their relationship with the landscape and its accessibility, where the areas around settlements are often hotspots for perceived NCP benefits. Muñoz et al. (Citation2020) show that NCP values are often mapped near roads or trails, or certain places of interest. This importance of accessibility is also highlighted by Cusens et al. (Citation2022). The inclusion of a spatial analysis, taking into account the distance of mapped NCP values from population centers, roads and/or waterways, or from the locations where participants live, work or farm, would give a more complete understanding of why certain NCP values are mapped in certain areas. Future research could focus, not only on linking NCP values to land use/land cover, but also on analyzing the relationship between NCP values and people’s familiarity with the areas where they perceive these benefits, in relation to their distance from them, the ease with which they might get to these areas, and the frequency with which they visit these areas.
Conclusions
Our study was aimed at identifying priority areas for NCP provision in a SEPL in the Colombian Andes subject to intensifying agricultural production. We did so considering multiple value types, and the points of view of different stakeholders in the territory, orienting this towards decision-making on land use. We believe that our study adds to the growing body of work on ecosystem services valuation, by offering an easy to implement, spatially explicit and participatory valuation method for nature’s contributions to people that can be used even in areas where little information is available, and that can yield valuable information for decision makers and local stakeholders alike. Our main findings confirm the importance of involving different stakeholders in spatial NCP valuation exercises, recognizing their different points of view to help identify possible trade-offs and synergies related to land use, reducing the risk of conflicts between actors, especially in a SEPL subject to a strong dynamic of transformation.
Ethics declarations
This investigation adhered to all ethical guidelines of the Master in Conservation and Use of Biodiversity, the School of Environmental and Rural Studies, and the Pontificia Universidad Javeriana, and adhered to the legal requirements of the study country (Colombia). The research proposal, including the methodology and the script and interview guide used, was approved by two evaluators, following procedures set out by the Master in Conservation and Use of Biodiversity at the School of Environmental and Rural Studies. All personal information of human research participants was kept strictly private, and results of the investigation were presented in an anonymized, aggregated manner, where none of these results could be attributed to individual research participants, without this distorting their scholarly meaning. Research participants were informed of this, and the purpose of the investigation, prior to their participation in the study. All human research participants provided informed verbal consent before taking part in the study, as detailed in the script and interview guide used in the research (Supplementary Material S1). Audio recordings of this have been stored by the researchers.
Supplemental Material
Download ()Supplemental Material
Download TIFF Image (1.5 MB)Acknowledgements
The authors wish to thank the people of Aquitania and Suse, especially the participants in this research, for their invaluable support. Also, many thanks to the local public and regional environmental institutions that kindly made available the necessary background information. This article is based on the first author’s master thesis research, conducted in Aquitania between 2017 and 2019, to obtain the title of Master in Conservation and Use of Biodiversity at the School of Environmental and Rural Studies of the Pontificia Universidad Javeriana, Bogotá, Colombia. NCP, actor, and value art used in this paper was designed and created by María José Pérez Sanoja (2018, 2019).
Disclosure statement
No potential conflict of interest was reported by the author(s).
Supplementary material
Supplemental data for this article can be accessed online at https://doi.org/10.1080/26395916.2023.2279584
References
- Alcaldía de Aquitania. 2004. Esquema de Ordenamiento Territorial Aquitania, Boyacá. Alcaldía de Aquitania.
- Alcaldía de Aquitania. 2016. Plan de desarrollo municipal 2016–2019 “Soluciones firmes para Aquitania”. https://www.aquitania-boyaca.gov.co/politicas-y-lineamientos/soluciones-firmes-para-aquitania-2016-2019.
- Alcaldía de Aquitania. 2020. Plan de Desarrollo Municipal 2020–2023 Aquitania Boyacá: “Unidos Construimos el Progreso 2020–2023”. http://www.aquitania-boyaca.gov.co/planes/plan-de-desarrollo-20202023-unidos-construimos-el-progreso-103456.
- Angarita-Baéz JA, Pérez-Miñana E, Beltrán Vargas JE, Ruiz Agudelo CA, Paez Ortiz A, Palacios E, Willcock S. 2017. Assessing and mapping cultural ecosystem services at community level in the Colombian Amazon. Int J Biodivers Sci Ecosyst Serv Manage. 13(1):280–21. doi: 10.1080/21513732.2017.1345981.
- Betts MG, Wolf C, Pfeifer M, Banks-Leite C, Arroyo-Rodríguez V, Ribeiro DB, Barlow J, Eigenbrod F, Faria D, Fletcher RJ Jr., et al. 2019. Extinction filters mediate the global effects of habitat fragmentation on animals. Science. 366(6470):1236–1239. doi: 10.1126/science.aax9387.
- Boerema A, Rebelo AJ, Bodi MB, Esler KJ, Meire P, Rohr J. 2017. Are ecosystem services adequately quantified? J Appl Ecol. 54(2):358–370. doi: 10.1111/1365-2664.12696.
- Bradshaw CJA, Ehrlich PR, Beattie A, Ceballos G, Crist E, Diamond J, Dirzo R, Ehrlich AH, Harte J, Harte ME, et al. 2021. Underestimating the challenges of avoiding a ghastly future. Front Conserv Sci. 1:615419. doi: 10.3389/fcosc.2020.615419.
- Brown G, Fagerholm N. 2015. Empirical PPGIS/PGIS mapping of ecosystem services: a review and evaluation. Iss Environ Sci Tech. 13:119–133. doi: 10.1016/j.ecoser.2014.10.007.
- Bruley E, Locatelli B, Lavorel S. 2021. Nature’s contributions to people: coproducing quality of life from multifunctional landscapes. Ecol Soc. 26(1). doi: 10.5751/ES-12031-260112.
- Cáceres DM, Tapella E, Quétier F, Díaz S. 2015. The social value of biodiversity and ecosystem services from the perspectives of different social actors. Ecol Soc. 20(1):62. doi: 10.5751/ES-07297-200162.
- Chan KMA, Satterfield T. 2020. The maturation of ecosystem services: social and policy research expands, but whither biophysically informed valuation? People Nat. 1–40. doi: 10.1002/pan3.10137.
- Clemente P, Calvache MF, Antunes P, Santos R. 2015. Mapping stakeholders perception on ecosystem services provision within the Portuguese Southwest Alentejo and Vicentine Coast Natural Park. VII Congresso Sobre Planeamento e Gestão Das Zonas Costeiras Dos Países de Expressão Portuguesa. p 1–15.
- Consejo Nacional de Política Económica y Social (Conpes). 2014. Manejo ambiental integral de la cuenca hidrográfica del Lago de Tota - Documento Conpes 3801.
- Corporación Autónoma Regional de Boyacá (Corpoboyacá), & Pontificia Universidad Javeriana (PUJ). 2006. Plan de Ordenación y Manejo de la Cuenca del Lago de Tota. (A. Ramírez González ed.). Bogotá: Corpoboyacá y Pontificia Universidad Javeriana - IDEADE-DET.
- Crossman ND, Burkhard B, Nedkov S, Willemen L, Petz K, Palomo I, Drakou EG, Martín-Lopez B, McPhearson T, Boyanova K, et al. 2013. A blueprint for mapping and modelling ecosystem services. Iss Environ Sci Tech. 4:4–14. doi: 10.1016/j.ecoser.2013.02.001.
- Cusens J, Barraclough AMD, Måren IE. 2022. Participatory mapping reveals biocultural and nature values in the shared landscape of a Nordic UNESCO Biosphere Reserve. People Nat. 4(2):365–381. doi: 10.1002/pan3.10287.
- Darvill R, Lindo Z. 2015. Quantifying and mapping ecosystem service use across stakeholder groups: implications for conservation with priorities for cultural values. Iss Environ Sci Tech. 13:153–161. doi: 10.1016/j.ecoser.2014.10.004.
- Díaz S, Pascual U, Stenseke M, Martín-López B, Watson RT, Molnár Z, Hill R, Chan KMA, Baste IA, Brauman KA, et al. 2018. Assessing nature’s contributions to people. Science. 359(6373):270–272. doi: 10.1126/science.aap8826.
- Díaz-Bravo L, Torruco-García U, Martínez-Hernández M, Varela-Ruiz M. 2013. La entrevista, recurso flexible y dinámico. Investigación En Educación Médica. 2(7):162–167. https://www.redalyc.org/pdf/3497/349733228009.pdf.
- Diazgranados M, Tovar C, Etherington TR, Rodríguez-Zorro PA, Castellanos-Castro C, Galvis-Rueda M, Flantua SGA. 2021. Ecosystem services show variable responses to future climate conditions in the Colombian páramos. PeerJ. 9:1–33. doi: 10.7717/peerj.11370.
- Eastman R, Jin W, Kyem PAK, Toledano J. 1995. Raster procedures for multi-criteria/multi-objective decisions. Photogramm Eng Rem S. 61(5):539–547.
- Ellis EC, Pascual U, Mertz O. 2019. Ecosystem services and nature’s contribution to people: negotiating diverse values and trade-offs in land systems. Curr Opin Env Sust. 38(June):86–94. doi: 10.1016/j.cosust.2019.05.001.
- Ellis EC, Ramankutty N. 2008. Putting people in the map: anthropogenic biomes of the world. Front Ecol Environ. 6(8):439–447. doi: 10.1890/070062.
- Elwell TL, Gelcich S, Gaines SD, López-Carr D. 2018. Using people’s perceptions of ecosystem services to guide modeling and management efforts. Sci Total Environ. 637–638:1014–1025. doi: 10.1016/j.scitotenv.2018.04.052.
- Estoque RC. 2011. GIS-based multi-criteria decision analysis (in natural resource management). Ibaraki: University of Tsukuba, Division of Spatial Information Science, Graduate School of Life and Environmental Sciences.
- Fagerholm N, Torralba M, Moreno G, Girardello M, Herzog F, Aviron S, Burgess P, Crous-Duran J, Ferreiro-Domínguez N, Graves A, et al. 2019 Apr. Cross-site analysis of perceived ecosystem service benefits in multifunctional landscapes. Glob Environ Chan. 56:134–147. DOI:10.1016/j.gloenvcha.2019.04.002.
- Felipe-Lucia MR, de Frutos A, Comín FA. 2022. Modelling landscape management scenarios for equitable and sustainable futures in rural areas based on ecosystem services. Ecosyst People. 18(1):76–94. doi: 10.1080/26395916.2021.2021288.
- Foley JA, DeFries R, Asner GP, Barford C, Bonan G, Carpenter SR, Chapin FS, Coe MT, Daily GC, Gibbs HK, et al. 2005. Global consequences of land use. Science. 309(5734):570–574. doi: 10.1126/science.1111772.
- García-Nieto AP, Quintas-Soriano C, García-Llorente M, Palomo I, Montes C, Martín-López B. 2015. Collaborative mapping of ecosystem services: the role of stakeholders’ profiles. Ecosyst Serv. 13:141–152. doi: 10.1016/j.ecoser.2014.11.006.
- Gu H, Subramanian SM. 2014. Drivers of change in socio-ecological production landscapes: implications for better management. Ecol Soc. 19(1). doi: 10.5751/ES-06283-190141
- Hashimoto S, Nakamura S, Saito O, Kohsaka R, Kamiyama C, Tomiyoshi M, Kishioka T. 2015. Mapping and characterizing ecosystem services of social-ecological production landscapes: case study of Noto, Japan. Sustain Sci. 10(2):257–273. doi: 10.1007/s11625-014-0285-1.
- Hauck J, Görg C, Varjopuro R, Ratamäki O, Maes J, Wittmer H, Jax K. 2013. “Maps have an air of authority”: potential benefits and challenges of ecosystem service maps at different levels of decision making. Ecosyst Serv. 4:25–32. doi: 10.1016/j.ecoser.2012.11.003.
- Iniesta-Arandia I, García-Llorente M, Aguilera PA, Montes C, Martín-López B. 2014. Socio-cultural valuation of ecosystem services: uncovering the links between values, drivers of change, and human well-being. Ecol Econ. 108:36–48. doi: 10.1016/j.ecolecon.2014.09.028.
- Instituto de Investigación de Recursos Biológicos Alexander von Humboldt (IAvH). 2017. Recomendación para la delimitación, por parte del Ministerio de Ambiente y Desarrollo Sostenible, del Complejo de Páramos Tota-Bijagual-Mamapacha a escala 1:25.000. http://hdl.handle.net/20.500.11761/9261.
- IPBES. 2019. The global assessment report on biodiversity and ecosystem services: summary for policymakers ( S. Díaz, J. Settele, E. Brondízio, H. T. Ngo, M. Guèze, J. Agard, A. Arneth, P. Balvanera, K. Brauman, S. Butchart, K. Chan, L. A. Garibaldi, K. Ichii, J. Liu, S. M. Subramanian, G. F. Midgley, P. Miloslavich, Z. Molnár, D. Obura, A. Pfaff, S. Polasky, A. Purvis, J. Razzaque, B. Reyers, R. R. Chowdhury, Y.-J. Shin, I. Visseren-Hamakers, K. Willis, & C. Zayas (eds.)). https://ipbes.net/system/tdf/ipbes_global_assessment_report_summary_for_policymakers.pdf?file=1&type=node&id=35329.
- Jacobs S, Dendoncker N, Martín-López B, Barton DN, Gomez-Baggethun E, Boeraeve F, McGrath FL, Vierikko K, Geneletti D, Sevecke KJ, et al. 2016. A new valuation school: integrating diverse values of nature in resource and land use decisions. Ecosyst Serv. 22:213–220. doi: 10.1016/j.ecoser.2016.11.007.
- Leroy D, Barrasa García S. 2021. Which ecosystem services are really integrated into local culture? Farmers’ perceptions of the Columbian and Venezuelan páramos. Hum Ecol. 49(4):385–401. doi: 10.1007/s10745-021-00251-y.
- Llambí LD, Becerra MT, Peralvo M, Avella A, Baruffol M, Díaz LJ. 2020. Monitoring biodiversity and ecosystem services in Colombia’s high Andean ecosystems: toward an integrated strategy. Mt Res Dev. 39(3):A8–A20. doi: 10.1659/MRD-JOURNAL-D-19-00020.1.
- Lyytimäki J. 2015. Ecosystem disservices: embrace the catchword. Ecosyst Serv. 12:136. doi: 10.1016/j.ecoser.2014.11.008.
- Martín-López B, Iniesta-Arandia I, García-Llorente M, Palomo I, Casado-Arzuaga I, Del Amo DG, Gómez-Baggethun E, Oteros-Rozas E, Palacios-Agundez I, Willaarts B, et al. 2012. Uncovering ecosystem service bundles through social preferences. PloS One. 7(6):1–13. doi: 10.1371/journal.pone.0038970.
- Masao CA, Prescott GW, Snethlage MA, Urbach D, Torre-Marin Rando A, Molina-Venegas R, Mollel NP, Hemp C, Hemp A, Fischer M. 2022 June. Stakeholder perspectives on nature, people and sustainability at Mount Kilimanjaro. People Nat. 4(3):711–729. 10.1002/pan3.10310
- MEA. 2005. Ecosystems and human well-being: synthesis. https://www.millenniumassessment.org/documents/document.356.aspx.pdf.
- Mecum B. 2014. Rasterizing shapefiles in R. Brycemecum.Com. https://brycemecum.com/2014/05/15/rasterizing-in-r/.
- Mojica A, Guerrero JA. 2013. Evaluación del movimiento de plaguicidas hacia la cuenca del Lago de Tota, Colombia. Revista Colombiana de Química. 42(2):29–38.
- Muñoz L, Hausner VH, Runge C, Brown G, Daigle R. 2020 Jan. Using crowdsourced spatial data from Flickr vs. PPGIS for understanding nature’s contribution to people in Southern Norway. People Nat. 2:437–449. doi:10.1002/pan3.10083.
- Nahuelhual L, Laterra P, Villarino S, Mastrángelo M, Carmona A, Jaramillo A, Barral P, Burgos N. 2015. Mapping of ecosystem services: missing links between purposes and procedures. Iss Environ Sci Tech. 13:162–172. doi: 10.1016/j.ecoser.2015.03.005.
- Newbold T, Hudson LN, Arnell AP, Contu S, De Palma A, Ferrier S, Hill SLL, Hoskins AJ, Lysenko I, Phillips HRP, et al. 2016. Has land use pushed terrestrial biodiversity beyond the planetary boundary? A global assessment. Science. 353(6296):288–291. doi: 10.1126/science.aaf2201.
- Nyström M, Jouffray J-B, Norström AV, Crona B, Søgaard Jørgensen P, Carpenter SR, Bodin Ö, Galaz V, Folke C. 2019. Anatomy and resilience of the global production ecosystem. Nature. 575(7781):98–108. doi: 10.1038/s41586-019-1712-3.
- Ochoa V, Urbina-Cardona N. 2017. Tools for spatially modeling ecosystem services: publication trends, conceptual reflections and future challenges. Ecosyst Serv. 26:155–169. doi: 10.1016/j.ecoser.2017.06.011.
- Oteros-Rozas E, Martín-López B, González JA, Plieninger T, López CA, Montes C. 2014. Socio-cultural valuation of ecosystem services in a transhumance social-ecological network. Reg Environ Chan. 14(4):1269–1289. doi: 10.1007/s10113-013-0571-y.
- Pascual U, Balvanera P, Díaz S, Pataki G, Roth E, Stenseke M, Watson RT, Başak Dessane E, Islar M, Kelemen E, et al. 2017. Valuing nature’s contributions to people: the IPBES approach. Curr Opin Env Sust. 26:7–16. doi: 10.1016/j.cosust.2016.12.006.
- Plieninger T, Dijks S, Oteros-Rozas E, Bieling C. 2013. Assessing, mapping, and quantifying cultural ecosystem services at community level. Land Use Policy. 33:118–129. doi: 10.1016/j.landusepol.2012.12.013.
- R Core Team. 2015. R: a language and environment for statistical computing. R Foundation for Statistical Computing. https://www.r-project.org/.
- Ramirez-Gomez SOI, Torres-Vitolas CA, Schreckenberg K, Honzák M, Cruz-Garcia GS, Willcock S, Palacios E, Pérez-Miñana E, Verweij PA, Poppy GM. 2015. Analysis of ecosystem services provision in the Colombian Amazon using participatory research and mapping techniques. Ecosyst Serv. 13:93–107. doi: 10.1016/j.ecoser.2014.12.009.
- Raymond P. 1990. El Lago de Tota ahogado en cebolla: Estudio socioeconómico de la Cuenca Cebollera del lago de Tota. 1st ed. Bogotá: Pontificia Universidad Javeriana - Facultad de Ciencias Económicas y Administrativas.
- Restrepo Calle S. 2019. Unpublished R code.
- Ricaurte LF, Olaya-Rodríguez MH, Cepeda-Valencia J, Lara D, Arroyave-Suárez J, Finlayson CM, Palomo I. 2017 Apr. Future impacts of drivers of change on wetland ecosystem services in Colombia. Glob Environ Chan. 44:158–169. doi:10.1016/j.gloenvcha.2017.04.001.
- Roldán Ortiz AM. 2004. Bienes y servicios ambientales del manglar en el Pacífico nariñense: Una aproximación a sus reglas desde la economía, la ecología y la comunidad. Bogotá: Pontificia Universidad Javeriana Bogotá.
- Saaty RW. 1987. The analytic hierarchy process - what it is and how it is used. Math Modelling. 9(3–5):161–176. doi: 10.1016/0270-0255(87)90473-8.
- Schägner JP, Brander L, Maes J, Hartje V. 2013. Mapping ecosystem services’ values: current practice and future prospects. Ecosyst Serv. 4:33–46. doi: 10.1016/j.ecoser.2013.02.003.
- Tallis H, Polasky S. 2009. Mapping and valuing ecosystem services as an approach for conservation and natural-resource management. Ann N Y Acad Sci. 1162(1):265–283. doi: 10.1111/j.1749-6632.2009.04152.x.
- Torres AV, Tiwari C, Atkinson SF. 2021 Apr. Progress in ecosystem services research: a guide for scholars and practitioners. Ecosyst Serv. 49:101267. doi: 10.1016/j.ecoser.2021.101267.
- UNU-IAS, Bioversity International, IGES, & UNDP. 2014. Toolkit for the indicators of resilience in socio-ecological production landscapes and seascapes.
- Whitehead A. 2014. Converting shapefiles to rasters in R. R-Bloggers. https://www.r-bloggers.com/converting-shapefiles-to-rasters-in-r/.
- Wright WCC, Eppink FV, Greenhalgh S. 2017. Are ecosystem service studies presenting the right information for decision making? Ecosyst Serv. 25:128–139. doi: 10.1016/j.ecoser.2017.03.002.