
 ?Mathematical formulae have been encoded as MathML and are displayed in this HTML version using MathJax in order to improve their display. Uncheck the box to turn MathJax off. This feature requires Javascript. Click on a formula to zoom.
ABSTRACT
The Nordhordland UNESCO Biosphere Reserve encompasses a heterogeneous landscape which provides numerous ecosystem services. Semi-natural grasslands provide forage for traditionally managed livestock and are important sources of nectar and pollen for pollinators. However, these services are not evenly distributed due to different biotic and abiotic constraints of the fjord landscape, which stretches from flat coastal areas to steep hills and mountains inland. We studied how geographic location and grazing livestock type affect the plant species richness, plant functional group composition, nectar and forage resources of these grasslands. We recorded plant species percentage cover in 30 fields in the Nordhordland Biosphere Reserve grazed by sheep, goats or cattle, and from these data we calculated indicator values for forage and nectar resource using species index values from existing trait databases. Sites grazed by cattle had significantly different plant functional group compositions than sites grazed by sheep or goats, independent of geographical location. Forage resource indicator values were lower at coastal sites grazed by sheep. We found a weak but significant positive correlation between nectar resource indicator value and plant species richness, as well as between nectar and forage resource indicator values. Type of livestock and geographical location are not the only factors influencing provisioning services in semi-natural grasslands. Nonetheless, traditional grazing maintains ecosystem service delivery even in low-productive coastal areas. Forage resource, nectar provision and plant species richness appear to be bundled, providing clear guidance for managing ecosystem services in Nordhordland UNESCO Biosphere Reserve’s valuable cultural landscapes.
Key policy highlights
Challenges for the assessment of ecosystem services across the Nordhordland UNESCO Biosphere Reserve: the Nordhordland Biosphere Reserve (BR) has a unique heterogeneous landscape with semi-natural grasslands in coastal and fjord areas grazed by different livestock types (sheep, goats, cattle).
From one dataset to three indicators: we collected plant species data from these grasslands, from coast and fjord, grazed by sheep, goats or cattle. We generated 3 indicators: plant species richness, nectar resource and forage provision services.
Farmer management implication choices: farmers adapting management to their environment and to available resources on their fields help to preserve diversity and BR cultural landscape value. There was very high between-site variation in indicator scores, even between sites with the same livestock species.
This low-intensity grazing system offers ecosystem services synergies: correlations between richness and nectar, and forage value and nectar, imply ‘bundling’ rather than tradeoffs between ecosystem service delivery.
Edited by:
1. Introduction
The global environmental impact of livestock intensification has been widely demonstrated (Steinfeld et al. Citation2006; Davis et al. Citation2015), and the recent IPBES report (Citation2019) showed that global food security is also compromised because of the loss of local plant and animal diversity essential to maintain resilient agro-ecosystems (IPBES Citation2019). A large but decreasing proportion of global meat production is on semi-natural or low-input cultural landscapes (FAO Citation2023). This is particularly true in areas of the world with a long history of small-scale livestock production. Such systems are often less productive than intensive, large-scale meat production, but have a range of other benefits such as high biodiversity and high cultural value (Marriott et al. Citation2004; Habel et al. Citation2013; Cusens et al. Citation2021). In the upcoming decades, a key issue to solve will therefore be how to increase food production and quality while preserving biodiversity, and thus ecosystem services delivery, of semi-natural habitats (Millennium Ecosystem Assessment Citation2005).
Semi-natural habitats are deeply rooted in the cultural landscapes of Western Norway, as the earliest traces of agriculture appeared around 6000 BP (Hjelle et al. Citation2018) and farming was likely established across the area from 4200 BP onwards (Bakka and Kaland Citation1971; Hjelle et al. Citation2006; Mehl et al. Citation2015). Today, the region is still dominated by livestock rearing for meat, wool, and dairy production. Permanent semi-natural grasslands represent almost 50% of the total agricultural area, compared with8% at the national scale (Statistics Norway Citation2020a). These habitats are key providers of ecosystem services (Wehn et al. Citation2018; Johansen et al. Citation2019; Sydenham et al. Citation2022) such as forage production for livestock and nesting sites for pollinators of both commercial crops and wild species. For instance, Norwegian production of fruits, berries, oilseeds and seeds of legumes such as clover relies largely upon pollination (Bommarco et al. Citation2012) and 80% of Norwegian wild plants need pollinators for their seed production (Totland Citation2013).
Even though Norway has among the highest relative cover of permanent grasslands in Europe (Smit et al. Citation2008), these habitats are currently degraded by two opposing land use changes: on one side, the intensification of agricultural practices, involving new techniques, machinery and incentive systems and, on the other side, land abandonment (Jones Citation1988; Hamre et al. Citation2007). These opposing trends can be illustrated by changes in Norwegian farm size over the past 20 years: the number of farms covering 50 ha or more has increased by about60%, while 40% to 55% of farms smaller than 30 ha have been lost (Statistics Norway Citation2020b). The outcome of the parallel processes of abandonment and intensification is that the total area of outfield (unenclosed, non-intensively managed) pastures grazed by sheep has decreased by 5% over the past 20 years (1 914 098 sheep in 2020), while the total area grazed by cattle has increased by0% over the same time period (249 333 cattle in 2020) (Statistics Norway Citation2020a). Land abandonment deteriorates ecosystem service delivery (Wehn et al. Citation2018; Johansen et al. Citation2019) as well as local meat and dairy production, threatening food security and livelihood options in rural areas (Terres et al. Citation2015; Steinshamn et al. Citation2018). Semi-natural grasslands host highly valuable assemblages of plants and animals, but recent land-use changes have resulted in the loss of biodiversity (Isselstein et al. Citation2005; Wehn et al. Citation2018). Consequently, these systems are now listed as vulnerable habitats in the Norwegian Red List for Ecosystem and Habitat Types (Artsdatabanken Citation2018).
Preserving biodiversity in the agricultural landscape while ensuring the livelihood of the local farmers is one of the main foci of the recently designated Nordhordland UNESCO Biosphere Reserve (hereafter NBR), in Western Norway (Kaland et al. Citation2018). A key feature of the UNESCO Man and Biosphere program and the World Network of Biosphere Reserves (BR) is to promote models of sustainable development at the local level (United Nations Citation2015; UNESCO Citation2017). BRs are experimental sites for testing interdisciplinary approaches to understanding and managing changes and interactions between social and ecological systems, including conflict prevention and management of biodiversity (Batisse Citation1982; UNESCO Citation2017; Barraclough et al. Citation2023). In Nordhordland, traditionally managed grazing systems have shaped the landscapes into a mosaic of semi-natural habitats which includes permanent grasslands, hay-meadows, heathlands, and woodlands (Kaland et al. Citation2018). The topographic and edaphic constraints have limited the homogenization of agricultural practices and have promoted the use of different types of livestock (sheep, goats, cattle) and harvesting practices, offering a remarkably diverse range of ecosystem services in the NBR (Cusens et al. Citation2021, Citation2023).
The delivery of ecosystem services by semi-natural grasslands in relation to land abandonment has already been explored in Norway (see, for example, Wehn et al. Citation2018; Johansen et al. Citation2019), but there has been less investigation of how environmental context and species of livestock affect the delivery of these services. Within the BR framework, such questions are key to optimise the continued management of agricultural areas and improve the recognition of agriculture in providing ecosystem services beyond human food provisioning. We aim to foster a better and more concrete understanding of how agricultural practices and environmental gradients affect spatial variation in ecological dynamics, plant diversity and ecosystem services at local scales. Furthermore, a key aim of both the UN Biosphere Reserve Program and the project upon which this paper is based is to engage active cooperation between farmers and scientists.
In this study, we used plant community composition data gathered from 30 grazed, enclosed fields in Nordhordland BR to investigate how plant species richness, forage and nectar provision in semi-natural grasslands are influenced by the landscape zone (coast and fjord region) and by the livestock type (cattle, sheep, and goats). We hypothesise that the pattern in species richness and community composition will be affected by landscape zone because the more exposed environment of the coast will be of lower productivity than the comparatively warmer summer conditions in the fjords, where the varied topography means that the lowland areas near to the farms are very sheltered. Productivity-species richness relationships follow a humped distribution at the global scale (Fraser et al. Citation2015) but we expect that none of our areas are of low enough productivity that plant species richness will be reduced by environmental stress. At higher levels of productivity, species richness is reduced due to the opportunity for stronger competitors to become dominant. In the case of European grasslands, increased nutrient levels favour grasses (e.g. Stevens et al. Citation2011; Socher et al. Citation2013; Boch et al. Citation2021) which outcompete forbs. We therefore expect that in relation to fjord sites, coastal sites will have a lower proportion of grasses, higher proportion of forbs, and therefore deliver lower forage value but a higher nectar resource.
We hypothesise that as cattle, goats and sheep do not have the same preferences, they will therefore influence plant composition differently by their uptake. In general, the smaller the livestock species, the more selective the grazing, showing a preference for infrequent species (Pykälä Citation2003; Liu et al. Citation2015). Likewise, cattle tolerate plants with a lower nutrient concentration but require higher quantities of forage. They prefer grass, but they also eat forbs. For these reasons, we predict that cattle grazing may reduce plant competition and offer more space for forbs to grow, whereas sheep and goats may be more selective and prioritise forbs.
We have therefore established a basis for a further prediction: that of a trade-off between forage production (higher in productive areas) and nectar supply and species richness (both of which should be higher in lower-productivity situations). This is supported by, among others, Loucougaray et al. (Citation2015). As so many of our hypotheses depend upon an understanding of the balance between different functional groups, we also directly analyse functional group composition against our predictor variables of livestock and landscape zone.
2. Materials and methods
2.1. Study areas
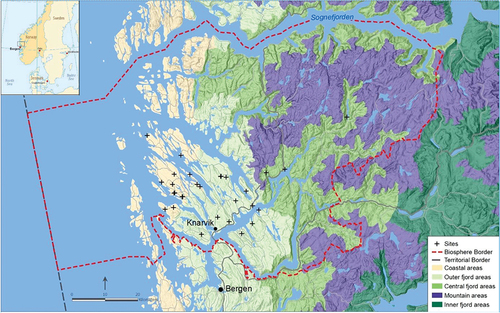
The Nordhordland UNESCO Biosphere Reserve (Nordhordland BR) is located on the west coast of Norway () and covers approximately 6700 km2 between the city of Bergen in the south and the Sognefjord in the north. Stretching from the open ocean to the mountains through the fjords, the BR aims to be representative of the heterogeneous landscape and climatic conditions of the Norwegian west coast.
Figure. Nordhordland UNESCO Biosphere Reserve, constituting nine municipalities, is located on the west coast of Norway. The grazed grassland sites that we sampled were in outer coastal areas and fjord areas and are indicated by ‘+’. Map modified from NIJOS (Citation2011) and Kaland et al. (Citation2018) for the Biosphere Reserve boundary.
Western Norway is characterised by steep topography and strong environmental gradients, such as climate and soil quality (Ketzler et al. Citation2021). The coast is dominated by primitive rocky lithosols (Låg and Landbrukshogskole Citation1983), which are typically shallow and limit plant rooting and soil fertility (Låg Citation1987). Podzol soils develop further inland (Låg and Landbrukshogskole Citation1983): they are usually found in boreal areas within the humid temperate zone, from a permeable parent bedrock and where vegetation produces a nutrient-poor litter (Sauer et al. Citation2007). Moreover, Losvik (Citation1993) found higher pH on the coastal hay meadows than boreal hay meadows in Western Norway. Regarding climate, the altitudinal variation linked to geomorphology creates both temperature and precipitation gradients. Monthly average temperature exceeds0°C only one to three months a year. Annual precipitation varies between the outer coastal plains, where there is not the topography to create much orographic precipitation and annual precipitation averages around500 mm, through the high-rainfall coastal mountains which receive in excess of 3000 mm of precipitation annually, to the more inland areas in the rain shadow of the mountains with annual precipitation closer to300 mm per year (Kaland et al. Citation2018; Norwegian Centre for Climate Services at https://seklima.met.no/observations/). The oceanic climate is characterized by higher precipitation, higher winter temperature and shorter snow cover period and therefore influences the composition of coastal vegetation, which is also exposed to wind and salt stresses (Losvik Citation1993; Moen Citation1998).
Based on landscape geomorphology, geology, hydrology, land cover and land use, five landscape zones have been defined for the region (NIJOS Citation2011): coastal-, outer fjord-, central fjord-, inner fjord, and mountain areas (). The topography varies from the coast, divided into flat islands and open to the sea, to outer fjord where the land is divided by straits and fjord arms, with hills and knolls. Coast and fjord have a different cultural landscape heritage that can be described by a balance between reliance upon marine and terrestrial resources. Coastal and fjord landscapes are the variables of interest to our hypothesis, but they are likely to act as proxies for other environmental variables in the analysis.
2.2. Vegetation analysis
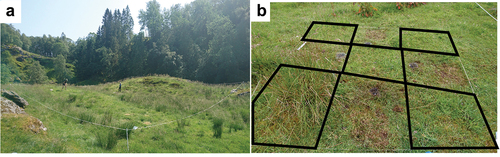
A total of 30 sites were visited from mid-June to mid-August in 2019 and 2020, respectively (see Supplementary materials, Appendix). Our survey sites were permanent, semi-natural grasslands which have been grazed by either cattle (10 sites), sheep (11 sites) or goats (9 sites) for at least0 years, except one goat site which was under sheep grazing 5 years prior to the survey. No site had been resown and/or ploughed since the970s, and no site was drained after 2010. They were selected in the coastal area (14 sites) and the outer and central fjord area (16 sites) (here after called ‘fjord’) at low elevation (less than 200 masl). Grazing intensity was low across all sites, with stocking density ranging from 0.01 to 0.5 per ha (average 0.17 per ha). For each site, a sampling area of 400 m2 (20 m × 20 m) was purposely chosen to be as homogeneous and representative of the grazing field as possible. In the one site where the shape of the field meant it was not practical to delimit a sampling area of 20 m × 20 m, a coast site grazed by goats, we chose 40 m ×0 m. This site did not have an unusual value for species richness but did have an unusually high nectar value. Inclusion criteria were the absence or limited presence of trees, rocks or permanently waterlogged ground (as indicated by extensive cover of Sphagnum spp. or standing water). Within each sampling area, three blocks of 9 m2 (3 m × 3 m) were positioned, at least 6 m from each other and as representative of the conditions within the sampling area as possible. In each block, vegetation was analysed in five quadrats of m2 (), making a total of5 sampled quadrats per site. The reason for the ‘checkerboard’ design is that this paper presents data from a larger project where both destructive and non-destructive samples were taken in close proximity; further results from this sampling will be presented in a separate paper (Kerdoncuff et al., in prep). In each quadrat, species composition and percentage cover were recorded for both vascular and non-vascular plants by one of the two observers (MAK or AEE) who each gathered data in both 2019 and 2020. Species that could not be identified in the field (e.g. bryophytes) were coded, collected, and identified a posteriori with the help of experts.
Figure 2. Sampling site (a) with one of the three blocks and five squares dedicated to the floristic survey marked in black (b). In , it is possible to see the pitfall traps and soil removal in the quadrats not used for this study.
Plant species were classified into seven functional groups:. ferns, 2. mosses and liverworts, 3. woody plants (shrub), 4. non-leguminous herbs (hereafter called ‘forbs’), 5. legumes, 6. Poaceae, 7. Cyperaceae and Juncaceae. Legumes and Poaceae were distinguished in their own categories because of their high forage potential (Baumont et al. Citation2012).
2.3. Data analyses
Our analysis relied on four indicators: vascular plant species richness, proportion of the different functional groups, nectar resource values and forage resource values. These indicators were all analysed at the block level, i.e. we used the mean value of the five quadrats within each block. Quadrats were diagonally adjacent and could not be treated independently, and we also wished to avoid hierarchically nested random effects. Our analysis accounted for the aggregation of blocks within sites. All statistical analyses were conducted in R version 4.1.1 (R Core Team Citation2022), and the package ggplot2 version 3.4.0 (Wickham Citation2016) has been used.
2.3.1. Determination of nectar and forage resource indicator values
Nectar and forage resource indicator values were calculated by combining species composition (species identity and percent cover) data with published nectar and forage index values for each species. By using composition rather than biomass to calculate nectar and forage resource indicator values, we avoid the short-term influence of rotational grazing on biomass variability and flowering.
The nectar resource index was based on empirical and modelled annual nectar productivity per unit cover according to Baude et al. (Citation2016). Forbs, legumes and woody plant species were used for the nectar indicator analysis (i.e. graminoids and non-seedbearing plants were assigned zero). We ranked nectar productivity for each species from 0 to 4 based on the classification of potential nectar production, in kilograms of nectar that would be produced from a hectare of pure monoculture of that species, using Melin (Citation2015), p. 0; no potential,; low potential (>0 to 50 kg/ha/year), 2; medium potential (50 to 200 kg/ha/year), 3; high potential (200 to 500 kg/ha/year), and 4; very high potential (>500 kg/ha/year). Species not found in the database but known to be wind-pollinated were given the value 0. Our final nectar index dataset comprised 60 species out of the total 79 herb, legume and woody species (see Supplementary materials, Appendix) and the remaining9 species represented 0,6% of the total plant cover.
The forage index values were extracted from the E-flora-sys database (Plantureux and Amiaud Citation2010) which mainly takes into account productivity (potential biomass production) and to a lesser extent the quality (for example, in the case of unpalatable plants) of the forage. The forage analysis was performed on all species except for the tree seedlings (very few individuals, in four sites) as we could not generate forage index values for them. We wanted to emphasize the importance of forbs and legumes as they contribute to livestock health, improve sensory and nutritional quality of animal products as well as increase the safety and stability of the agronomic system (Baumont et al. Citation2008, Citation2012; Farruggia et al. Citation2008). We therefore scaled the functional types by attributing weight scores of 0,, 2 and 3 for species of ‘low forage value’, ‘medium forage value’, ‘good forage value’, and ‘very good forage value’, respectively. Species not found in the E-flora-sys database were assigned the same value as a listed congeneric. We were able to include a total of03 out of the15 plant species (see Supplementary materials, Appendix), and species absent from the E-flora-sys database only represented 0,03% of the total plant cover.
The initial nectar resource indicator value and forage resource indicator value (vk) were calculated for each quadrat (k) according to the percent cover of each species (aik), weighted by the nectar/forage rank (Indexi):
| = | Percent cover of the species i | |
| = | Number of species within the quadrat | |
| = | Index of the nectar or the forage for the species i | |
| = | Nectar or forage value for the quadrat k |
The final nectar and forage values used for statistical analyses are the sum of vk calculated for each block vb (2).
2.3.2. Effect of landscape zone and livestock type on plant species richness and nectar/forage values
We tested the effects of landscape zone (coastal, fjord) and livestock type (cattle, sheep, goats) on plant species richness and on nectar and forage resource indicator values with linear mixed-effects models using the R package lme4 (Bates et al. Citation2015). Due to the low replication level compared with the number of factors we wished to test, we used pre-defined candidate models (Guthery et al. Citation2003). We considered two possible confounding factors caused by our methods: firstly, the year of the sampling could be a factor influencing the results since climatic inter-annual variations can modify the community plant species composition and quarter 2 (April–June) received around 50% more precipitation in 2020 than in 2019 (Norwegian Centre for Climate Services at https://seklima.met.no/observations/). Secondly, we took into account the observer effect, which can affect both species identification and estimation of percent cover. Both year and the observer were confounding factors rather than focal variables, but as they only had two levels each, they could not be analysed as random effects (Bolker et al. Citation2009). We first tested the interaction of the livestock (‘animal’) with the landscape zone (‘area’) (model). If this interaction was significant, we used forward-stepwise selection by adding either ‘year’ or ‘observer’ (model 2a and 2b) as there was not adequate statistical power to include both. We tested whether we obtained a significant effect when comparing models and 2a or 2b with an ANOVA. If the interaction ‘animal’ × ‘area’ (model) was not significant, we had adequate statistical power to use backward stepwise selection: ‘year’ and ‘observer’ were first added in combination (model 3), and then we removed individual factors in turn (model na and nb). We tested whether we obtained a significant effect when comparing model na or nb with model n-1 with an ANOVA. To ensure that the models were not poorly specified, we checked the distribution of model residuals and tests of homoscedasticity.
In order to seek potential trade-offs, we tested for correlations between our response variables, selecting the method according to the distribution of residuals and the presence of joint values. We used Spearman rank non-parametric correlation to compare nectar and forage values, Kendall non-parametric correlation for plant species richness and nectar values and Pearson linear correlation for plant species richness and forage resource indicator value. To identify ecosystem service trade-offs within our sampling area, we ranked our sites following Multi-Criteria Decision-Making Problems (Yoon and Hwang Citation1995), using TOPSIS (The Technique for Order Preference by Similarity to an Ideal Solution) in R (Yazdi Citation2013). TOPSIS is a scoring method aimed at reaching the best compromise solutions, using matrices of scores to choose the solution with the shortest Euclidean distance from the ideal solution.
2.3.3. Effect of landscape zone and livestock on plant functional groups
We conducted a Principal Component Analysis (PCA) on plant functional groups using the R package ‘vegan’ version 2.6–4 (Oksanen et al. Citation2022) and we used linear mixed-effects models on the PCA scores from axis. We tested the effects of the ‘area’ and the ‘animal’, with ‘year’ and ‘observer’ as confounding factors, using the same candidate-model-based model selection process as we had used for plant species richness and nectar/forage values.
3. Results
3.1. Plant species richness
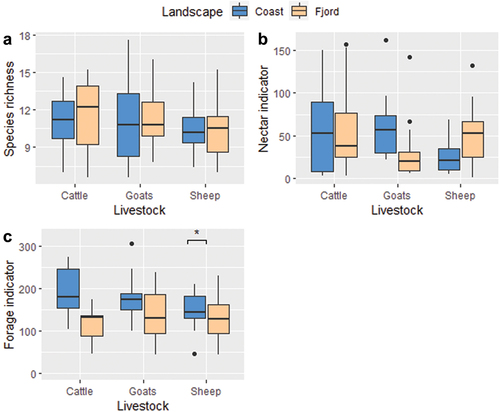
We found a total of15 angiosperm plant species (i.e. excluding mosses, liverworts and ferns; see Supplementary materials, Appendix). The data are characterised by high between-site variation () with an average species richness per block of1 and a range of 7 to8.
Figure 3. Species richness (a), nectar resource indicator values (b) and forage resource indicator values (c) in fields grazed by different livestock; cattle, goats or sheep, on the coast and in the fjords of the Nordhordland UNESCO Biosphere Reserve, Norway. The boxplots follow the ggplot default boxplot method: the horizontal bar indicates the median, the box extent indicates the interquartile range, the black vertical lines represent two standard deviations and black spots indicate values outside two standard deviations. The indicator values do not have units. *: significant effect (p-value < 0.05).
A model which included livestock type, landscape zone, and observer had the highest explanatory power for plant species richness (see Supplementary materials, Appendix 2) but none of the individual parameters were significant. Within that model, we only observed a significant effect within an interaction term, with a significantly different effect of the observer on the plant species richness of goat-grazed fields, possibly explained by unbalanced sampling: MAK sampled two goat-grazed sites, while AEE sampled 7.
3.2. Nectar resource
The Nectar resource indicator value varied between and63, with a mean of 46 per block and a standard deviation of 41. The standard deviation was high relative to the mean value within groups (), for example, the mean nectar value for cattle was 56 and the standard deviation 50. A model which included livestock type, landscape zone and observer had the strongest explanatory power for nectar resource indicator value, but none of the individual explanatory variables in that model showed a significant effect (see Supplementary materials, Appendix 2).
3.3. Forage resource
The forage resource indicator value ranged from 44 to 306, with an average of49 and standard deviation of 58 (). A model including livestock type interacting with landscape, plus observer, had the strongest explanatory power. Median forage resource indicator values were around 50% higher in one landscape than in another (coast median numerically but not statistically higher than fjord median) but the relatively high within-group variance obfuscated any potential underlying patterns, for example, the coastal grassland median forage resource indicator value was74 and the standard deviation was 55. The interaction between livestock type and landscape zone was significant (p = 0.029) on coastal sites only, where fields grazed by sheep had a lower forage resource indicator value than sites grazed by goats or cattle ().
3.4. Trade-off between plant species richness, nectar resource and forage value
We observed a positive relationship between the plant species richness and the nectar resource indicator value (R2 = 0.31; p = <0.001), as well as a positive relationship between the nectar resource indicator value and the forage resource indicator value (R2 = 0.27; p = 0.01). There was, however, no relationship between the forage resource indicator value and plant species richness (R2 = 0.04; p = 0.75).
The three sites presenting the highest combined values of plant species richness, forage resource indicator value and nectar resource indicator value according to the TOPSIS analysis were all coastal sites (see Supplementary materials, Appendix 3). These sites included both species with very good forage index value (e.g. Poa pratensis) and species with very good nectar index value (e.g. Achillea millefolium), or species valuable for both services (e.g. Trifolium repens). Moreover, these fields were characterised by high vegetation density, with an overlap of species layers exceeding00% cover. Two out of the three top ranking sites were grazed by cattle. These sites are of particularly high quality in terms of forage resource indicator value (best scores), and very good nectar resource indicator values. The lowest two sites in the overall ranking were also grazed by cattle and are coastal and fjord sites. The species cover of these sites was dominated by Deschampsia cespitosa, which has a very low forage index value and included very few herb species, hence a low nectar resource indicator value.
3.5. Plant functional types depending on landscape and livestock types
The plant type composition of the sites, as analysed by PCA score, was associated with both landscape zone and livestock on both axes. The best model for the PCA axis score was the interactive model between landscape and livestock types with the additive factor of the observer also included (see Supplementary materials, Appendix 2). The best model for axis 2 score was the interactive model between livestock and landscape zones. The first (PC1) and second axis (PC2) explained 55% and 29% of the data, respectively.
In the PCA plot (), Poaceae are associated with cattle and coastal sites. This is supported by a direct analysis of the cover of Poaceae, where coastal sites with cattle have the highest median cover of Poaceae (92%; ). Moreover, the linear model of the first axis scores shows that coastal sites grazed by cattle had a different plant functional type composition (p = 0.01, see Supplementary materials, Appendix 2), with the lowest herb percent cover (6%) (). The linear model of the second axis scores shows that fjord sites grazed by cattle were also significantly different in plant functional type composition (p = 0.028, see Supplementary materials, Appendix 2), with a relatively low ratio between the percent cover of Poaceae and of forbs. These proportions are also verified in fjord grasslands grazed by sheep, but the latter had a higher bryophyte percent cover (mean: 53%, sd: 24) compared with cow fields (mean: 20%, sd: 27).
Figure 4. Principal component analysis (PCA) of the plant functional types (mosses and liverworts, ferns, woody plants, forbs, legumes, Poaceae, Cyperaceae and Juncaceae) depending on landscape zone (coast or fjords) and livestock (cattle, goats or sheep).
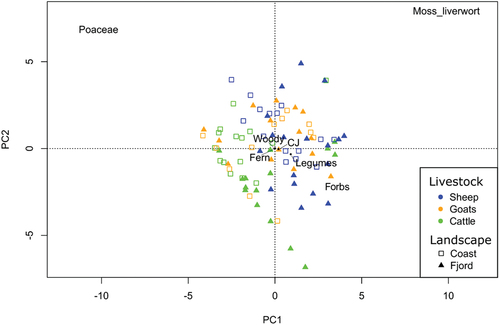
Figure 5. Poaceae (a) and herb (b) cover plotted for each unique combination of grazing animal and landscape zone.
We observed a significant observer effect on the composition of fields grazed by goats in the coastal landscape zone (p = 0.003, see Supplementary materials, Appendix 2) and in the fjords (p-value = 0.019, see Supplementary materials, Appendix 2). The linear mixed-effects model also showed an observer effect on the composition of fields in the fjord grazed by cattle (p = 0.001), with the main difference lying in the sampled abundances of mosses and liverworts (around 45% difference on average).
Visual inspection of the PCA () plot suggests an association between forbs and fjord sites (). Mosses and liverworts appear associated with sites grazed by goats and sheep (). The other functional types (woody plants, ferns, and legumes) did not appear to differ between sites, whether it be according to livestock or landscape zones.
4. Discussion
4.1. Fjord gradient influence on grasslands
Our results did not validate our first hypothesis – landscape zone did not affect plant species richness, nor did it affect forage or nectar resource indicator value as an individual variable. Although landscape zone was included in every best model, either stand-alone or as an interactive term, it was never significant as a variable within those models. We assumed that landscape zone would influence our response variables independently of livestock type since there are higher levels of abiotic stress on the coast (wind, salt, drought, thin soil) that would limit the productivity of the fields. There is undoubtedly an ecological gradient in the Norwegian fjord system (Klanderud et al. Citation2015), but our geographic range of sites (outer coast to approximately 40 km inland) may be too limited to show a noticeable effect (). The ‘coastal’ zone itself can stretch up to5 km from the coastline and thus encompasses areas with different levels of exposure to the oceanic influence. Relatively high rainfall and favourable microclimatic conditions could also counterbalance the gradient effect, particularly salinity, because salt may not provoke hydric stress for the plants at low concentration (Zouhaier et al. Citation2016). It is only under very stressful conditions that the plant species richness would decrease (Fraser et al. Citation2015) due to the strong selection for specialist species (environmental filtering). Dornbush and Wilsey (Citation2010) also showed that forb diversity, and by extension overall species richness, was negatively affected by decreasing soil depth in tallgrass prairies, even if the community composition did not differ. Coastal soils can be expected to be shallower, but we did not observe consistent trends regarding forb cover. Losvik (Citation1993) showed that the floristic composition of meadows in western Norway was driven by soil moisture, particularly for bryophytes. Mosses have an important role in the regulation of micro-climatic conditions within the vegetation layer by influencing soil moisture and temperature (Xiao et al. Citation2016). For example, the presence of a deep moss layer reduces local soil temperature and nitrogen availability, which is reflected in reduced graminoid productivity, while shallow moss increases shrub and herb biomass and helps retain moisture (Gornall et al. Citation2011). Therefore, mosses should be considered more often when studying the structure of vascular plant communities (Gornall et al. Citation2011). In our study, cattle were negatively associated with bryophyte cover.
Despite significant differences in plant functional group composition for grasslands grazed by cattle in both fjord and coastal areas, the nectar resource indicator value did not differ between landscape and grazer types. This goes against our expectations that nectar values would be higher in coastal sites since more fertile sites in the fjord would have abundant grass biomass at the expense of forbs. Species with large flowers, and thus high nectar volume (Decourtye Citation2018) could compensate for forbs’ low abundance. In a coastal dune system, Fantinato et al. (Citation2018) showed that animal-pollinated species richness (along with overall plant species richness) decreased with abiotic pressures following a distance-to-sea gradient. However, this may not have been correlated with pollination efficiency nor with nectar resource in their study system, as pollinators were more abundant and diverse around pioneer plant communities nearest to the shoreline, where species had larger flowers or inflorescences.
Nectar is the most important energy source for adult pollinators, but pollen is also essential for larval protein supply (Totland Citation2013). The quality of the nectar (such as sugar composition) varies between species but is also influenced by abiotic conditions and the plant development stage. Pollen transfer can also be a relevant indicator (Bartholomée and Lavorel Citation2019), and in fact a wide range of methods exist to measure pollination services, but there is a lack of standardization across studies, limiting comparability. We observed that the nectar resource indicator score was correlated with plant species richness, which is in line with Potts et al. (Citation2003) findings. They also demonstrated an additive influence of both factors on bee community structure.
4.2. Different grazing effects of livestock species
Livestock was included as a variable, either stand-alone or as an interactive term, in every best-fitting model but as a variable within the model was never significant. We did find that coastal sites grazed by sheep had lower forage resource indicator value compared with other grasslands, as indicated in the model results. Interestingly, this result was not supported by a significant difference in plant functional group composition in the model analysis, but the PCA plot implied an association between forbs and the fjord landscape (). This shows the importance of certain species in improving or reducing the forage value without it being reflected at the level of the functional group. We did not find evidence that livestock type would modify grassland plant species richness either. All these findings could be related to the different livestock species’ plant selectivity. Unspecialised grazing will remove the highest biomass from the dominant plants, which generally increases floristic diversity (e.g. Liu et al. Citation2015); cattle are generalist grazers and remove the most biomass per individual. Sheep are more selective than cattle since they have lower calorific needs (Liu et al. Citation2015): they focus their feeding strategy on high-quality plant parts (Celaya et al. Citation2007) instead of plant biomass quantity. Sheep are also more selective than goats and consume a higher amount of forage, while goats tolerate forage items which include a lot of undigestible components such as lignin, i.e. shrubs (Lu Citation1988; Liu et al. Citation2015). Sheep perform better than goats and cattle in areas with low productivity (Celaya et al. Citation2007). In low-productivity areas, the relationship between grazing and species richness changes direction, such that increased grazing in fact depletes species richness (Lezama et al. Citation2014), but our data suggest a stabilising rather than destabilising effect of grazing species on species richness, further evidence for our sites being in the centre or upper part of the global productivity gradient.
Despite significant differences in plant composition for sites grazed by cattle, with lower cover of forbs on coastal sites, the nectar resource indicator value did not differ between livestock types. This goes against our expectations since we hypothesized that grazing would influence the proportion of forbs in the community, which should also have an indirect impact on the nectar value. For example, Cutter et al. (Citation2022) found more abundant floral resources and pollinators under cattle grazing, due to higher diversity and cover of forbs, compared with sheep grazing. In our study, the difference in functional group composition was mainly driven by Poaceae and bryophytes, possibly explained by environmental drivers such as soil type, geography and climatic conditions (McDonald et al. Citation2019). In a location close to our study area, Losvik (Citation2006) found that patches with thick moss layers in hay meadows were associated with high cover of monocotyledons but also with low plant species richness. Livestock trampling also creates local disturbances, and heavy animals such as cattle could substantially reduce the bryophyte layers (Olofsson Citation2009).
Our results are probably indirectly linked with farm management choices: farmers select the livestock type that corresponds to their agricultural objectives, but are probably also influenced by the available resources and productivity potential of their fields. Thus, the stocking density, the length of the yearly grazing period, the size of infields or even the rate of rotations would influence the effect of grazing (Škornik et al. Citation2010; Boavista et al. Citation2019). Even though grazing intensity can be considered low across all of our sites, stocking density was on average higher for cattle (0.28 ± 0.13 per ha) than for sheep (0.14 ± 0.08 per ha) and goats (0.07 ± 0.04 per ha; Kerdoncuff unpublished data). We also learned from the farmers that cattle would graze over shorter seasons (on average 4 months, against 7 months for sheep and goats) and that infields grazed by sheep were usually smaller (on average 4.7 ha, against 7.8 ha and 9.6 ha for cattle and goats, respectively, Kerdoncuff unpublished data). The farmers also superficially treated some of the fields, for example a late-summer ‘tidy-up’ with a flail mulcher, to reduce excessive growth of rank grasses and rushes and this we do not have clear records for. Moreover, the breed genotype also influences diet selection and animal performance (Osoro et al. Citation1999). Bele et al. (Citation2015) showed that for a mountain summer farming landscape in central Norway, the older cattle breeds grazed a smaller area than modern breeds due to different habitat use patterns: both breeds preferred grasses and forbs, but older breeds also consumed shrubs and trees. Traditional breeds tend to be more adaptive, even if the animals select the most productive available habitat. In Nordhordland UNESCO Biosphere Reserve, farmers tend to introduce sheep on sites that have poorer grazing quality, and thus value more rustic breeds such as the Old Norse sheep; three of our sites were grazed by such sheep.
Wild grazers have not been considered in our study. However, we know that extensive grazing on grasslands, no matter the type of grazer, can enhance plant diversity (Hopkins and Holz Citation2006). Indeed, several deer species, and in particular red deer (Cervus elaphus), common in the Nordhordland BR, also participate in keeping west Norwegian habitats open and influence transitions between vegetation types (Wehn et al. Citation2011).
4.3. Interlinked ecosystem services
We did not find a correlation between plant species richness and our calculated forage resource indicator value, unlike Tilman et al. (Citation2001) and Hector et al. (Citation1999). They showed that plant species diversity contributes to forage quality through a wider range of plant biochemical properties and thus nutritional intake of the animals (French Citation2017). Some plant groups such as legumes are particularly rich in proteins. Baumont et al. (Citation2012) showed that high plant species diversity in meadows with a high proportion of non-graminoid species, in particular aromatic plants, improved the quality of animal products, especially dairy products. Other grazing management features, such as grazing intensity or fertilisation, can also affect plant composition and diversity. The effect of grazing intensity on biodiversity may depend on site-specific vegetation characteristics: for example, Scimone et al. (Citation2007) observed that moderate grazing intensity generated higher plant diversity than sites grazed at low intensity, but only for sites with high grass dominance. Low-intensity management increases floristic richness (McDonald et al. Citation2019), but the reported effect on productivity is not consistent throughout the literature. Wehn et al. (Citation2018) found that it promoted the emergence of good-quality hay and allowed animals to select the most nutritious species without impacting their individual performance. However, Marriott et al. (Citation2004) showed that an extensive system with greater floristic diversity reduced animals’ overall uptake through loss in productivity. Loucougaray et al. (Citation2015) observed a trade-off between plant diversity and forage production in mountain grasslands, though without affecting the forage quality.
Trade-offs can therefore be expected between ecosystem services provided by permanent meadows (Wehn et al. Citation2018; Johansen et al. Citation2019). In our study, we actually found a synergy between the nectar and the forage resource values, which means that the more productive grasslands also offered good nectar resources for wild pollinator species. We also showed that the nectar value was correlated with plant species richness. Floral diversity increases bees foraging resource types (Decourtye Citation2018) and extends the pollination period, thus favouring pollinator species richness (Hegland and Boeke Citation2006).
4.4. Methodological considerations
With only 30 sites, our interpretation of the data must be limited, and the chance of Type II error (failing to reject an untrue null hypothesis) is higher than the ideal. However, within-group standard deviation was high, suggesting that small sample size alone does not explain our paucity of significant relationships. There are certainly several explanatory variables that we did not include, but here we focused on the two variables which are of interest: grazing and landscape zone. Other relevant variables certainly contribute to the high level of variability between sites. While drivers of plant species composition depend on the study scale (Siefert et al. Citation2012), at the large scale, the most important factor in semi-natural grasslands in western Norway is the management regime (Auestad et al. Citation2008) which suggests that, of the various site management effects, livestock type is not the strongest and perhaps grazing density would override livestock type effects.
We have demonstrated the application of trait databases to evaluating ecosystem service delivery: from only one dataset, plant community composition, we derived three indicators. However, this approach has limitations, e.g. related to the plant species and their traits, as plants have a wide range of intraspecific variations depending on environmental and climatic conditions (Lee Citation2018). This applies to both nectar resource and fodder digestibility and nutritive potential, the latter especially for grasses. Digestibility is affected by plant functional traits at the community level (e.g. leaf dry matter content), but these traits are influenced by climate and management regime (Gardarin et al. Citation2014) which vary across our study area in a manner that our method could not capture. Furthermore, the phenological stage of the plant influences the nectar quality (Hegland et al. Citation2009), digestibility of the forage and therefore its quality (Baumont et al. Citation2012). It is thus likely that the use of in situ measures of functional traits would have provided a more accurate analysis of both the forage value and the nectar resource quality. The importance of a habitat to supporting a pollinator community is also somewhat more complex to assess than forage provisioning services and it is limiting to rely on nectar quantity only. Future studies should take into consideration flower shape and resource diversity which also contributes to the attractiveness for a diversity of pollinators. Nevertheless, our method demonstrates a way to compare ecosystem service delivery in the absence of resource-intensive, direct measurement of traits such as nectar quantity and digestibility.
Secondly, the role a grassland plays in supporting ecosystem service delivery can depend on species-environment interactions that extend beyond the individual field, and this is especially true for pollination (Martin et al. Citation2019). Norwegian agricultural landscapes display high plant gamma diversity (Hamre et al. Citation2010) which could be threatened by recent trends of land abandonment and farming intensification. For the last 50 years, there has been not only a decrease in the total grassland area in Northern Europe but also a loss of connectivity between remnant patches as their sizes decrease (Jones Citation1988; Aune et al. Citation2018). A comprehensive assessment of pollination service provided by semi-natural grasslands should therefore take into account land use dynamics at landscape scale, including habitat fragmentation.
5. Conclusion and implications for the biosphere reserve management
We studied how livestock types affect vascular plant species richness, nectar resource and forage provision services in the coastal compared with fjord areas of the Nordhordland UNESCO Biosphere Reserve. Contrary to expectations, we did not detect an effect of landscape zone on any of our response variables. Our results for livestock type were challenging to interpret as farming practices are intrinsically related to available forage resources. We found a synergy between forage and nectar resource as opposed to the anticipated trade-off. In this regard, we helped to fill the research gap about the effect of management practices on ecological dynamics, to better understand spatial variation in biodiversity and ecosystem service delivery, and our findings give clues to policymakers and managers for the management of sustainable agricultural landscapes (Henle et al. Citation2008). Key implication points for the BR management are:
Farmers may be adapting their management to their environment and to the resources available on their fields: more productive grasslands will be preferentially grazed by cattle, while less productive areas will be managed by sheep. These management choices appear to preserve the diversity and specificities of the BR cultural landscape. This traditional and heterogeneous grazing regime should be supported.
This low-intensity grazing system, relying on a smooth gradient between traditional and more conventional farming management, offers synergies between ecosystem services rather than trade-offs. The fields we investigated seem to lie on a ‘sweet spot’ on the productivity gradient, where productivity never gets so high that competitive grasses completely outcompete forbs and thus deplete the nectar supply.
There remains a lack of the basic background data and knowledge needed for comprehensive assessments of ecosystem services across the semi-natural grasslands of the Nordhordland BR (Cusens et al. Citation2021, Citation2023), which is facing the challenges of land use change in a transforming society. We found it challenging to assess the effect of landscape context and livestock type on ecosystem service delivery. We could not comprehensively capture the heterogeneity and complexity of environmental gradients induced by the fjord system and the agro-ecological context of western Norway within our narrow temporal and spatial windows (Jones Citation1988; Brown and Allen Citation1989; Hamre et al. Citation2007; Siefert et al. Citation2012; Habel et al. Citation2013; Ketzler et al. Citation2021). Nevertheless, our method demonstrates the capacity to generate three indicators from a single dataset. It may be possible to find other such efficient indicator sets based on key functional traits, which would help in efficiently monitoring biodiversity and ecosystem function dynamics across the agricultural landscape of the Nordhordland BR (Hevia et al. Citation2017; Wehn et al. Citation2018).
This work on western Norway’s grazing systems also needs to be considered in relation to the overall ecosystem services assessment of the BR (Cusens et al. Citation2023). Future research should explore more transdisciplinary approaches, involving farmers and planners well endowed with rich traditional knowledge, in the co-creation of the roadmap for sustainable land management in the Nordhordland BR.
Credit authorship contribution statement
Morgane Demeaux: Formal analysis, Writing – original draft, Writing – review & editing, Visualization. Morgane Kerdoncuff: Formal analysis, Writing – review & editing. Amy Eycott: Conceptualization, Formal analysis, Methodology, Writing – review & editing. Inger Elisabeth Måren: Investigation, Writing – review & editing, Project administration, Funding acquisition.
Supplemental Material
Download PDF (904.9 KB)Acknowledgements
We thank Linn Voldstad for administrative support and logistical organisation, and also our many field assistants for their work. We thank farmers and landowners of the study sites for allowing us to work on their land. We thank Brice Giffard and Thomas Nesme for valuable inputs with this work. We also thank the two anonymous reviewers for constructive critique on earlier versions of this paper.
Disclosure statement
No potential conflict of interest was reported by the author(s).
Data availability statement
The data that support the findings of this study are available from the corresponding author, MD, upon reasonable request.
Supplementary material
Supplemental data for this article can be accessed online at https://doi.org/10.1080/26395916.2024.2311176.
Additional information
Funding
References
- Artsdatabanken. 2018. Norsk Rødliste for naturtyper. https://www.artsdatabanken.no/rodlistefornaturtyper.
- Auestad I, Rydgren K, Økland RH. 2008. Scale-dependence of vegetation-environment relationships in semi-natural grasslands. J Veg Sci. 19(1):139–16. doi: 10.3170/2007-8-18344.
- Aune S, Bryn A, Hovstad KA. 2018. Loss of semi-natural grassland in a boreal landscape: impacts of agricultural intensification and abandonment. J Land Use Sci. 13(4):375–390. doi: 10.1080/1747423X.2018.1539779.
- Bakka E, Kaland PE. 1971. Early farming in Hordaland, Western Norway. Problems and approaches in archaeology and pollen analysis. Nor Archaeol Rev. 4(2):1–17. doi: 10.1080/00293652.1971.9965136.
- Barraclough AD, Reed MG, Coetzer K, Price MF, Schultz L, Moreira-Muñoz A, Måren I. 2023. Global knowledge–action networks at the frontlines of sustainability: insights from five decades of science for action in UNESCO ’s world network of biosphere reserves. People Nat. 5(5):1430–1444. doi: 10.1002/pan3.10515.
- Bartholomée O, Lavorel S. 2019. Disentangling the diversity of definitions for the pollination ecosystem service and associated estimation methods. Ecol Indic. 107(December):105576. doi: 10.1016/j.ecolind.2019.105576.
- Bates D, Machler M, Bolker B, Walker S. 2015. Fitting linear mixed-effects models using Lme4. J Stat Softw. 67(1). doi: 10.18637/jss.v067.i01.
- Batisse M. 1982. The biosphere reserve: a tool for environmental conservation and management. Environ Conserv. 9(2):101–111. doi: 10.1017/S0376892900019937.
- Baude M, Kunin WE, Boatman ND, Conyers S, Davies N, Gillespie MAK, Morton RD, Smart SM, Memmott J. 2016. Historical nectar assessment reveals the Fall and rise of Britain in bloom. Nature. 530(7588):85–88. doi: 10.1038/nature16532.
- Baumont R, Aufrère J, Niderkorn V, Andueza D, Surault F, Delaby L, Pelletier P. 2008. La diversité spécifique dans le fourrage : conséquences sur la valeur alimentaire. Fourrages. 194:189–206. hal-02666789f.
- Baumont R, Picard F, Delmas B, Violleau S, Zapata J, Chabalier C, Torrent A, Piquet, M, Louault, F, Andueza, D, et al. 2012. Production et valeur nutritive des prairies permanentes dans les fermes productrices de fromages AOP du Massif central en France. Fourrages. 209:23–32.
- Bele B, Johansen L, Norderhaug A. 2015. Resource use by old and modern dairy cattle breeds on semi-natural mountain pastures, Central Norway. Acta Agriculturae Scandinavica, Section A — Animal Science. 65(2):73–84. doi: 10.1080/09064702.2015.1070898.
- Boavista LDR, Trindade JPP, Overbeck GE, Müller SC, Fraser L. 2019. Effects of grazing regimes on the temporal dynamics of grassland communities. Appl Veg Sci. 22(2):326–335. doi: 10.1111/avsc.12432.
- Boch S, Kurtogullari Y, Allan E, Lessard-Therrien M, Rieder NS, Fischer M, Martínez De León G, Arlettaz R, Humbert J-Y. 2021. Effects of fertilization and irrigation on vascular plant species richness, functional composition and yield in mountain grasslands. J Environ Manage. 279(February):111629. doi: 10.1016/j.jenvman.2020.111629.
- Bolker BM, Brooks ME, Clark CJ, Geange SW, Poulsen JR, Stevens MHH, White J-S-S. 2009. Generalized linear mixed models: a practical guide for ecology and evolution. Trends Ecol Evol. 24(3):127–135. doi: 10.1016/j.tree.2008.10.008.
- Bommarco R, Lundin O, Smith HG, Rundlöf M. 2012. Drastic historic shifts in bumble-bee community composition in Sweden. Proc R Soc B. 279(1727):309–315. doi: 10.1098/rspb.2011.0647.
- Brown BJ, Allen TFH. 1989. The importance of scale in evaluating herbivory impacts. Oikos. 54(2):189–194. JSTOR. doi:10.2307/3565265.
- Celaya R, Oliván M, Ferreira LMM, Martínez A, García U, Osoro K. 2007. Comparison of grazing behaviour, dietary overlap and performance in non-lactating domestic ruminants grazing on marginal heathland areas. Livest Sci. 106(2):271–281. doi: 10.1016/j.livsci.2006.08.013.
- Cusens J, Barraclough AMD, Måren IE. 2021 Nov. Participatory mapping reveals biocultural and nature values in the shared landscape of a Nordic UNESCO biosphere reserve. People Nat. 4(2):365–381. pan3.10287. doi:10.1002/pan3.10287.
- Cusens J, Barraclough AD, Måren IE. 2023. Integration matters: combining socio-cultural and biophysical methods for mapping ecosystem service bundles. Ambio. 52(6):1004–1021. doi: 10.1007/s13280-023-01830-7.
- Cutter J, Hovick T, McGranahan D, Harmon J, Limb R, Spiess J, Geaumont B. 2022. Cattle grazing results in greater floral resources and pollinators than sheep grazing in low-diversity grasslands. Ecol Evol. 12(1):e8396. doi: 10.1002/ece3.8396.
- Davis KF, Yu K, Herrero M, Havlik P, Carr JA, D’Odorico P. 2015. Historical trade-offs of Livestock’s environmental impacts. Environ Res Lett. 10(12):125013. doi: 10.1088/1748-9326/10/12/125013.
- Decourtye A. 2018. Les Abeilles, Des Ouvrières à Protéger. Paris, France: Editions France agricole.
- Dornbush ME, Wilsey BJ. 2010. Experimental manipulation of soil depth alters species richness and Co-occurrence in restored tallgrass prairie. J Ecol. 98(1):117–125. doi: 10.1111/j.1365-2745.2009.01605.x.
- Fantinato E, Del Vecchio S, Silan G, Buffa G. 2018. Pollination networks along the sea-inland gradient reveal landscape patterns of keystone plant species. Sci Rep. 8(1):15221. doi: 10.1038/s41598-018-33652-z.
- Farruggia A, Martin B, Baumont R, Prache S, Doreau M, Hoste H, Durand D. 2008. Quels intérêts de la diversité floristique des prairies permanentes pour les ruminants et les produits animaux ? INRA Prod Anim. 21(2):181–200. doi: 10.20870/productions-animales.2008.21.2.3391.
- ‘Food and Agriculture Organisation of the United Nations’. 2023. License: CC BY-NC-SA 3.0 IGO. FAOSTAT. https://www.fao.org/faostat/en/#data/RL.
- Fraser LH, Pither J, Jentsch A, Sternberg M, Zobel M, Askarizadeh D, Bartha S, Beierkuhnlein C, Bennett JA, Bittel A, et al. 2015. Worldwide evidence of a unimodal relationship between productivity and plant species richness. Sci. 349(6245):302–305. doi:10.1126/science.aab3916.
- French KE. 2017. Species composition determines forage quality and medicinal value of high diversity grasslands in Lowland England. Agr Ecosyst Environ. 241(April):193–204. doi: 10.1016/j.agee.2017.03.012.
- Gardarin A, Garnier É, Carrère P, Cruz P, Andueza D, Bonis A, Colace M-P, Dumont B, Duru M, Farruggia A, et al. 2014. Plant trait–digestibility relationships across management and climate gradients in permanent grasslands. J Appl Ecol. 51(5):1207–1217. doi:10.1111/1365-2664.12293.
- Gornall JL, Woodin SJ, Jónsdóttir IS, van der Wal R. 2011. Balancing positive and negative plant interactions: how mosses structure vascular plant communities. Oecologia. 166(3):769–782. doi: 10.1007/s00442-011-1911-6.
- Guthery FS, Burnham KP, Anderson DR. 2003. Model selection and multimodel inference: a practical information-theoretic approach. J Wildl Manage. 67(3):655. doi: 10.2307/3802723.
- Habel JC, Dengler J, Janišová M, Török P, Wellstein C, Wiezik M. 2013. European grassland ecosystems: threatened hotspots of biodiversity. Biodivers Conserv. 22(10):2131–2138. doi: 10.1007/s10531-013-0537-x.
- Hamre LN, Domaas ST, Austad I, Rydgren K. 2007. Land-cover and structural changes in a Western Norwegian cultural landscape since865, based on an old cadastral map and a field survey. Landsc Ecol. 22(10):1563–1574. doi: 10.1007/s10980-007-9154-y.
- Hamre LN, Halvorsen R, Edvardsen A, Rydgren K. 2010. Plant species richness, composition and habitat specificity in a Norwegian agricultural landscape. Agr Ecosyst Environ. 138(3):189–196. doi: 10.1016/j.agee.2010.04.018.
- Hector A, Schmid B, Beierkuhnlein C, Caldeira MC, Diemer M, Dimitrakopoulos PG, Finn JA, Freitas H, Giller PS, Good J. 1999. Plant diversity and productivity experiments in European grasslands. Sci. 286(5442):1123–1127. doi: 10.1126/science.286.5442.1123.
- Hegland SJ, Boeke L. 2006. Relationships between the density and diversity of floral resources and flower visitor activity in a temperate grassland community. Ecol Entomol. 31(5):532–538. doi: 10.1111/j.1365-2311.2006.00812.x.
- Hegland SJ, Nielsen A, Lázaro A, Bjerknes AL, Totland Ø. 2009. How does climate warming affect plant‐pollinator interactions? Ecol Lett. 12(2):184–195. doi: 10.1111/j.1461-0248.2008.01269.x.
- Henle K, Alard D, Clitherow J, Cobb P, Firbank L, Kull T, McCracken D, Moritz RFA, Niemelä J, Rebane M, et al. 2008. Identifying and managing the conflicts between agriculture and biodiversity conservation in Europe–a review. Agric Ecosyst Environ. 124(1):60–71. doi:10.1016/j.agee.2007.09.005.
- Hevia V, Martín-López B, Palomo S, García-Llorente M, de Bello F, González JA. 2017. Trait-based approaches to analyze links between the drivers of change and ecosystem services: synthesizing existing evidence and future challenges. Ecol Evol. 7(3):831–844. doi: 10.1002/ece3.2692.
- Hjelle KL, Halvorsen LS, Prøsch-Danielsen L, Sugita S, Paus A, Kaland PE, Mehl IK, Overland A, Danielsen R, Høeg HI, et al. 2018. Long-term changes in regional vegetation cover along the West Coast of Southern Norway: the importance of human impact. J Veg Sci. 29(3):404–415. doi:10.1111/jvs.12626.
- Hjelle KL, Hufthammer AK, Bergsvik KA. 2006. Hesitant hunters: a review of the introduction of agriculture in Western Norway. Environmental Archaeology. 11(2):147–170. doi: 10.1179/174963106x123188.
- Hopkins A, Holz B. 2006. Grassland for agriculture and nature conservation: production, quality and multi-functionality. Agron Res. 4(1):3–20.
- IPBES. 2019. Global assessment report of the intergovernmental science-policy platform on biodiversity and ecosystem services. In: Brondizio E, Settele J, Díaz S, and Ngo HT, editors. Bonn, Germany: IPBES Secretariat. doi: 10.5281/zenodo.3831673.
- Isselstein J, Jeangros B, Pavlu V. 2005. Agronomic aspects of biodiversity targeted management of temperate grasslands in Europe – a review. Agron Res. 3:139–151.
- Johansen L, Taugourdeau S, Hovstad KA, Wehn S. 2019. Ceased grazing management changes the ecosystem services of semi-natural grasslands. Ecosyst People. 15(1):192–203. doi: 10.1080/26395916.2019.1644534.
- Jones M. 1988. Land-tenure and landscape change in fishing communities on the outer coast of Central Norway, c.880 to the present. Geogr Ann Ser B. 70(1):197–204. doi: 10.1080/04353684.1988.11879564.
- Kaland PE, Barlaup BT, Bjørge L, Brattegard T, Breistøl A, Brekke NG, Isdal K, Johannessen, A, Mangerud, J, Kvamme, M, et al. 2018. Nordhordland biosphere reserve UNESCO application. The Norwegian Environment Agency [Miljødirektoratet].
- Ketzler G, Römer W, Beylich AA. 2021. The climate of Norway. In: Beylich AA, editor. Landscapes and landforms of Norway. World geomorphological landscapes. Cham: Springer. doi: 10.1007/978-3-030-52563-7_2.
- Klanderud K, Vandvik V, Goldberg D, Armas C. 2015. The importance of biotic vs. Abiotic drivers of local plant community composition along regional bioclimatic gradients. PloS One. 10(6):e0130205. doi: 10.1371/journal.pone.0130205.
- Låg J. 1987. Innvirkning På Planteveksten Av Naturfaktorer Og Menneskelige Inngrep i Typiske Norske Kystområder. https://nibio.brage.unit.no/nibio-xmlui/bitstream/handle/11250/2489937.
- Låg J, Landbrukshogskole N. 1983. Soil map Norway - Jordbunnskart. Soil map. Nasjonalatlas for Norge.
- Lee MA. 2018. A global comparison of the nutritive values of forage plants grown in contrasting environments. J Plant Res. 131(4):641–654. doi: 10.1007/s10265-018-1024-y.
- Lezama F, Baeza S, Altesor A, Cesa A, Chaneton EJ, Paruelo JM, De Cáceres M. 2014. Variation of grazing-induced vegetation changes across a large-scale productivity gradient. J Veg Sci. 25(1):8–21. doi: 10.1111/jvs.12053.
- Liu J, Feng C, Wang D, Wang L, Wilsey BJ, Zhong Z. 2015. Impacts of grazing by different large herbivores in grassland depend on plant species diversity. J Appl Ecol. 52(4):1053–1062. doi:10.1111/1365-2664.12456. Edited by J Firn.
- Losvik MH. 1993. Hay meadow communities in Western Norway and relations between vegetation and environmental factors. Nord J Bot. 13(2):195–206. doi: 10.1111/j.1756-1051.1993.tb00036.x.
- Losvik MH. 2006. Thick moss layers and high cover of grasses: potential threats to herb diversity in hay meadows in Norway. Norsk Geografisk Tidsskrift - Nor J Geogr. 60(4):312–316. doi: 10.1080/00291950601040276.
- Loucougaray G, Dobremez L, Gos P, Pauthenet Y, Nettier B, Lavorel S. 2015. Assessing the effects of grassland management on forage production and environmental quality to identify paths to ecological intensification in mountain grasslands. Environ Manage. 56(5):1039–1052. doi: 10.1007/s00267-015-0550-9.
- Lu CD. 1988. Grazing behavior and diet selection of goats. Small Ruminant Res. 1(3):205–216. doi: 10.1016/0921-4488(88)90049-1.
- Marriott CA, Fothergill M, Jeangros B, Scotton M, Louault F. 2004. Long-term impacts of extensification of grassland management on biodiversity and productivity in upland areas. A review. Agronomie. 24(8):447–462. doi: 10.1051/agro:2004041.
- Martin EA, Dainese M, Clough Y, Báldi A, Bommarco R, Gagic V, Garratt MPD, Holzschuh A, Kleijn D, Kovács‐Hostyánszki A, et al. 2019. The interplay of landscape composition and configuration: new pathways to manage functional biodiversity and agroecosystem services across Europe. Ecol Lett. 22(7):1083–1094. doi:10.1111/ele.13265.
- McDonald SE, Reid N, Smith R, Waters CM, Hunter J, Rader R. 2019. Rotational grazing management achieves similar plant diversity outcomes to areas managed for conservation in a semi-arid rangeland. Rangel J. 41(2):135–145. doi: 10.1071/RJ18090.
- Mehl IK, Overland A, Hjelle KL. 2015. Cultural landscape development on a west-east gradient in Western Norway - potential of the landscape reconstruction algorithm (LRA). J Archaeol Sci. 61:16. doi: 10.1016/j.jas.2015.04.015.
- Melin E. 2015. Botanique Apicole. Université de Liège: Ecole d’Apiculture de la Région wallonne & Institut de Botanique.
- Millennium Ecosystem Assessment (Program), editors. 2005. Ecosystems and human well-being: synthesis. Washington, DC: Island Press.
- Moen A. 1998. Nasjonalatlas for Norge: Vegetasjon. Hønefoss: Statens Kartverk.
- NIJOS. 2011. Verdivurdering Av Landskap i Hordaland Fylke. Ås, Norge: Norsk institutt for jord- og skogkartlegging. Aurland Naturverkstad; p. 7.
- Oksanen J, Simpson GL, Blanchet FG, Kindt R, Legendre P, Minchin PR, O’Hara RB, Solymos P, Stevens MHH, Szoecs E, et al. 2022. Vegan: community ecology package. https://CRAN.R-project.org/package=vegan.
- Olofsson J. 2009. Effects of simulated reindeer grazing, trampling, and waste products on nitrogen mineralization and primary production. Arctic, Antarctic, Alpine Res. 41(3):330–338. doi: 10.1657/1938-4246-41.3.330.
- Osoro K, Oliván M, Celaya R, Martínez A. 1999. Effects of genotype on the performance and intake characteristics of sheep grazing contrasting hill vegetation communities. Anim Sci. 69(2):419–426. doi: 10.1017/S1357729800050992.
- Plantureux S, Amiaud B. 2010. E-FLORA-Sys, a website tool to evaluate agronomical and environmental value of grasslands. Proceedings of the 23rd General Meeting of the European Grassland Federation; Kiel, Germany. p. 732–734.
- Potts SG, Vulliamy B, Dafni A, Ne’eman G, Willmer P. 2003. Linking bees and flowers: how do floral communities structure pollinator communities? Ecology. 84(10):2628–2642. doi: 10.1890/02-0136.
- Pykälä J. 2003. Effects of restoration with cattle grazing on plant species composition and richness of semi-natural grasslands. Biodivers Conserv. 12(11):2211–2226. doi: 10.1023/A:1024558617080.
- R Core Team. 2022. R: a language and environment for statistical computing. Vienna, Austria: R Foundation for Statistical Computing. https://www.R-project.org/.
- Sauer D, Sponagel H, Sommer M, Giani L, Jahn R, Stahr K. 2007. Podzol: soil of the Year 2007. A review on its genesis, occurrence, and functions. J Plant Nutr Soil Sci. 170(5):581–597. doi: 10.1002/jpln.200700135.
- Scimone M, Rook AJ, Garel JP, Sahin N. 2007. Effects of livestock breed and grazing intensity on grazing systems: 3. Effects on diversity of vegetation. Grass Forage Sci. 62(2):172–184. doi: 10.1111/j.1365-2494.2007.00579.x.
- Siefert A, Ravenscroft C, Althoff D, Alvarez‐Yépiz JC, Carter BE, Glennon KL, Heberling JM, Jo IS, Pontes A, Sauer A, et al. 2012. Scale dependence of vegetation–environment relationships: a meta‐analysis of multivariate data. J Veg Sci. 23(5):942–951. doi:10.1111/j.1654-1103.2012.01401.x.
- Škornik S, Vidrih M, Kaligarič M. 2010. The effect of grazing pressure on species richness, composition and productivity in North Adriatic Karst pastures. Plant Biosyst - Int J Dealing Aspects Plant Biosyst. 144(2):355–364. doi: 10.1080/11263501003750250.
- Smit HJ, Metzger MJ, Ewert F. 2008. Spatial distribution of grassland productivity and land use in Europe. Agric Syst. 98(3):208–219. doi: 10.1016/j.agsy.2008.07.004.
- Socher S, Prati D, Boch S, Müller J, Baumbach H, Gockel S, Andreas H, Schöning I, Wells K, Buscot F, et al. 2013. Interacting effects of fertilization, mowing and grazing on plant species diversity of500 grasslands in Germany differ between regions. Basic Appl Ecol. 14(2):126–136. doi:10.1016/j.baae.2012.12.003.
- Statistisk sentralbyrå [Statistics Norway]. 2020a. Livestock grazing on outfield pastures (M)995 - 2020. SSB. https://www.ssb.no/en/system/.
- Statistisk sentralbyrå [Statistics Norway]. 2020b. Livestock Husbandry. SSB. https://www.ssb.no/en/jord-skog-jakt-og-fiskeri/jordbruk/statistikk/husdyrhald.
- Steinfeld H, Gerber P, Wassenaar TD, Castel V, Rosales M, Rosales MM, de Haan C, FAO. 2006. Livestock’s long shadow: environmental issues and options. Rome, Italy: Food & Agriculture Organisation of the United Nations.
- Steinshamn H, Grøva L, Adler SA, Brunberg E, Lande US. 2018. Effects of grazing abandoned grassland on herbage production and utilization, and sheep preference and performance. Front Environ Sci. 6(May):33. doi: 10.3389/fenvs.2018.00033.
- Stevens CJ, Duprè C, Dorland E, Gaudnik C, Gowing DJG, Bleeker A, Diekmann M, Alard D, Bobbink R, Fowler D, et al. 2011. The impact of nitrogen deposition on acid grasslands in the Atlantic region of Europe. Environ Pollut, Nitrogen Deposition, Crit Loads Biodivers. 159(10):2243–2250. doi:10.1016/j.envpol.2010.11.026.
- Sydenham MAK, Eldegard K, Venter ZS, Evju M, Åström J, Rusch GM. 2022. Priority maps for pollinator habitat enhancement schemes in semi-natural grasslands. Landsc Urban Plan. 220(April):104354. doi: 10.1016/j.landurbplan.2022.104354.
- Terres JM, Scacchiafichi LN, Wania A, Ambar M, Anguiano E, Buckwell A, Coppola A, Gocht A, Källström HN, Pointereau P, et al. 2015. Farmland abandonment in Europe: identification of drivers and indicators, and development of a composite indicator of risk. Land Use Policy. 49(December):20–34. doi:10.1016/j.landusepol.2015.06.009.
- Tilman D, Reich PB, Knops J, Wedin DA, Mielke T, Lehman C. 2001. Diversity and productivity in a long-term grassland experiment. Sci. 294(5543):843–845. doi: 10.1126/science.1060391.
- Totland Ø. 2013. The state of knowledge about insect pollination in Norway – the importance of the complex interaction between plants and insects. Trondheim, Norway: Norwegian Biodiversity Information Centre.
- UNESCO. 2017. A new roadmap for the Man and the Biosphere (MAB) programme and its world network of biosphere reserves. France. https://unesdoc.unesco.org/ark:/48223/pf0000247418.locale=en.
- United Nations. 2015. Man and the Biosphere (MAB) programme strategy for the period 2015-2025. Paris. https://unesdoc.unesco.org/ark:/48223/pf0000234624.locale=en.
- Wehn S, Burton R, Riley M, Johansen L, Hovstad KA, Rønningen K. 2018. Adaptive biodiversity management of Semi-Natural Hay Meadows: the case of west-norway. Land Use Policy. 72(March):259–269. doi: 10.1016/j.landusepol.2017.12.063.
- Wehn S, Hovstad KA, Johansen L. 2018. The relationships between biodiversity and ecosystem services and the effects of grazing cessation in semi-natural grasslands. Web Ecol. 18(1):55–65. doi: 10.5194/we-18-55-2018.
- Wehn S, Pedersen B, Hanssen SK. 2011. A comparison of influences of cattle, goat, sheep and reindeer on vegetation changes in mountain cultural landscapes in Norway. Landsc Urban Plan. 102(3):177–187. doi: 10.1016/j.landurbplan.2011.04.003.
- Wickham H. 2016. Ggplot2: elegant graphics for data analysis. Switzerland: Springer.
- Xiao B, Hu K, Ren T, Li B. 2016. Moss-dominated biological soil crusts significantly influence soil moisture and temperature regimes in semiarid ecosystems. Geoderma. 263(February):35–46. doi: 10.1016/j.geoderma.2015.09.012.
- Yazdi MM 2013. ‘Topsis: TOPSIS method for Multiple-Criteria Decision Making (MCDM). R package version.0.’ https://CRAN.R-project.org/package=topsis.
- Yoon KP, Hwang C-L. 1995. Multiple attribute decision making: an introduction. California: SAGE Publications.
- Zouhaier B, Mariem M, Mokded R, Rouached A, Alsane K, Chedly A, Abderrazek S, Abdallah A. 2016. Physiological and biochemical responses of the forage legume Trifolium alexandrinum to different saline conditions and nitrogen levels. J Plant Res. 129(3):423–434. doi: 10.1007/s10265-016-0791-6.