
ABSTRACT
Continued pressure and transformation of land-use by humans are key drivers of biodiversity and ecosystem services (ES) loss. To determine the sustainability of possible future land-use practices, it is important to anticipate likely future changes to biodiversity and ES. This can help stakeholders and decision-makers to understand and assess the viability of current development policies and design alternative future pathways. Focusing on a biodiversity hotspot in southwestern Ethiopia, we considered four future land-use scenarios (namely: ‘Gain over grain’, ‘Coffee and conservation’, ‘Mining green gold’ and ‘Food first’ scenarios) that were developed in an earlier project via participatory scenario planning. We modelled and mapped the spatial distribution of six ES (erosion control, carbon storage, coffee production, crop production, livestock feed, and woody-plant richness) for the current landscape and the four scenarios. Our results show that potential ES changes differed strongly across the scenarios. Changes were strongest for land-use scenarios involving large-scale agricultural intensification; and changes were not uniformly distributed across the landscape. Smallholder farmers specializing on cash crops (‘Gain over grain’ scenario) would likely cause little change to ES generation, but major losses in ES would result from expanding either food or coffee production (‘Mining green gold’ and ‘Food first’). Finally, the ‘Coffee and conservation’ scenario appears to be the most sustainable scenario because it would secure diverse ES for the long term. Our findings provide valuable input for decision-makers and stakeholders and could help to identify sustainable land-use options.
Key policy highlights
Land-use scenarios involving large-scale agricultural intensification, whether for food crops or cash crops, are likely to lead to loss of other potential ecosystem services.
Land-use scenarios that involve an integrative approach of food production and biodiversity conservation, such as the ‘Coffee and conservation’ scenario, can secure diverse ecosystem services in the long run.
Integrative land use development can also be more beneficial for the local community and for environmental resilience.
Potential ecosystem service maps of land-use scenarios can support decision-makers and stakeholders in their planning for the future of the landscape by illustrating the plausible effects of land-use scenarios on ecosystem services at both landscape scale and kebele level.
EDITED BY:
1. Introduction
Continued pressure and transformation of land-use by humans are key drivers of the loss and degradation of both biodiversity and ecosystem services (ES) (Sala et al. Citation2000; Foley et al. Citation2005; Díaz et al. Citation2019). Quantifying and understanding land-use change and its spatiotemporal dynamics is critical in tackling sustainability challenges (Winkler et al. Citation2021). To determine the sustainability of future land-use practices, it is important to identify plausible future changes that could help stakeholders and decision-makers to understand and assess the implications of current development policies and design alternative future pathways (FAO Citation2023). Specifically, analyzing the effects of future land-use change on ES could contribute to improved decision-making related to ecological and human wellbeing that are fundamental to sustainable development (Schirpke et al. Citation2020).
Land-use models can support societal visioning processes by sketching out the spatially explicit outcomes of alternative management objectives and quantifying the synergies and tradeoffs associated with land-use change (Verburg et al. Citation2015; Bürgi et al. Citation2022). Typically, maximization of provisioning ES generated from intensively managed agricultural landscapes has been found to be negatively correlated with the provision of other types of ES and biodiversity conservation, indicating strong tradeoffs (e.g. Raudsepp-Hearne et al. Citation2010; Seppelt et al. Citation2013; Schirpke et al. Citation2020). In contrast, less-intensified agricultural landscapes aim to minimize this tradeoff through a spatially integrated production of provisioning ES and other ES or biodiversity conservation (Fischer et al. Citation2013; Kremen Citation2015; Mehrabi et al. Citation2018).
Land-use changes vary geographically. For instance, while increases in forest cover and cropland abandonment are major drivers of land-use change in parts of Europe, deforestation and agricultural expansion are major drivers in the global south (Hua et al. Citation2018; Winkler et al. Citation2021; Meyfroidt et al. Citation2022). As in many countries in the global south, in Ethiopia, agricultural landscapes provide multiple ES that directly contribute to the livelihoods of local people but are under constant pressure from population growth, deforestation, tenure insecurity, forest land grabbing, land-use conflicts, and large-scale land transfers to investors (e.g. Taddese Citation2001; Rahmato Citation2011; Rodrigues et al. Citation2021). Rapid land-use change is threatening these landscapes and their ES multifunctionality, which is crucial for human well-being (Rasmussen et al. Citation2018; Shumi et al. Citation2019). Different studies have attempted to analyze the impact of LULC change on ES based on historical and current spatial datasets (Tolessa et al. Citation2017; Abera et al. Citation2021). However, an outlook into the future to understand possible changes in ES in Ethiopia is still lacking. This gap can be addressed by using social-ecological land-use scenarios (hereafter land-use scenarios) generated through participatory scenario planning.
Participatory scenario planning – in which scenarios are co-designed with local stakeholders – captures local realities based on the knowledge of stakeholders (Peterson et al. Citation2003; Henrichs et al. Citation2010). Comparative scenario analysis then provides a rational and reflected basis for improved decision-making and for exploring alternative development pathways and policy options (Alcamo et al. Citation2008; Henrichs et al. Citation2010). For our study, we used four land-use scenarios (namely: ‘Gain over grain’, ‘Coffee and conservation’, ‘Mining green gold’ and ‘Food first’ scenarios – a brief summary of each scenario is given in methods section) developed for southwestern Ethiopia via participatory scenario planning (Jiren et al. Citation2020). In a first step, the narrative scenarios were translated into spatially explicit maps by Duguma et al. (Citation2022). In this contribution, we build on these maps and analyze the potential supply of six ES under the different scenarios of land-use change – one supporting service (woody-plant richness), two regulating services (erosion control and carbon storage), and three provisioning services (coffee production, crop production, and livestock feed).
Our approach involved mapping the spatial distribution of the potential supply of these ES for the current landscape as well as for the four land-use scenarios in order to understand the effect of land-use change on potential ES. We use the term ‘potential supply of ES’ to mean the full potential of ecological functions or biophysical elements within the ecosystem, which is broadly comparable to natural capital stocks (Martinez-Harms and Balvanera Citation2012; Burkhard et al. Citation2014; Vihervaara et al. Citation2017). We analyzed changes at the landscape scale and at the level of the smallest administrative unit in Ethiopia (the ‘kebele’ level), which is an important social-ecological unit for land-use planning. The kebele level is where government policies are implemented, and where development agents work with communities for activities such as soil and water conservation or tree planting (Wiegant et al. Citation2022). Kebeles in our study area typically contain approximately 500 households (Rodrigues et al. Citation2018; Duguma et al. Citation2022) and have an average area of approximately 30 km2. Comparing the outcomes of ES under alternative land-use scenarios can help to evaluate management strategies and identify desirable and undesirable impacts that could benefit or harm both people and ecosystems. As such, the findings can be useful input for local stakeholders and decision-makers.
2. Methods
2.1. Study area
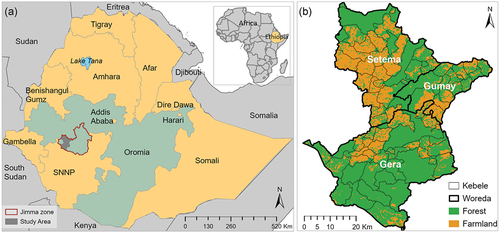
Our study focused on a landscape in southwestern Ethiopia (), which is part of the Eastern Afromontane biodiversity hotspot (Mittermmeier et al. Citation2011), and the origin of coffee Arabica (Senbeta and Denich Citation2006). The landscape is dominated by smallholder farmers whose dominant economic activities and livelihoods are dependent on subsistence farming, coffee production, livestock production, and forest-based ESs (Tadesse et al. Citation2014; Schultner et al. Citation2021; Shumi et al. Citation2021). The study area has undulating topography ranging between approximately 1200 and 3000 m above sea level.
Figure 1. (a) the study area in Jimma Zone (grey), Oromia region (green grey) within Ethiopia (other regions are tan-colored); (b) the district boundaries (woredas; delimited by a thick black line and labelled in white) and lower administrative boundaries (kebeles; thin black lines) in the study area. The underlying land cover map illustrates the distribution of forest and farmland (adapted from Duguma et al. Citation2022).
2.2. The scenarios
The scenario development process for our study landscape considered social, economic and environmental variables (Jiren et al. Citation2020). Briefly, participatory scenario planning workshops were conducted to envision landscape change up to 2040 with 35 broadly representative stakeholders that included local people and community-level organizations, governmental organizations from multiple sectors, nongovernmental organizations, and civil society organizations from different levels of government and in different rounds (Jiren et al. Citation2018, Citation2020). The scenario development process resulted in four qualitative narrative scenarios (‘Gain over grain’, ‘Mining green gold’, ‘Coffee and conservation’, and ‘Food first’) that are briefly summarized in . These narrative scenarios were translated into spatially explicit LULC maps based on a baseline map of current LULC and translation rules, which were established using variables indicated in the narrative scenarios. To that end, land cover change was modelled using a combination of current land cover classes, additional biophysical information (such as slope, heterogeneity and altitude) and distance from forest edge using the proximity-based scenario generator of the Integrated Valuation of Ecosystem Services and Tradeoffs (InVEST) software (Sharp et al. Citation2018). Details of the translation process can be found in Duguma et al. (Citation2022).
Table 1. Brief summaries of social-ecological scenarios for southwestern Ethiopia for the year 2040 (for details see Jiren et al. Citation2020; Duguma et al. Citation2022).
2.3. LULC mapping
For the current landscape (baseline), we mapped six main LULC classes from 10-m resolution Sentinel-2 satellite imagery using supervised image classification (Duguma et al. Citation2022). The main land-use land cover classes identified were woody vegetation, arable land, pasture, cultivated wetland, grazed wetland, and settlement. These thematic classes were further refined into 12 classes using additional criteria such as slope, farmland heterogeneity, altitude, and distance from the forest edge. Using these additional criteria, we refined our LULC classes and added coffee plantations, eucalyptus plantations, khat, and fruits and vegetables. Woody vegetation was classified into forest (patches >1 ha) versus farmland woody vegetation (patches <1 ha). The additional land cover classes were created to match the land-uses that emerged from the participatory scenarios. To generate plausible future land-use maps, we used the baseline map together with translation rules and the InVEST proximity-based scenario generator (Sharp et al. Citation2018) (for details, see Duguma et al. Citation2022). All spatial processing and analysis (such as classification and mapping) outlined in this manuscript was undertaken using ArcGIS Pro (Esri Citation2023).
2.4. Quantifying and mapping ES
There are several ways of quantifying and mapping ES (e.g. Costanza et al. Citation1997; Maes et al. Citation2012; Martinez-Harms and Balvanera Citation2012). We focused on the measurement of ES in biophysical units, because our goal was to map and quantify the potential supply of ES rather than specific benefits or values associated with ES. We understand that the benefits and values of ES can provide useful additional information for decision-makers (e.g. Bagstad et al. Citation2013; Boerema et al. Citation2017; Vihervaara et al. Citation2017); however, modeling potential supply is a necessary first step.
We focused on six ESs: woody-plant richness (a supporting ES), erosion control and carbon storage (two regulating ES), and coffee production, crop production, and livestock feed (three provisioning ES) (Table S1). For each ES, we modelled its biophysical potential for the baseline and for each of the four scenarios. We chose these ES based on spatial data availability (e.g. in relation to LULC data or a Digital Elevation Model (DEM)), and taking into account the main changes in the different scenarios. We did not include specific cultural ES because of a lack of data availability; but we note that traditional cultural ES for the local community are often closely related to the occurrence of woody-plants (Megerssa and Kassam Citation2020; Shumi et al. Citation2021). Studies elsewhere also showed that cultural ES are correlated with supporting services (e.g. Raudsepp-Hearne et al. Citation2010; Turner et al. Citation2014). Changes in woody-plant richness therefore may also indicate possible changes in at least some traditional cultural services like ritual celebration or as cultural flagship species (Megerssa and Kassam Citation2020).
2.4.1. Erosion control
To map erosion control, we used InVEST 3.8.2 software from the Natural Capital Project (Sharp et al. Citation2018). The Sediment Delivery Ratio (SDR) of the InVEST model is similar to the Revised Universal Soil Loss Equation model (Sharp et al. Citation2018; Sahle et al. Citation2019; Abera et al. Citation2021). We used SDR to estimate avoided erosion export, which specifically shows the contribution of vegetation to keeping soil from eroding from each pixel. Briefly, the SDR model draws on the input parameters DEM, rainfall erosivity, soil erodibility, LULC, and biophysical information related to LULC that is containing a crop management factor (C) as well as possible support practices (P) (data sources for each input variables are indicated in Tables S2, S3 and S4). Details of how the InVEST SDR model works are described in the model documentation (Sharp et al. Citation2018).
2.4.2. Carbon storage
To map carbon storage, we used the InVEST Carbon Storage and Sequestration model – which uses maps of LULC along with stocks in four carbon pools (aboveground biomass, belowground biomass, soil and dead organic matter) to estimate the amount of carbon currently stored in a landscape (Sharp et al. Citation2018; Sahle et al. Citation2019; Benra et al. Citation2021). Data on carbon pools were collected from published material on our study area and from nearby areas that have similar characteristics to our region, mostly in other parts of southwestern Ethiopia (e.g. Tadesse et al. Citation2014; Abegaz et al. Citation2020; Abera et al. Citation2021, for details see ). The InVEST model aggregates the amount of carbon stored in these pools according to land-use maps to estimate the net amount of carbon storage potential of each scenario (Sharp et al. Citation2018; Sahle et al. Citation2019).
Table 2. Carbon pools (tons/ha) used for LULCs. (Abbreviations: c_above = above ground carbon, c_below = below ground carbon, c_soil = carbon in soil, c_dead = carbon in dead organic matter).
2.4.3. Woody-plant richness
Woody-plant species were surveyed in 72 farmland sites and 108 forest sites in 20 m × 20 m quadrants (Shumi et al. Citation2018, Citation2019). From this dataset, total woody-plant species richness (hereafter woody-plant richness) was calculated, modelled using baseline predictor variables, and spatially projected for the entire study area for the baseline and scenario conditions (Duguma et al. Citation2023). We used the mean value of these spatially predicted maps for woody-plant richness. Woody-plant richness constitutes a useful proxy of supporting ES because a lot of biodiversity in southwestern Ethiopia is directly linked to native tree diversity (Tadesse et al. Citation2014; Schultner et al. Citation2021; Shumi et al. Citation2021). Moreover, woody-plant richness could also be an indirect indicator of cultural services, because different trees and shrubs are valued by the local people in ritual celebration, as symbolic features, or as cultural flagship species (Megerssa and Kassam Citation2020).
2.4.4. Crop production
To quantify and map crop production, first, we identified the three most important crops in the landscape through fieldwork – these were teff, maize, and sorghum (Manlosa et al. Citation2019). Second, we used the latest productivity data (Table S5) available for the three crops in the study area (Central Statistical Agency (CSA) Citation2018b; Belachew et al. Citation2022) and weighted each of the crop productivities based on the number of field plots collected for 72 randomly selected households (Manlosa et al. Citation2019) (i.e. teff accounted for 42% of fields, and so was assigned a productivity weight of 0.42, maize accounted for 29%, and sorghum 15%) to get weighted crop productivity. Third, we multiplied the weighted productivity by area of arable land (i.e. cropland) in each kebele for the baseline and scenarios, respectively, to estimate total crop production for each kebele.
2.4.5. Coffee production
Similar to crop production, coffee production was also estimated at the kebele level based on LULC maps. For the baseline landscape, we used coffee productivity estimates (Table S5, Central Statistical Agency (CSA) (Citation2018b)), which represents productivity values for smallholder farmers. This was also used for the projection of coffee productivity for three scenarios in which coffee continued to be grown by smallholders (‘Gain over grain’, ‘Coffee and conservation’, and ‘Food first’). For the ‘Mining green gold’ scenario, we used estimates of coffee productivity from existing coffee plantations within our study region (Zewdie et al. Citation2022). Coffee productivity remained constant between 2011 and 2020 (Belachew et al. Citation2022). Hence, we also assumed no increase in coffee productivity in these scenarios. Coffee production per kebele was estimated by multiplying the potential coffee area of a given kebele (forest within coffee altitude or coffee plantation) with coffee productivity.
2.4.6. Livestock feed
We used area of grazing land in hectares as a proxy for livestock feed following Kandziora et al. (Citation2013). Grazing land is the most important source of livestock feed in our study region, contributing to more than half of the total feed (Negassa et al. Citation2013; Central Statistical Agency (CSA) Citation2018a), and grazing land is believed to be the primary constraint for livestock production (Mengistu et al. Citation2021). We consider our pragmatic assumption the best possible option because reliable estimates of cattle production per hectare do not exist for our study region. We are acutely aware that our simple measure has limitations. Most notably, even though grazing land (pastures and grazed wetlands) are the main cattle grazing areas in all seasons, local communities also use fallow crop fields and sometimes forest to graze livestock. There is, however, no reliable data available on the extent of this, and as such we reasoned that the most important source of livestock feed was very likely grazing land – which also could be readily quantified without major assumptions.
2.5. Changes of ES under scenarios
First, we summarized the values of each ES at the landscape level (i.e. entire study area) for each scenario. We used the sum of values for erosion control, carbon storage, crop production, coffee production and livestock feed, and the mean for woody plant richness. For each ES, we subtracted the baseline value from the values of the scenarios to analyze their impact. Second, we analyzed changes in ES at the kebele level, because landscape-wide changes in ES potential may not be uniform across all kebeles. To quantify changes at the kebele level, we first extracted and summarized the values of ES for the current and future scenarios. We then divided the respective values of each ES by the total area of the respective kebele to obtain a measure of each kebele’s relative ES potential. For woody-plant richness, we did not use the sum of values (because site-level richness values cannot be added meaningfully) but instead used the mean of predicted values across all grid cells within a given kebele. For further analysis and presentation (e.g. for correlation analysis), we transformed and center-scaled ES for the current landscape and scenarios.
2.6. Correlation analysis
Correlation analysis is the most widely used method to examine relationships between ES (e.g. Qiu and Turner Citation2013; Spake et al. Citation2017; Vallet et al. Citation2018). Here, correlations among potential ES were carried out using non-parametric Spearman’s rank correlation (r) at kebele level. As all of our ES have a metric in which larger values are more desirable, positive correlations indicated a synergetic relationship between two services (e.g. Bennett et al. Citation2009; Raudsepp-Hearne et al. Citation2010; Spake et al. Citation2017), whereas negative correlation indicated a tradeoff relationship (Qiu and Turner Citation2013; Spake et al. Citation2017).
3. Results
3.1. Land cover changes
Currently, forest, arable land and pasture account for approximately 53%, 26% and 11% of the study area, respectively. Changes in these figures are very diverse among the scenarios (; Figure S1; Duguma et al. Citation2022). In ‘Gain over grain’, forest cover did not change compared to the baseline (53%), the currently negligible extent of coffee plantations expanded to 12%, while arable land contracted to just 9%. In ‘Mining green gold’, coffee plantations covered almost half the landscape (49%), while forest covered shrunk to 26%. In ‘Coffee and conservation’, the extent of forest cover remained unchanged, but farmland woody vegetation increased to 10% of the landscape. In ‘Food first’, forest cover decreased to 35%, while arable land increased to 57% of the landscape.
Table 3. Percentage (%) of LULC for the current landscape and land-use scenarios. The values in the table are in percent.
3.2. ES changes
ES changes differed strongly across the scenarios (). In ‘Gain over grain’ and ‘Coffee and conservation’, woody-plant richness, erosion control, carbon storage and coffee production increased; while crop production and livestock feed decreased. In ‘Mining green gold’, coffee production more than doubled, while all other ES decreased. Similarly, in ‘Food first’, crop production more than doubled but the other five ES decreased.
Table 4. Percentage change of ES potentials for each scenario in relation to the current landscape. Positive values indicate an increase and negative values indicate loss of potential ES provision. Changes in woody-plant richness denote changes in mean species richness, while changes in other ES are based on changes in the sums of a given ES across the entire study area. Units of absolute values are indicated for the baseline (SPR = mean woody-plant species richness, mgt = mega tons, t = tons, and ha = hectares). For scenarios, units are percentage changes relative to the baseline.
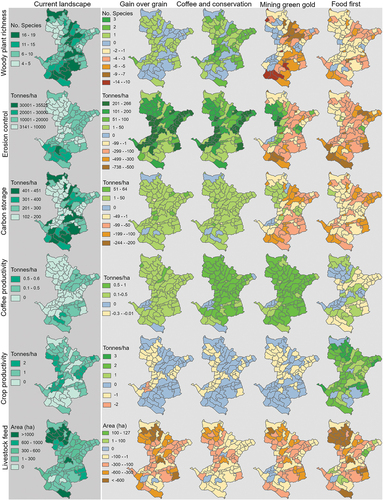
ES changes were not uniform across the landscape ( and S2). For instance, in ‘Gain over grain’, woody-plant richness remained unchanged for many kebeles; the mean increase in erosion control was very heterogeneous across kebeles; and crop production decreased for almost half of the kebeles. A similar pattern was apparent for ‘Coffee and conservation’, with the addition that woody-plant richness increased in many kebeles to various extents. For ‘Mining green gold’, coffee production showed strong increases in most kebeles. Despite a decrease in erosion control and carbon storage at the landscape level in this scenario, both of these ES in fact increased in several kebeles (). For ‘Food first’, the increase in crop production was very heterogeneous across kebeles, as was the decrease in other ES.
Figure 2. Potential ES maps and changes at the kebele level. The left column shows current ES potentials. The other columns show changes for the scenarios. Orange shades in the right panel indicate a decrease in a given ES, whereas green shades indicate an increase; blue indicates no change relative to the baseline in a given ES. Class boundaries were defined using manual classification for visualization purpose and for comparison across the scenarios for individual potential ES. Absolute values of potential ES for each scenario are shown in Fig. S2.
3.3. ES synergies and tradeoffs
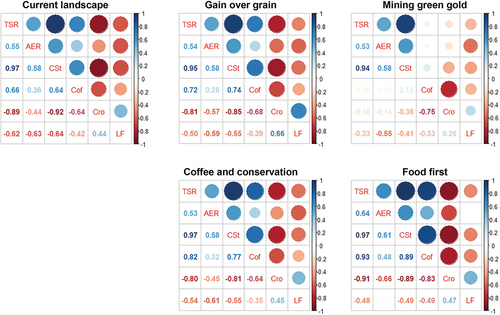
ES synergies and tradeoffs varied only slightly across the scenarios. ES relationships in the current landscape, ‘Gain over grain’, ‘Coffee and conservation’ and ‘Food first’ were very similar. Here, synergies occurred between woody-plant richness, erosion control, carbon storage, and coffee production; and these showed tradeoffs with crop production and livestock feed (). For ‘Food first’, crop production showed a very strong tradeoff with coffee production, carbon storage, erosion control, and woody-plant richness, and livestock feed showed no correlation with erosion control. For ‘Mining green gold’, the correlation analysis revealed different patterns. Coffee production showed almost no correlation with woody-plant richness, erosion control, and carbon storage.
Figure 3. Correlation analysis showing tradeoffs and synergies between ES under the current landscape and scenarios. (Abbreviations: TSR = Total species richness (used interchangeably for woody-plant richness), AER = Avoided erosion, CSt = Carbon storage, Cof = Coffee production, Cro = Crop production, and LF = Livestock feed). Blues in the graph indicate synergies and Reds indicate trade-offs.
4. Discussion
4.1. Change in ES under scenarios
Our findings show that changes in potential ES provision were strongest for land-use scenarios involving large-scale agricultural intensification, whether through food crops or cash crops. Smallholders specializing on cash crops within existing farmland (i.e. the ‘Gain over grain’ scenario), in contrast, would likely cause less impact on potential ES compared to the ‘Mining green gold’ and ‘Food first’ scenarios. Moreover, the ‘Coffee and conservation’ scenario was associated with relatively positive changes on potential ES provision, and may also be more beneficial to the local community and resilience of the environment than the other scenarios. Below we briefly highlight the present context of landscape change and discuss the implications of each scenario in detail.
4.1.1. Current context of landscape change
The current landscape consists of a mosaic of forest and farmland, where forest patches (>1 ha) and farmland each cover approximately 50% of the landscape (, Duguma et al. Citation2022). The rural population heavily depends on locally generated provisioning ES (Ango Citation2018; Schultner et al. Citation2021; Shumi et al. Citation2021), and prefers integrated agroecosystem management (Jiren et al. Citation2018) – with possible benefits for both people and ecosystems (Altieri Citation2008; James et al. Citation2023). However, research findings in the study area show that smallholder farmers are shifting towards cash crops (Dharmendra Kumar et al. Citation2014; Gebrehiwot et al. Citation2016; Jaleta et al. Citation2016), partly because of persistent problems with crop raiding (Ango et al. Citation2014; Dorresteijn et al. Citation2017). At the same time, incidences of small- and medium-scale forest grabbing for coffee plantation have increased (Tadesse et al. Citation2014; Ango Citation2018). Furthermore, since 2005, Ethiopian government policy in general has been encouraging large-scale agricultural intensification to increase food security and availability (Keeley et al. Citation2014; Bachewe et al. Citation2018; Moreda Citation2018). With this current landscape context in mind, in the following, we discuss the implications of our land-use scenarios for environmental conservation and human wellbeing.
4.1.2. ‘Gain over grain’
In addition to increases in cash crop production (such as eucalyptus, coffee, and khat), this scenario could also provide slight increases in other ES such as erosion control (by 1%), carbon storage (6%), and woody-plant richness (4%) (). Such increases could be beneficial even beyond the landscape, for example because they help to control soil loss, avoid downstream siltation, and maintain a productive local microclimate. All of these benefits directly stem from the increase in cash crop plantation, combined with the preservation of woody vegetation and forest extent. Coffee plantations under this scenario were expanded on arable land and pasture within suitable altitude ranges for coffee in the future (Moat et al. Citation2017; Duguma et al. Citation2022); whereas khat and eucalyptus were grown mostly at high altitude kebeles and on steep and degraded arable land (Jiren et al. Citation2020; Duguma et al. Citation2022). However, decreases in crop production (by about 55%) and livestock feed (57%) could have very significant negative impacts on the local community, likely impacting dietary diversity, nutritional values, and cultural values (Wayessa Citation2020; Kim et al. Citation2022).
Our results are consistent with research findings from elsewhere. For instance, in China, the Gain For Green Program (GFGP) tree plantation (mainly monocultures of eucalyptus, bamboo, Japanese cedar) played key role in land cover change, and led to the conversion of approximately 23% of cropland in Southwestern China to tree plantations between 2000 and 2015 (Hua et al. Citation2018). Moreover, despite positive contribution to some potential ES, studies in China (Brancalion and Chazdon Citation2017) and Ethiopia (Lemessa et al. Citation2022; Tesfaw et al. Citation2022) have indicated that monoculture plantations, such as eucalyptus, had led to losses of bird and bee diversity.
Finally, changes in potential ES were not uniform across the landscape. For instance, increases in erosion control and carbon storage were most pronounced for kebeles currently dominated by arable land and pasture, and changed to cash crops under this scenario. These kebeles were also more negatively affected by loss of crop production and livestock feed (). Crop production showed tradeoff with coffee production, carbon storage, erosion control and woody-plant richness because these potential ES increased along with increase in cash crops while crop production and livestock feed decreased ().
4.1.3. ‘Coffee and conservation’
Changes in potential ES provision under this scenario were similar to the ‘Gain over grain’ scenario (, ). Increases in potential ES such as woody-plant richness, erosion control, and carbon storage were the results of maintained existing vegetation cover, restoration of the degraded steep farmland, and diversification of cropping systems using fruits and vegetables (Jiren et al. Citation2020). Despite these positive impacts, substantial decreases in potential crop production and livestock feed by about 46% and 22%, respectively (), could negatively affect the local wellbeing in the short term.
Such potential decreases in crops and livestock, which could negatively affect human wellbeing, could be offset to an extent by a substantial increase in fruits and vegetables in the landscape (). Moreover, a review by Tamburini et al. (Citation2020) showed that agricultural diversification promoted biodiversity and the delivery of multiple ES without compromising crop yield. Further, local community in this scenario would generate income from the development of eco-tourism. Additionally, the climatically driven shift in shade coffee to high altitudes (Moat et al. Citation2017) could increase shade coffee production in this scenario, and thereby also benefit the local community. Finally, this scenario would also help in avoiding or minimizing deforestation, because deforestation is typically lower in forest used for coffee production than in forest without coffee (Hylander et al. Citation2013; Takahashi and Todo Citation2013).
Disaggregated results at the kebele level are very similar to the ‘Gain over grain’ scenario – in which increases in woody-plant richness, erosion control, and carbon storage were high for many kebeles, especially those currently dominated by arable land (). Similar tradeoffs and synergies between pairs of potential ES with ‘Gain over grain’ scenario was observed (), but it is due to restoration of degraded farmland that decreased potential crop production and livestock feed. As such, maintaining the current woody vegetation and restoring the degraded farmland areas could potentially preserve the current multifunctionality of the landscape, thereby serving both ecosystems and human-wellbeing.
4.1.4. ‘Mining green gold’
Under this scenario, coffee production increased by more than two times. This increase could have the potential benefit to increase export and thus generate foreign income at the national level (Rahmato Citation2014; Jiren et al. Citation2020). However, other potential ES – woody-plant richness, carbon storage, erosion control, crop production and livestock feed – all decreased (). As such, this scenario revealed the impact of intensification via monocultures – ES provision was limited to few services, and the benefits would likely accrue to limited groups of individuals or companies (e.g. Rahmato Citation2014; Moreda Citation2017; Rasmussen et al. Citation2018). Furthermore, the current available evidence on coffee plantations in the study area indicated that coffee investment companies did not allow the local community to access forest-based ES from their investment area (Tadesse et al. Citation2014; Ango Citation2018). Such restriction could also affect the livelihoods of the local community who closely depend on forest products such as fuelwood (Ango Citation2018; Schultner et al. Citation2021; Shumi et al. Citation2021).
Evidence from Latin America also indicated that, even though modern coffee plantation increased coffee yield, it also increased forest loss, soil erosion, biodiversity loss, and chemical runoff, thus threatening the long-term sustainability of ecosystems (Staver et al. Citation2001; Rappole et al. Citation2003). Such negative environmental impacts have far-reaching consequences beyond the landscape, for instance in agricultural production of downstream areas (Buytaert et al. Citation2011; Ighodaro et al. Citation2013).
Notwithstanding the overall tradeoff between coffee and other ES in this scenario, the projected changes were not uniform across the landscape (). Especially kebeles with a high level of woody-plant richness, erosion control, carbon storage, crop production and livestock feed in the current landscape would stand to lose much of this potential under this scenario. This is also reflected in correlation analysis () in which coffee production almost showed no correlation with carbon storage, erosion control, and woody-plant richness because increase in coffee production in farmland increased these potential ES, while increase in coffee production in forest decreased these potential ES. Although the previous findings by Hylander et al. (Citation2013) and Takahashi and Todo (Citation2013) concluded that coffee presence slows down deforestation, which by implication minimizes soil loss and maintains carbon storage, disaggregated results of the landscape at the kebele level showed the effect of coffee presence on erosion control and carbon storage differed across the kebeles. Intensive coffee plantations (unlike forest-grown coffee) led to increased soil loss and decreased carbon storage in kebeles currently dominated by forest. The possible national benefits of large-scale expansion of coffee plantations therefore need to be considered carefully, especially in the context of a biodiversity hotspot where local people have strong ties with local ecosystems.
4.1.5. ‘Food first’
Under this scenario, crop production increased by more than two times () as a result of large-scale agricultural expansion and intensification. This scenario has the potential to boost national food production levels (Jiren et al. Citation2020), but might come at the expense of the local community’s access to food and ES (e.g. Rahmato Citation2014; Moreda Citation2017; Rasmussen et al. Citation2018). Similar tradeoffs between crop production and other ES have been observed for large-scale agricultural intensification across the world (e.g. Rasmussen et al. Citation2018; Beckmann et al. Citation2019; Kim et al. Citation2022). Similar to the ‘Mining green gold’ scenario discussed above, this scenario could have negative long-term impacts on both society and the environment.
Disaggregation of results to the kebele level under this scenario indicated that cereal crop production increased and other ES decreased in almost all kebeles (). Those few kebeles where crop production did not change were characterized by complex topography that was not suitable for industrialized farming.
5. Limitations and future research
Although our findings and general conclusions are probably robust, we acknowledge that some limitations are unavoidable in such empirical work. Most notably, our analyses drew on imperfect data generated from different sources. Future research could use a similar approach to ours in other landscapes by integrating locally developed scenario analysis with spatial modeling using actual data generated at the local level. Such integration would provide an opportunity to evaluate different land-use management strategies and their implications on local livelihoods.
6. Conclusions
Potential ES changes differed across the scenarios in line with LULC changes. However, the changes were not uniformly distributed across the landscape. Disaggregated analysis at the kebele level showed that changes differed across the kebeles for all scenarios, which implies that considering heterogeneity within a landscape is important for scenario interpretation and land-use management interventions. Our findings provide valuable guidance for regional decision-makers and other stakeholders, because they illustrate the plausible effects of land-use scenarios on potential ES in the area at landscape scale and kebele level, with important implications for the future of local community well-being. Our results indicated that scenarios of large-scale agricultural intensification are more likely to only address narrowly defined goals, such as the increase in provisioning services, but would imply major tradeoffs regarding regulating, cultural and supporting ES. Such tradeoffs may cause unwanted consequences both locally and beyond; hence, detailed information on plausible outcomes of different land-use scenarios is important. Here, our potential ES maps of land-use scenarios provide useful information for the landscape in southwestern Ethiopia that could support decision-makers and stakeholders for planning for the future of the landscape. Based on our finding, the ‘Coffee and conservation’ scenario would be most effective to conserve ecosystems and provide human well-being.
Supplemental Material
Download PDF (1.4 MB)Acknowledgements
We are grateful for funding by the German Ministry for Education and Research (BMBF) as part of the project “Towards a Sustainable Bioeconomy: A Scenario Analysis for Jimma Coffee Landscape in Ethiopia” (Project Number 63300083). We acknowledge support by the German Research Foundation (DFG) and the Open Access Publication Fund of Leuphana University Lüneburg. We also thank three anonymous reviewers for their constructive feedback on an earlier version of this paper.
Disclosure statement
No potential conflict of interest was reported by the author(s).
Data availability statement
The data that support the findings of this study are available from the corresponding author, [DWD], upon reasonable request.
Supplementary material
Supplemental data for this article can be accessed online at https://doi.org/10.1080/26395916.2024.2321613
Additional information
Funding
References
- Abegaz A, Tamene L, Abera W, Yaekob T, Hailu H, Nyawira SS, Da Silva M, Sommer R. 2020. Soil organic carbon dynamics along chrono-sequence land-use systems in the highlands of Ethiopia. Agric Ecosyst Environ. 300:106997. doi: 10.1016/j.agee.2020.106997.
- Abera W, Tamene L, Kassawmar T, Mulatu K, Kassa H, Verchot L, Quintero M. 2021. Impacts of land use and land cover dynamics on ecosystem services in the Yayo coffee forest biosphere reserve, southwestern Ethiopia. Ecosyst Serv. 50:101338. doi: 10.1016/j.ecoser.2021.101338.
- Abrha BG. 2018. Comparison of bulk density methods in determining soil organic carbon storage under different land use types. J Soil Sci Environ Manag. 9:13–14.
- Alcamo J, Kok K, Busch G, Priess J. 2008. Chapter four searching for the future of land: scenarios from the local to global scale. Dev Integr Environ Assess. 2:67–103. doi: 10.1016/S1574-101X(08)00404-3.
- Altieri MA. 2008. Small farms as a planetary ecological asset: five key reasons why we should support the revitalisation of small farms in the global south. Environ Dev Ser. 7:1–17.
- Ango TG. 2018. “Medium-scale” forestland grabbing in the southwestern highlands of Ethiopia: impacts on local livelihoods and forest conservation. Land. 7(1):1–20. doi: 10.3390/land7010024.
- Ango TG, Börjeson L, Senbeta F, Hylander K. 2014. Balancing ecosystem services and disservices: smallholder farmers’ use and management of forest and trees in an agricultural landscape in southwestern Ethiopia. Ecol Soc. 19. doi: 10.5751/ES-06279-190130.
- Bachewe FN, Berhane G, Minten B, Taffesse AS. 2018. Agricultural transformation in Africa? Assessing the evidence in Ethiopia. World Dev. 105:286–298. doi: 10.1016/j.worlddev.2017.05.041.
- Bagstad KJ, Semmens DJ, Waage S, Winthrop R. 2013. A comparative assessment of decision-support tools for ecosystem services quantification and valuation. Ecosyst Serv. 5:27–39. doi: 10.1016/j.ecoser.2013.07.004.
- Beckmann M, Gerstner K, Akin-Fajiye M, Ceaușu S, Kambach S, Kinlock NL, Phillips HRP, Verhagen W, Gurevitch J, Klotz S, et al. 2019. Conventional land-use intensification reduces species richness and increases production: a global meta-analysis. Glob Chang Biol. 25:1941–1956. doi: 10.1111/gcb.14606.
- Belachew KY, Maina NH, Dersseh WM, Zeleke B, Stoddard FL. 2022. Yield gaps of major cereal and grain legume crops in Ethiopia: a review. Agronomy. 12:2528. doi: 10.3390/agronomy12102528.
- Bennett EM, Peterson GD, Gordon LJ. 2009. Understanding relationships among multiple ecosystem services. Ecol Lett. 12(12):1394–1404. doi: 10.1111/j.1461-0248.2009.01387.x.
- Benra F, De Frutos A, Gaglio M, Álvarez-Garretón C, Felipe-Lucia M, Bonn A. 2021. Mapping water ecosystem services: evaluating InVEST model predictions in data scarce regions. Environ Model Soft. 138:104982. doi: 10.1016/j.envsoft.2021.104982.
- Betemariyam M, Negash M, Worku A. 2020. Comparative Analysis of Carbon Stocks in Home Garden and adjacent coffee based agroforestry systems in Ethiopia. Small-scale For. 19:319–334. doi:10.1007/s11842-020-09439-4.
- Boerema A, Rebelo AJ, Bodi MB, Esler KJ, Meire P. 2017. Are ecosystem services adequately quantified? J Appl Ecol. 54:358–370. doi: 10.1111/1365-2664.12696.
- Brancalion PHS, Chazdon RL. 2017. Beyond hectares: four principles to guide reforestation in the context of tropical forest and landscape restoration. Restor Ecol. 25(4):491–496. doi: 10.1111/rec.12519.
- Bürgi M, Celio E, Diogo V, Hersperger AM, Kizos T, Lieskovsky J, Pazur R, Plieninger T, Prishchepov AV, Verburg PH. 2022. Advancing the study of driving forces of landscape change. J Land Use Sci. 17:540–555. doi: 10.1080/1747423x.2022.2029599.
- Burkhard B, Kandziora M, Hou Y, Müller F. 2014. Ecosystem service potentials, flows and demands-concepts for spatial localisation, indication and quantification Landsc Online. 34:1–32. doi: 10.3097/LO.201434.
- Buytaert W, Cuesta-Camacho F, Tobón C. 2011. Potential impacts of climate change on the environmental services of humid tropical alpine regions. Glob Ecol Biogeogr. 20:19–33. doi: 10.1111/j.1466-8238.2010.00585.x.
- Costanza R, D’Arge R, de Groot R, Farber S, Grasso M, Hannon B, Limburg K, Naeem S, O’Neill RV, Paruelo J, et al. 1997. The value of the world’s ecosystem services and natural capital. LK. Nature. 387:253–260. https://royalroads.on.worldcat.org/oclc/4592801201.
- [CSA] Central Statistical Agency. 2018a. Livestock and livestock characteristics. Addis Ababa (Ethiopia).
- [CSA] Central Statistical Agency. 2018b. Report on Area and production of major crops. Addis Ababa (Ethiopia)
- Dharmendra Kumar D, Yadav RH, Dube SK. 2014. Why a shift from coffee to chat? A study of the Kersa Woreda in Jimma zone of south western Ethiopia. Res Humanit Soc Sci. 4:176–182.
- Díaz S, Settele J, Brondízio ES, Ngo HT, Agard J, Arneth A, Balvanera P, Brauman KA, Butchart SHM, Chan KMA, et al. 2019. Pervasive human-driven decline of life on Earth points to the need for transformative change. Science (80-). 366(6471): doi: 10.1126/science.aax3100.
- Dorresteijn I, Schultner J, Collier NF, Hylander K, Senbeta F, Fischer J. 2017. Disaggregating ecosystem services and disservices in the cultural landscapes of southwestern Ethiopia: a study of rural perceptions. Landsc Ecol. 32:2151–2165. doi: 10.1007/s10980-017-0552-5.
- Duguma DW, Law E, Shumi G, Rodrigues P, Senbeta F, Schultner J, Abson DJ, Fischer J. 2023. Spatial predictions for the distribution of woody plant species under different land-use scenarios in southwestern Ethiopia. Landsc Ecol. 38:1249–1263. doi: 10.1007/s10980-023-01614-0.
- Duguma DW, Schultner J, Abson DJ, Fischer J. 2022. From stories to maps: translating participatory scenario narratives into spatially explicit information. Ecol Soc. 27. doi: 10.5751/es-13200-270213.
- Esri. 2023. ArcGIS Pro 3.1.0. Redlands, California, USA: Environmental Systems Research Institute, Inc.
- FAO. 2023. Harnessing the potential of the 10 elements of agroecology to facilitate agrifood systems transformation - from visual narratives to integrated policy design. Rome. doi: 10.4060/cc4049en.
- Fischer J, Brittain C, Klein AM. 2013. Biodiversity-friendly farming. Encycl Biodivers. 1:418–429. doi: 10.1016/B978-0-12-384719-5.00331-2.
- Foley JA, DeFries R, Asner GP, Barford C, Bonan G, Carpenter SR, Chapin FS, Coe MT, Daily GC, Gibbs HK, et al. 2005. Global consequences of land use. Science (80-). 309:570–574. doi: 10.1126/science.1111772.
- Gebrehiwot M, Elbakidze M, Lidestav G, Sandewall M, Angelstam P, Kassa H. 2016. From self-subsistence farm production to khat: driving forces of change in Ethiopian agroforestry homegardens. Environ Conserv. 43:263–272. doi: 10.1017/S0376892916000035.
- Getnet D, Negash M. 2021. Allometric equations for estimating aboveground biomass of khat (Catha edulis)-stimulate grown in agroforestry of Raya Valley, Northern Ethiopia. Heliyon. 7:e05839. doi: 10.1016/j.heliyon.2020.e05839.
- Henrichs T, Zurek M, Eickhout B, Kok K, Raudsepp-Hearne C, Ribeiro T, van Vuuren D, Volkery A. 2010. Scenario development and analysis for forward-looking ecosystem assessments. In: Ash N, Blanco H, and Brown C, editors. Ecosystems and human well-being. A manual for assessment practitioners. Washington, USA: Island Press; p. 286.
- Hua F, Wang L, Fisher B, Zheng X, Wang X, Yu DW, Tang Y, Zhu J, Wilcove DS. 2018. Tree plantations displacing native forests: the nature and drivers of apparent forest recovery on former croplands in Southwestern China from 2000 to 2015. Biol Conserv. 222:113–124. doi: 10.1016/j.biocon.2018.03.034.
- Hylander K, Nemomissa S, Delrue J, Enkosa W. 2013. Effects of coffee management on deforestation rates and forest integrity. Conserv Biol. 27(5):1031–1040. doi: 10.1111/cobi.12079.
- Ighodaro ID, Lategan FS, Yusuf SFG. 2013. The impact of soil erosion on agricultural potential and performance of Sheshegu community farmers in the Eastern Cape of South Africa. J Agric Sci. 5(5):140–147. doi: 10.5539/jas.v5n5p140.
- Jaleta D, Mbilinyi B, Mahoo H, Lemenih M. 2016. Eucalyptus expansion as relieving and provocative tree in Ethiopia. J Agric Ecol Res Int. 6:1–12. doi: 10.9734/jaeri/2016/22841.
- James D, Wolff R, Wittman H. 2023. Agroecology as a philosophy of life. Agric Human Values. doi: 10.1007/s10460-023-10455-1.
- Jiren TS, Dorresteijn I, Schultner J, Fischer J. 2018. The governance of land use strategies: institutional and social dimensions of land sparing and land sharing. Conserv Lett. 11(3):1–8. doi: 10.1111/conl.12429.
- Jiren TS, Hanspach J, Schultner J, Fischer J, Bergsten A, Senbeta F, Hylander K, Dorresteijn I. 2020. Reconciling food security and biodiversity conservation: participatory scenario planning in southwestern Ethiopia. Ecol Soc. 25. doi: 10.5751/es-11681-250324.
- Kandziora M, Burkhard B, Müller F. 2013. Mapping provisioning ecosystem services at the local scale using data of varying spatial and temporal resolution. Ecosyst Serv. 4:47–59. doi: 10.1016/j.ecoser.2013.04.001.
- Keeley J, Seide WM, Eid A, Kidewa AL. 2014. Large-scale land deals in Ethiopia: scale, trends, features and outcomes to date. London: IIED.
- Kim SK, Marshall F, Dawson NM. 2022. Revisiting Rwanda’s agricultural intensification policy: benefits of embracing farmer heterogeneity and crop-livestock integration strategies. Food Secur. 14(3):637–656. doi: 10.1007/s12571-021-01241-0.
- Kremen C. 2015. Reframing the land-sparing/land-sharing debate for biodiversity conservation. Ann N Y Acad Sci. 1355:52–76. doi: 10.1111/nyas.12845.
- Lemessa D, Mewded B, Legesse A, Atinfau H, Alemu S, Maryo M, Tilahun H. 2022. Do eucalyptus plantation forests support biodiversity conservation? For Ecol Manage. 523:120492. doi: 10.1016/j.foreco.2022.120492.
- Maes J, Egoh B, Willemen L, Liquete C, Vihervaara P, Schägner JP, Grizzetti B, Drakou EG, Notte AL, Zulian G, et al. 2012. Mapping ecosystem services for policy support and decision making in the European Union. Ecosyst Serv. 1(1):31–39. doi: 10.1016/j.ecoser.2012.06.004.
- Manlosa AO, Hanspach J, Schultner J, Dorresteijn I, Fischer J. 2019. Livelihood strategies, capital assets, and food security in rural Southwest Ethiopia. Food Secur. 11(1):167–181. doi: 10.1007/s12571-018-00883-x.
- Martinez-Harms MJ, Balvanera P. 2012. Methods for mapping ecosystem service supply: a review. Int J Biodivers Sci Ecosyst Serv Manage. 8:17–25. doi: 10.1080/21513732.2012.663792.
- Megerssa G, Kassam A. 2020. Sacred knowledge traditions of the Oromo of the Horn of Africa. Durham, England: Fifth World Publications.
- Mehrabi Z, Ellis EC, Ramankutty N. 2018. The challenge of feeding the world while conserving half the planet. Nat Sustain. 1(8):409–412. doi: 10.1038/s41893-018-0119-8.
- Mengistu S, Nurfeta A, Tolera A, Bezabih M, Adie A, Wolde-Meskel E, Zenebe M. 2021. Livestock production challenges and improved forage production efforts in the Damot Gale District of Wolaita Zone, Ethiopia. Adv Agric. 2021:1–10. doi: 10.1155/2021/5553659.
- Meyfroidt P, De Bremond A, Ryan CM, Archer E, Aspinall R, Chhabra A, Camara G, Corbera E, DeFries R, Díaz S, et al. 2022. Ten Facts about land systems for sustainability. Proc Natl Acad Sci USA. 119:1–12. doi: 10.1073/pnas.2109217118.
- Mittermmeier R, Turner W, Larsen F, Brooks TM, Gascon C. 2011. Global biodiversity conservation: the critical role of hotspots. In: Zachos F Habel J, editors. Biodiversity hotspots. Berlin (Heidelberg): Springer; p. 1–22.
- Moat J, Williams J, Baena S, Wilkinson T, Gole TW, Challa ZK, Demissew S, Davis AP. 2017. Resilience potential of the Ethiopian coffee sector under climate change. Nat Plants. 3. doi: 10.1038/nplants.2017.81.
- Mohammed A, Bekele L. 2014. Changes in carbon stocks and sequestration potential under native forest and adjacent land use systems at Gera , South- Western Ethiopia ChangesinCarbonStocksandSequestrationPotentialunderNativeForestandAdjacentLanduseSystemsatGeraSouthWesternEthiopia. Glob. J. Sci. Front. Res. 14:10–20.
- Moreda T. 2017. Large-scale land acquisitions, state authority and indigenous local communities: insights from Ethiopia. Third World Q. 38(3):698–716. doi: 10.1080/01436597.2016.1191941.
- Moreda T. 2018. The right to food in the context of large-scale land investment in Ethiopia. Third World Q. 39(7):1326–1347. doi: 10.1080/01436597.2018.1460199.
- Negassa A, Rashid S, Gebremedin B, Kennedy A. 2013. Livestock production and marketing. In: Dorosh P Rashid S, editors. Food and agriculture in Ethiopia: progress and policy challenges. Philadelphia: University of Pennsylvania Press; p. 159–189.
- Peterson GD, Cumming GS, Carpenter SR. 2003. Scenario planning: a tool for conservation in an uncertain world. Conserv Biol. 17(2):358–366. doi: 10.1046/j.1523-1739.2003.01491.x.
- Qiu J, Turner MG. 2013. Spatial interactions among ecosystem services in an urbanizing agricultural watershed. Proc Natl Acad Sci USA. 110(29):12149–12154. doi: 10.1073/pnas.1310539110.
- Rahmato D. 2011. Land to investors: large-scale land transfers in Ethiopia. Addis Ababa (Ethiopia): Forum for Social Studies.
- Rahmato D. 2014. The perils of development from above: land deals in Ethiopia. Afr Identities. 12(1):26–44. doi: 10.1080/14725843.2014.886431.
- Rappole JH, King DI, Vega Rivera JH. 2003. Coffee and conservation. Conserv Biol. 17(1):334–336. doi: 10.1046/j.1523-1739.2003.01548.x.
- Rasmussen LV, Coolsaet B, Martin A, Mertz O, Pascual U, Corbera E, Dawson N, Fisher JA, Franks P, Ryan CM, et al. 2018. Social-ecological outcomes of agricultural intensification. Nat Sustain. 1(6):275–282. doi: 10.1038/s41893-018-0070-8.
- Raudsepp-Hearne C, Peterson GD, Bennett EM. 2010. Ecosystem service bundles for analyzing tradeoffs in diverse landscapes. Proc Natl Acad Sci. 107(11):5242–5247. doi: 10.1073/pnas.0907284107.
- Rodrigues P, Dorresteijn I, Guilherme JL, Hanspach J, De Beenhouwer M, Hylander K, Bekele B, Senbeta F, Fischer J, Nimmo D, et al. 2021. Predicting the impacts of human population growth on forest mammals in the highlands of southwestern Ethiopia. Biol Conserv. 256:109046. doi: 10.1016/j.biocon.2021.109046.
- Rodrigues P, Shumi G, Dorresteijn I, Schultner J, Hanspach J, Hylander K, Senbeta F, Fischer J. 2018. Coffee management and the conservation of forest bird diversity in southwestern Ethiopia. Biol Conserv. 217:131–139. doi: 10.1016/j.biocon.2017.10.036.
- Sahle M, Saito O, Fürst C, Demissew S, Yeshitela K. 2019. Future land use management effects on ecosystem services under different scenarios in the Wabe River catchment of Gurage Mountain chain landscape, Ethiopia. Sustainability Sci. 14:175–190. doi: 10.1007/s11625-018-0585-y.
- Sala OE, Chapin FS, Armesto JJ, Armesto JJ, Berlow E, Bloomfield J, Dirzo R, Huber-Sanwald E, Huenneke LF, Jackson RB, et al. 2000. Global biodiversity scenarios for the year 2100. Science (80-). 287:1770–1774. doi: 10.1126/science.287.5459.1770.
- Schirpke U, Tscholl S, Tasser E. 2020. Spatio-temporal changes in ecosystem service values: effects of land-use changes from past to future (1860–2100). J Environ Manage. 272:111068. doi: 10.1016/j.jenvman.2020.111068.
- Schultner J, Dorresteijn I, Manlosa AO, von Wehrden H, Hylander K, Senbeta F, Fischer J. 2021. Ecosystem services from forest and farmland: present and past access separates beneficiaries in rural Ethiopia. Ecosyst Serv. 48:101263. doi: 10.1016/j.ecoser.2021.101263.
- Senbeta F, Denich M. 2006. Effects of wild coffee management on species diversity in the afromontane rainforests of Ethiopia. For Ecol Manage. 232(1–3):68–74. doi: 10.1016/j.foreco.2006.05.064.
- Seppelt R, Lautenbach S, Volk M. 2013. Identifying tradeoffs between ecosystem services, land use, and biodiversity: a plea for combining scenario analysis and optimization on different spatial scales. Curr Opin Environ Sustainability. 5:458–463. doi: 10.1016/j.cosust.2013.05.002.
- Sharp R, Tallis H, Ricketts T, Guerry AD, Wood SA, Nelson E, Ennaanay D, Wolny S, Olwero N, Vigerstol K, et al. 2018. InVEST 3.6.0 user’s guide. The natural capital project. Stanford, USA: Stanford University, University of Minnesota, The Nature Conservancy, and World Wildlife Fund.
- Shumi G, Dorresteijn I, Schultner J, Hylander K, Senbeta F, Hanspach J, Ango TG, Fischer J. 2019. Woody plant use and management in relation to property rights: a social-ecological case study from southwestern Ethiopia. Ecosyst People. 15:303–316. doi: 10.1080/26395916.2019.1674382.
- Shumi G, Rodrigues P, Hanspach J, Härdtle W, Hylander K, Senbeta F, Fischer J, Schultner J. 2021. Woody plant species diversity as a predictor of ecosystem services in a social–ecological system of southwestern Ethiopia. Landsc Ecol. 36:373–391. doi: 10.1007/s10980-020-01170-x.
- Shumi G, Rodrigues P, Schultner J, Dorresteijn I, Hanspach J, Hylander K, Senbeta F, Fischer J. 2019. Conservation value of moist evergreen Afromontane forest sites with different management and history in southwestern Ethiopia. Biol Conserv. 232:117–126. doi: 10.1016/j.biocon.2019.02.008.
- Shumi G, Schultner J, Dorresteijn I, Rodrigues P, Hanspach J, Hylander K, Senbeta F, Fischer J. 2018. Land use legacy effects on woody vegetation in agricultural landscapes of south-western Ethiopia. Divers Distrib. 24:1136–1148. doi: 10.1111/ddi.12754.
- Spake R, Lasseur R, Crouzat E, Bullock JM, Lavorel S, Parks KE, Schaafsma M, Bennett EM, Maes J, Mulligan M, et al. 2017. Unpacking ecosystem service bundles: towards predictive mapping of synergies and tradeoffs between ecosystem services. Glob Environ Change. 47:37–50. doi: 10.1016/j.gloenvcha.2017.08.004.
- Staver C, Guharay F, Monterroso D, Muschler RG. 2001. Designing pest-suppressive multistrata perennial crop systems: shade-grown coffee in Central America. Agrofor Syst. 53(2):151–170. doi: 10.1023/A:1013372403359.
- Taddese G. 2001. Land degradation: a challenge to Ethiopia. Environ Manage. 27(6):815–824. doi: 10.1007/s002670010190.
- Tadesse G, Zavaleta E, Shennan C. 2014. Effects of land-use changes on woody species distribution and above-ground carbon storage of forest-coffee systems. Agric Ecosyst Environ. 197:21–30. doi: 10.1016/j.agee.2014.07.008.
- Tadesse G, Zavaleta E, Shennan C, FitzSimmons M. 2014. Prospects for forest-based ecosystem services in forest-coffee mosaics as forest loss continues in southwestern Ethiopia. Appl Geogr. 50:144–151. doi: 10.1016/j.apgeog.2014.03.004.
- Takahashi R, Todo Y. 2013. The impact of a shade coffee certification program on forest conservation: a case study from a wild coffee forest in Ethiopia. J Environ Manage. 130:48–54. doi: 10.1016/j.jenvman.2013.08.025.
- Tamburini G, Bommarco R, Wanger TC, Kremen C, van der Heijden MGA, Liebman M, Hallin S. 2020. Agricultural diversification promotes multiple ecosystem services without compromising yield. Sci Adv 6. doi: 10.1126/SCIADV.ABA1715.
- Tesfaw A, Alemu D, Senbeta F, Teferi E. 2022. Eucalyptus succession on croplands in the highlands of Northwestern Ethiopia: economic impact analysis using farm household model. Resources. 11(8):71. doi: 10.3390/resources11080071.
- Tolessa T, Senbeta F, Abebe T. 2017. Land use/land cover analysis and ecosystem services valuation in the central highlands of Ethiopia. For Trees Livelihoods. 26:111–123. doi: 10.1080/14728028.2016.1221780.
- Turner KG, Odgaard MV, Bøcher PK, Dalgaard T, Svenning J-C. 2014. Bundling ecosystem services in Denmark: tradeoffs and synergies in a cultural landscape. Landsc Urban Plan. 125:89–104. doi: 10.1016/j.landurbplan.2014.02.007.
- Vallet A, Locatelli B, Levrel H, Wunder S, Seppelt R, Scholes RJ, Oszwald J. 2018. Relationships between ecosystem services: comparing methods for assessing tradeoffs and synergies. Ecol Econ. 150:96–106. doi: 10.1016/j.ecolecon.2018.04.002.
- Vanderhaegen K, Verbist B, Hundera K, Muys B. 2015. REALU vs. REDD+: carbon and biodiversity in the Afromontane landscapes of SW Ethiopia. For Ecol Manage. 343:22–33. doi:10.1080/17461391.2021.1971.
- Verburg PH, Crossman N, Ellis EC, Heinimann A, Hostert P, Mertz O, Nagendra H, Sikor T, Erb K-H, Golubiewski N, et al. 2015. Land system science and sustainable development of the earth system: a global land project perspective. Anthropocene. 12:29–41. doi: 10.1016/j.ancene.2015.09.004.
- Vihervaara P, Mononen L, Santos F. 2017. Biophysical quantification. In: Burkhard B, and Maes J., editors. Mapping ecosystem services edited. Sofia, Bulgaria: Pensoft publishers.
- Wayessa GO. 2020. Impacts of land leases in Oromia, Ethiopia: changes in access to livelihood resources for local people. Land Use Policy. 97:104713. doi: 10.1016/j.landusepol.2020.104713.
- Wiegant D, Eshetu GZ, Muluken AM, van Oel P, Dewulf A. 2022. Unravelling cross-scale and cross-level challenges in Ethiopian forest and landscape restoration governance. Ecol Soc. 27. doi: 10.5751/ES-13478-270330.
- Winkler K, Fuchs R, Rounsevell M, Herold M. 2021. Global land use changes are four times greater than previously estimated. Nat Commun. 12(1):1–10. doi: 10.1038/s41467-021-22702-2.
- Zewdie B, Tack AJM, Ayalew B, Wondafrash, M., Nemomissa, S., Hylander, K. 2022. Plant biodiversity declines with increasing coffee yield in Ethiopia’s coffee agroforests. J Appl Ecol. 59:1198–1208. doi: 10.1111/1365-2664.14130.