
 ?Mathematical formulae have been encoded as MathML and are displayed in this HTML version using MathJax in order to improve their display. Uncheck the box to turn MathJax off. This feature requires Javascript. Click on a formula to zoom.
ABSTRACT
Small-scale fisheries provide nutrients to hundreds of millions of people worldwide, with yields dependent on the condition of marine habitats such as coral reefs. Small-scale fisheries are a particularly important food source in societies with nutrient deficiencies and where unhealthy food alternatives are widely available. Using data from coral reef surveys around two islands in French Polynesia (Moorea and Raiatea), we show how the availability of nutrients to fisheries changed in relation to the condition of coral habitat. Fish biomass and nutrient availability were highest when coral cover was low around both islands, driven predominantly by abundant herbivorous reef fish. We also investigated the importance of fish in people’s diets, to determine if fish consumption was aligned with available fisheries resources on local reefs and if nutrient intakes from fish could be explained by people’s socioeconomic background. People ate a higher diversity of reef fish in Raiatea, however nutrient intakes from fish were higher in Moorea. Most people ate more fish than meat on both islands, however fish consumption declined over generations. People from fishing households had higher nutrient intakes from reef and pelagic fish, and people from farming households had higher intakes from reef fish. Preference for eating reef fish over pelagic fish was also associated with higher total nutrient intakes. Promoting traditional diets rich in fish could be key to meeting people’s nutritional needs in French Polynesia while reducing diet-related health issues linked to the overconsumption of fat. French and Tahitian versions of the Abstract are available in Supplementary Material.
EDITED BY:
Introduction
Small-scale fisheries support a wide diversity of fish accessible in many countries across the tropics (Belton and Thilsted Citation2014) and often provide an affordable animal-based source of protein and key micronutrients that are lacking in people’s diets (Kawarazuka and Béné Citation2011; Hicks et al. Citation2019). Tropical fisheries vary in their vulnerability to environmental stressors, such as climate change, as well as in the nutrient density of yields (Maire et al. Citation2021). Therefore, tropical fisheries have the potential to remain an important source of human nutrition as environmental conditions alter (Hicks et al. Citation2021; Robinson et al. Citation2022), although changes in the availability of fisheries resources may lead to changes in people’s fish consumption patterns.
Marine fisheries are sensitive to the condition of key habitats of targeted fish populations (Brown et al. Citation2019), for example the condition of coral habitat influences the productivity, availability, and long-term sustainability of reef fisheries (Cruz-Trinidad et al. Citation2014; Morais et al. Citation2020). Currently, there is little understanding of how reef habitat condition impacts the provisioning of nutritious seafood through fisheries (Hicks et al. Citation2021). Existing literature show variable responses of fishery catches to changes in coral reef condition. For example, an increased abundance of herbivorous fish following coral mortality maintained small-scale fisheries yields on some degraded reefs in Seychelles (Robinson et al. Citation2019), while reef fisheries in the Pacific are expected to become less productive as coral cover is progressively lost (Bell et al. Citation2013). The impacts of reef habitat condition on the composition and size of fisheries catches may therefore influence the food provisioning services provided by coral reefs (Woodhead et al. Citation2019). Decreases in fish catches would be expected to reduce fish consumption, increasing risks of nutrient deficiencies in tropical coastal communities (Golden et al. Citation2016). Reef-associated fish have relatively high concentrations of zinc and vitamin A, while small pelagic (open-ocean) species have high calcium and omega-3 fatty acid concentrations (Robinson et al. Citation2022), therefore changes in seafood composition, for example through projected catch increases of pelagic fisheries (Bell et al. Citation2013), would alter people’s nutrient intakes from fish.
People’s dietary choices are influenced by many factors beyond availability, including culture, price, demographics, and convenience (Tilman and Clark Citation2014). For example, increasing availability of imported ‘Western’ foods across the coastal tropics, driven by the globalisation of food trade systems (Thow et al. Citation2011), has facilitated dietary transitions away from traditional diets of nutritious local fish and plants, towards energy-dense and high-fat foods (Hughes and Marks Citation2009). The nutritional implications of moving away from traditional diets are a public health concern, as diets may become deficient in essential nutrients, leading to micronutrient deficiencies, or contain excess nutrients contributing to health conditions such as obesity and diabetes (Hughes and Marks Citation2009; Sahal Estimé et al. Citation2014; Stevens et al. Citation2022). For example, in the Peruvian Amazon, replacing wild caught freshwater fish with chicken and farmed fish reduced intakes of essential fatty acids and iron, nutrients that were already deficient in people’s diets (Heilpern et al. Citation2021). If there is a shift away from traditional fish-based diets towards modern diets with high fat content, it is important that people balance local produce and imported foods in a way that minimises diet-related ill-health (Parry Citation2010). Nutrition and diet-related health issues are unequally distributed within societies (Friel and Baker Citation2009), therefore it is imperative to determine which groups of people may be most at risk from eating fewer traditional foods.
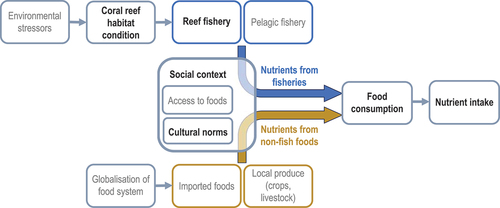
Here we focus on French Polynesia as a case study to examine linkages between ecological conditions (coral reef habitat and fisheries resources), socioeconomic factors, and people’s diets (). Specifically, our research objectives are to 1) assess the availability of nutrients from reef fish in relation to changes in coral reef habitat condition, and 2) investigate the importance of reef and pelagic fish for people’s nutrient intakes in relation to their socioeconomic background.
Figure 1. Conceptual diagram of links between coral reefs, fisheries, food supply, and dietary nutrition. Environmental stressors (e.g. climate change, crown-of-thorns sea star outbreaks) affect coral reef habitat condition, which in turn affects reef fisheries catches. People’s nutrient intakes are determined by their consumption of foods from reef and pelagic fisheries (blue) and other sources (orange). Food consumption is influenced by social context, including culture and access to foods. Variables in grey text were not measured in the current study (e.g. availability of reef fishery resources was estimated, but pelagic resources were not).
Materials and methods
Study area
This study focuses on two islands, Moorea and Raiatea, within the Society Archipelago, French Polynesia (Figure S1). Moorea is the second most inhabited island in French Polynesia after Tahiti, with a population of 17, 463, while Raiatea has a population of 12, 291 (Institute of Statistics of French Polynesia Citation2017). Obesity is an urgent health concern in French Polynesia, with 68% of men and 67% of women estimated to be overweight or obese in 2008 (Daigre et al. Citation2012). French Polynesia has become dependent on Western imports of high-calorie foods since the 1980s, such as chicken which has a particularly high fat content when fried (World Health Organisation Citation2003). Food imported into French Polynesia is mainly sourced from Europe, and the volume of unhealthy imported foods has increased over time (Andrew et al. Citation2022).
Small-scale fisheries in French Polynesia use traps, hook and line, gillnets, and spearguns to catch reef-associated and pelagic fish, of which a large proportion is consumed locally (Chauvet and Galzin Citation1996; Leenhardt et al. Citation2016). Reef and pelagic fish are sold at the roadside in Moorea, which provides an income for fishing families and a local supply of fish for islanders (Nassiri et al. Citation2021). A large proportion of fish caught around Raiatea is sold at a large market (Uturoa) at the north of the island (Chauvet and Galzin Citation1996). It is also common for islanders to order fish directly from fishers (Leenhardt et al. Citation2016).
Ecological data
Live coral cover on reefs around Moorea and Raiatea was reduced to almost zero by 2010 after crown-of-thorns sea star (Acanthaster planci; ‘taramea’ in Tahitian) outbreaks, before being further impacted by a cyclone and coral bleaching (Pérez-Rosales et al. Citation2021). We used underwater visual surveys to collect data on live coral cover (photo-quadrats) and abundances and sizes of reef fishes (belt transects) (details of transect methodology are in supplementary material). Surveys were conducted every second year, in even years (2010–2020) at one site in Raiatea and two sites in Moorea, and in odd years (2011–2019) at another site in Moorea (Figure S1).
We classified fish species into three trophic groups: ‘herbivore’ (including detritivores and microvores), ‘mobile invertivore’ (including microinvertivores and macroinvertivores) and ‘piscivore’ (Parravicini et al. Citation2020) (Table S1). Fish weights were summed per trophic group to estimate the total biomass per transect in kilograms per hectare. We calculated mean biomass and standard error across transects per year.
Socioeconomic and dietary surveys
We developed a semi-structured survey to gather socioeconomic (Table S2) and dietary data in Moorea and Raiatea. The semi-structured interview was piloted in both islands, alongside informal discussions, to create a final version that incorporated island-specific context while still allowing comparisons to be made between islands. In total, 183 household interviews were conducted in Raiatea, between June and September 2019 and 96 in Moorea in September 2019. We followed a purposive snowball sampling approach (Ayhan Citation2011) stratified across administrative districts, targeting fishing and non-fishing households (Table S2). Initially, a few influential people in a district were identified for interview, and subsequent interviews were then based on their recommendations and introductions. Sample sizes satisfied our chosen 95% confidence level given the population of each island (with 10% margin of error as we only sampled one person per household, even though households often contained multiple people). Approximately two thirds of respondents on each island were women as they were most commonly at home during the day to answer questions (pers. obs.). Interviews were conducted in either French or Tahitian with a translator (English version of the questionnaire available in online supplementary material).
We collected dietary data on the frequency of consumption of various food groups (based on the Global Individual Food consumption data Tool, GIFT; Food and Agriculture Organisation Citation2022; Table S3) and the types of fish people ate. Options for the frequency of consumption were: ‘never’, ‘1–2 times per month’, ‘3–4 times per month’, ‘1–2 times per week’, ‘3–5 times per week’ and ‘6 or more times per week’. All responses were standardised by converting to number of times per week. Some food categories were grouped together prior to analyses using a similar approach to Kennedy et al. (Citation2011), for example ‘nuts/seeds’ and ‘legumes’ were separate questionnaire responses but were combined to give a total consumption frequency (Table S3).
The types of fish eaten were identified to species level where possible, otherwise to taxonomic family level. Fish names given in Tahitian were matched to scientific taxa based on local knowledge and FishBase (Table S1). Frequency of consumption was not collected for each type of fish, only for fish in general. Respondents were also asked about their fish consumption in comparison to their meat consumption and their fish and meat consumption in comparison to previous generations (parents/grandparents).
Nutrient content of fish
Fish nutrient estimates were obtained from the Nutrient Analysis Tool in FishBase (www.fishbase.org, Froese and Pauly Citation2022), developed by Hicks et al. (Citation2019). We extracted nutrient predictions in August 2022. Nutrient concentrations in a 100 g portion of muscle tissue were estimated for five nutrients (calcium, Ca; iron, Fe; zinc, Zn; vitamin A, Vit A; omega-3 fatty acids (eicosapentaenoic acid (EPA) + docosahexaenoic acid (DHA)), O3) that are highly concentrated and bioavailable in fish and lacking in diets across the tropics (Beal et al. Citation2017; Ferguson et al. Citation2019; Golden et al. Citation2021). Nutrient content data were extracted for each species observed in reef surveys and for species mentioned by respondents during interviews. When fish were not identified to species level, or when nutrient estimates were not available for a particular species, genus or family level estimates were used by taking medians across species belonging to the same taxonomic grouping also found in French Polynesia (according to FishBase).
Nutrient concentrations (100 g−1) per individual fish were scaled up to reef survey biomass estimates to represent the total quantity of each nutrient per hectare (i.e. potential nutrient yield for fisheries). Only fish ≥15 cm in total length were included to represent the nutrients within fish deemed large enough to be captured by fisheries (i.e. the minimum fishable size; Rassweiler et al. Citation2020). Values were then summed per trophic group in each transect and then the mean calculated across transects at each survey site.
We then estimated the mean nutrient concentration of a 100 g fish portion for each respondent, by averaging nutrient concentrations across all fish species they provided during interviews. Nutrient estimates per person were then expressed as the percentage contribution to each daily recommended nutrient intake (RNI) or equivalent for adult women (Ca = 1000 mg, Fe = 19.6 mg, Zn = 4.9 mg, Vit A = 270 μg; WHO/FAO Citation2004) (O3 = 250 mg; European Food Safety Authority (EFSA) Citation2010) (Table S4).
Calculating nutrient density and intakes
We assessed the nutritional quality of different food groups by calculating the nutrient density based on our five nutrients (Drewnowski Citation2009). Nutrient density was defined as the sum of percentage contributions to RNIs for all five nutrients in a 100 g portion of food, with the maximum possible value for each nutrient capped at 100%, or a maximum of 500% when all five nutrients are fully meeting dietary needs. The nutrient contents of 100 g food portions were obtained from Pacific Island food composition tables (Food and Agriculture Organisation Citation2004) by taking a median across all food items within a food group for each nutrient. Specific food items were removed from the composition tables if they were not eaten in the form given, for example raw flour or raw plant-based foods that were toxic unless cooked prior to consumption (see online supplementary material for details). The total fat content of 100 g food portions was also obtained from food composition tables and expressed as a percentage of the maximum recommended daily fat allowance (65 g; Drewnowski Citation2009).
We represented each respondent’s average diet by calculating the total nutrient density across all food groups, weighted by frequency of consumption for each food group, i, up to the total number of food groups eaten by a respondent, n (EquationEquation (1)1
1 ).
These weighted nutrient density scores represented the nutritional value of each person’s diet, based on the content of our five nutrients. As frequency of fish consumption was across all species eaten per respondent, we estimated separate weighted nutrient densities for reef and pelagic fish by equally splitting consumption frequency.
In addition to nutrient density of diets, we then estimated people’s nutrient intake using information on typical portion sizes from the food composition tables (FAO Citation2004), as these data were not collected during interviews. We rescaled the nutrient content in 100 g of each food item to estimated portion sizes. Medians across food items were then used to represent the nutrients in a typical portion for each food group. Nutrient values were multiplied by the frequency each food group was consumed in a week and divided by seven to give a daily estimate of nutrient intake per respondent. It should be noted that foods eaten more than once per day were not captured in our questionnaire, for example the most frequent response for consumption for any food was ‘every day’, without indicating whether a particular food was eaten multiple times a day or not. As such, our nutrient intake estimates are not intended to be a complete daily profile of people’s nutrition, but rather a representation of which foods people tended to eat on a regular basis, allowing comparisons to be made between people eating more or less of various foods.
Statistical analyses
All analyses were run in R (version 4.2.2; R Core Team Citation2022). We investigated the association between the nutrient density of fish consumed and socioeconomic backgrounds of respondents by conducting a redundancy analysis (RDA) for each island using the ‘easyCODA’ package (Greenacre Citation2018). Response variables were the percentage contributions to RNI for each of five nutrients and the total nutrient density estimate of each respondent’s diet. Explanatory variables were gender (man or woman), age, education level (at least high school level or lower), wealth, ability to speak at least one Polynesian language (yes or no), fisher or farmer households (both, fisher only, farmer only or neither), preference for reef or pelagic fish (based on the number of fish families eaten), how often takeaway food was eaten, and how often traditional Tahitian dishes (‘Maa Tahiti’) were eaten.
Wealth was determined using a principal component analysis (PCA) that included details of each respondent’s home ownership (own house, renting or lodger), financial difficulties (yes or no), and vehicle ownership. Each respondent was given a vehicle score, calculated by multiplying each item by a score that reflected its value (bicycles = 0.1, pirogues (small boats) = 0.2, motorcycles = 0.5, cars and motorboats = 1) and summing scores for all vehicles owned. Some households may have had shared access to certain items, for example pirogues (pers. obs.), however this was not accounted for in our analysis. Values from PCA axis 1 explained 39% of variation in the data and were used as a wealth indicator in analyses, with higher values indicating higher wealth (Figure S2). All numerical explanatory variables in the redundancy analyses (age, wealth, fish preference, takeaway food and Maa Tahiti frequencies) were scaled, with mean = 0 and standard deviation = 1, to allow the effects of variables to be examined relative to one another.
Variance explained by each variable, the global significance of the model, and the significance of axes and terms in the model were examined for each redundancy analysis. Variance inflation factors for model terms were assessed using the ‘vegan’ package (Oksanen et al. Citation2022) to ensure that none had a value >2.
Generalised linear models (GLM) were used to investigate the effects of various socioeconomic variables on nutrient intakes. Separate models were used to analyse nutrient intakes from entire diets, reef fish only, and pelagic fish only (EquationEquation (2)2
2 , for i questionnaire respondents), all with Gaussian distributions.
Model assumptions of each GLM were verified using the protocol described by Zuur and Ieno (Citation2016), by plotting residuals against fitted values and each covariate in the model. Residuals were assessed to confirm there were no temporal or spatial dependencies.
Results
Availability of reef fish biomass and nutrients to fisheries
Coral cover increased from ~0–33% between 2010 and 2020 in Raiatea and, in Moorea, from 2% to 47% between 2010 and 2018 before declining to 28% by 2020 (). Over this period of coral recovery, reef fish biomass generally decreased (). In Moorea, biomass of all trophic groups decreased from 2010 to 2020 (by 37% for both herbivores and invertivores, 33% for piscivores) (). A 54% decrease in herbivore biomass occurred in Raiatea from 2010 to 2020 (2444.9 ± 310.4 to 1126.0 ± 296.2 kg ha−1), while invertivore and piscivore biomass gradually declined from 2010 to 2018 before rising for all trophic groups from 2018 to 2020 (). Fish biomass was higher in Raiatea than Moorea, particularly for herbivores and mobile invertivores.
Figure 2. Trends of hard coral cover (a) and fish biomass (b, c) on reefs in Moorea and Raiatea from 2010 to 2020. Biomass trends are for three trophic groups of fish (herbivore, mobile invertivore, and piscivore). Only fish above the minimum fishable size (≥15 cm) with the potential to contribute to human nutrition were included. Errors bars are the standard error of the mean across transects. Note y-axes scales for biomass differ between islands (b, c).
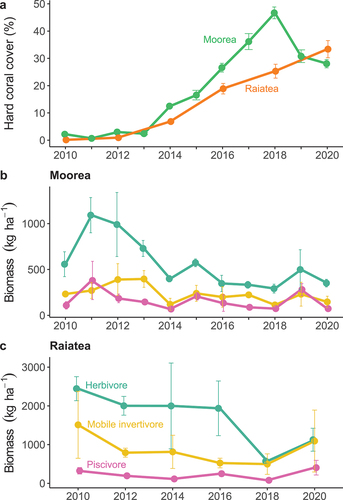
Nutrient availability from reef fish was similar to biomass trends for most nutrients and was also higher in Raiatea than Moorea (Figure S3). Availability of all five nutrients from mobile invertivores and piscivores were at similarly low levels in Moorea over the time series, however in Raiatea, nutrient quantities from invertivores were higher than piscivores. Vitamin A availability from invertivores in Raiatea was particularly high (and variable) in 2010 and 2020 compared to other trophic groups (Figure S3).
Fish consumption and nutrient intakes
The reef fish families eaten by most respondents were herbivores on both islands; Scaridae in Moorea (72% of respondents) and Acanthuridae in Raiatea (60% of respondents) (). With the exceptions of Scaridae and Mullidae, all reef fish families were eaten by a higher proportion of respondents in Raiatea compared to Moorea. Three reef fish families were typically eaten in Raiatea, compared to two in Moorea (). The pelagic fish families eaten by most respondents were Scombridae in Moorea (64% of respondents) and Carangidae in Raiatea (71% of respondents) (). The proportion of respondents eating each pelagic family was more similar between islands than for reef fish, although a lower proportion of people ate carangids in Moorea (57%; ). The median number of pelagic families consumed was two on both islands ().
Figure 3. Proportion of respondents who ate the top eight reef (a) and pelagic (c) fish families, as stated during interviews in Moorea (green, n = 96) and Raiatea (orange, n = 181, two respondents who did not eat fish were not included). The total number of fish families consumed by each respondent is shown for reef (b) and pelagic (d) fish, with medians represented as solid horizontal lines. A comparison of fish to meat consumption per respondent (e), as well as perceptions of fish (f) and meat (g) consumption compared to their elders are also shown.
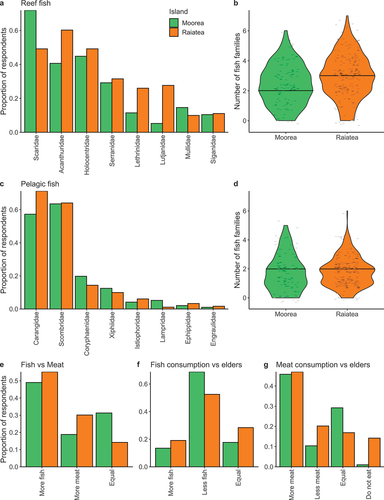
On both islands, around half of respondents said they ate more fish than meat (Moorea = 50%, Raiatea = 55%) (). The second most popular response in Moorea was eating equal amounts of fish and meat (31%), while in Raiatea it was eating more meat (30%). Although most people ate more fish than meat, the majority of people on both islands said they ate less fish (Moorea = 69%, Raiatea = 53%) and more meat (Moorea = 46%, Raiatea = 47%) compared to previous generations (). A higher proportion of people in Raiatea (28%) said their fish consumption was equal to their elders (18% in Moorea), while a higher proportion in Moorea (29%) said their meat consumption was equal to their elders (17% in Raiatea). A total of 14% of respondents in Raiatea did not eat meat, as they were pescatarian (compared to only 1% in Moorea) ().
Out of the top five fish families eaten (reef: Holocentridae, Scaridae, and Acanthuridae; pelagic: Carangidae and Scombridae), Carangidae was the most nutrient dense (153% in total across all five nutrients; ). Both pelagic fish families had the highest concentrations of omega-3 (Carangidae: 86% of RNI, Scombridae: 99%) and iron (Carangidae: 12%, Scombridae: 10%) compared to reef fish families. Calcium concentrations were variable between pelagic families, with Carangidae having the highest (20%), whereas Scombridae was more similar to reef families (<5%). Reef families had higher zinc concentrations, particularly Scaridae (52%) and Acanthuridae (45%). Vitamin A concentrations were variable among reef and pelagic families and highest in Holocentridae (34%) ().
Figure 4. Nutrient densities of 100 g portions of the top five fish families eaten (a) and of food groups (b), calculated as the sum of contributions to daily recommended nutrient intakes (RNI) across five nutrients (calcium, iron, zinc, vitamin A, and omega-3). The contributions of 100 g portions to the maximum recommended daily fat intake (65 g, Drewnowski Citation2009) are also shown for each food group. Values for fish families are means of all fish species in each family mentioned by respondents during interviews. Nutrient estimates for the reef and pelagic fish groups are means of all fish species eaten by respondents. Omega-3 (eicosapentaenoic acid (EPA) + docosahexaenoic acid (DHA)) was assumed to only be present in fish. Nutrient contents of food portions were obtained from Pacific Island food composition tables (FAO Citation2004), except fish which were obtained from the Nutrient Analysis Tool in FishBase (Froese and Pauly Citation2022).
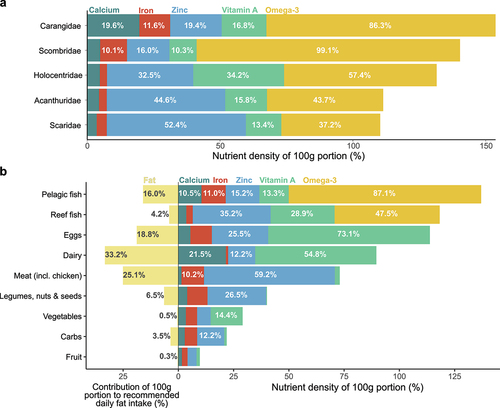
Pelagic fish was the most nutrient dense of all food groups for these five nutrients (137%) and reef fish was second (118%) after eggs and dairy (). The five most nutrient dense food groups were all animal-based, though there was considerable variation in the concentration of each nutrient between food groups. Dairy foods had the highest calcium concentration (22% of RNI) but the lowest iron concentration (1%), whereas iron-rich foods were pelagic fish (11%) and meat (including chicken and tinned meat, 10%). Meat had the highest zinc concentration (59%) followed by reef fish (35%), and foods with high vitamin A content were eggs (73%), dairy (55%) and reef fish (29%) ().
As with nutrient density, the food groups with the highest fat content were from animal sources, with dairy being the highest (33% of the recommended daily total fat intake in 100 g) (). Pelagic fish had higher fat content (16%) than reef fish (4%) and compared to other animal-based food groups, reef and pelagic fish were relatively nutrient-dense and low in fat ().
People on Moorea generally ate each food group more frequently compared to Raiatea (Figure S4). Fish was one of the food groups with the largest difference in frequency of consumption between Moorea (median = 4.0) and Raiatea (median = 1.5). Most food groups were commonly eaten every day in Moorea, however on Raiatea, few people stated they ate any food group every day (Figure S4).
Redundancy analyses of the relationships between respondents’ characteristics and nutrient density of their diets revealed who tended to get more of certain nutrients from fish. Preference for reef fish had the strongest effect on the nutrients people received from fish on both islands (Moorea: F = 31.9, p = 0.001; Raiatea: F = 28.7, p = 0.001) (). People who preferred to eat reef fish had higher intakes of zinc and vitamin A and, conversely, those who ate more pelagic families had higher intakes of calcium, iron, and omega-3, consistent with the nutrient concentrations for those fish groups ().
Figure 5. Analyses of socioeconomic effects and dietary habits on the nutrients in people’s diets. Redundancy analyses for Moorea (a) and Raiatea (b) show associations between people’s background (blue and grey arrows) and five nutrients received from fish and the nutrient density (ND) of their entire diet (red arrows). Explanatory variables with a significance level of p < 0.1 are shown in blue, others are shown in grey. Axes percentages are the variance explained by the data (note different axis scales for RDA 2 between islands). Generalised linear model estimates for the effect of socioeconomics on nutrient intakes are shown for total dietary intakes (c), and from reef (d) and pelagic (e) fish only, with confidence intervals (1.96 × standard error). Significant terms (p ≤ 0.05) are shown in solid colour and non-significant terms are faded. Nutrient estimates for fish species were obtained from the Nutrient Analysis Tool in FishBase (Froese and Pauly Citation2022).
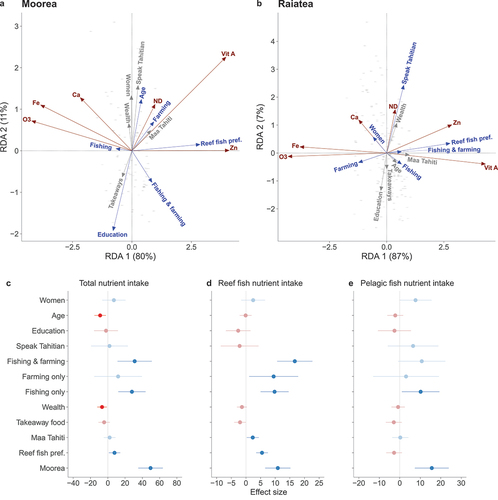
On Moorea, older people and those from farming (but not fishing) households had diets that consisted of more nutritious foods, although effects were small (age: F = 2.4, p = 0.074), while those with a higher level of education had less nutritious diets (F = 5.7, p = 0.005) (). People from households involved in fishing and farming got fewer nutrients associated with pelagic species (calcium, iron, omega-3) and were more aligned with nutrients from reef fish (zinc and vitamin A) (fishing and/or farming: F = 3.5, p = 0.002). On Raiatea, those who spoke Tahitian had more nutrient-dense diets (F = 5.1, p = 0.003) and women to a lesser extent (F = 2.2, p = 0.066) (). People from fishing households (including those who also farmed) got more nutrients associated with reef fish, while people from farming only households got more nutrients from pelagic fish (fishing and/or farming: F = 4.3, p = 0.001).
We fitted models to estimate the relative strength of the drivers identified in redundancy analysis on people’s nutrient intakes. People from fishing households and people in Moorea had higher total nutrient intakes (fishing: effect size = 27.9 ± 8.0 standard error, t = 3.5, p < 0.001; Moorea: 49.5 ± 7.3, t = 6.8, p < 0.001), as well as nutrient intakes from reef (fishing: 9.8 ± 2.4, t = 4.0, p < 0.001; Moorea: 10.9 ± 2.2, t = 5.0, p < 0.001) and pelagic fish (fishing: 10.2 ± 4.7, t = 2.2, p = 0.030; Moorea: 15.6 ± 4.2, t = 3.7, p < 0.001) (). However, for people from fishing households that were also involved in farming, this was not significant for nutrient intakes from pelagic fish (total nutrient intake: 31.1 ± 10.1, t = 3.1, p = 0.002; reef fish: 16.7 ± 3.1, t = 5.4, p < 0.001) (). People from farming households with no involvement in fishing also had higher nutrient intakes from reef fish (9.5 ± 4.3, t = 2.2, p = 0.027). People who preferred to eat reef fish had higher nutrient intakes from reef fish, which could be expected, however they also had higher total nutrient intakes in their diets (7.8 ± 3.4, t = 2.3, p = 0.022). Older people and wealthier people had slightly lower total nutrient intakes (age: −8.8 ± 3.4, t = −2.6, p = 0.010; wealth: −6.6 ± 2.9, t = −2.3, p = 0.021) ( a). Eating Maa Tahiti more often was associated with slightly higher nutrient intakes from reef fish (2.3 ± 1.0, t = 2.2, p = 0.027). Women had higher nutrient intakes, while education and eating more takeaway food had negative effects on nutrient intakes, however these effects were weak and non-significant ().
Discussion
We investigated the resources available to coral reef fisheries and the importance of fish in islander diets through a nutrition lens. Nutrient availability to reef fisheries was highest when live coral cover was low, mainly due to the high biomass of herbivorous fishes, suggesting that nutrient provisioning services can be maintained on these reefs despite periods of habitat degradation. We found that fish was a key component of people’s diets on both islands (despite differences in available reef fish biomass), although there was evidence that the amount of fish people were eating had decreased over time while meat consumption had increased. Socioeconomics were a major driver of fish consumption, for example people from fishing and farming households had higher nutrient intakes from fish. Collectively, our results suggest local food cultures and norms may be stronger drivers of nutrient intakes from fisheries, relative to ecological factors on coral reefs.
High herbivorous fish biomass when live coral cover was low underpinned large contributions of nutrients from reefs. Herbivorous fishes important to fisheries, such as parrotfish, often increase in biomass and productivity following reductions in live coral due to greater benthic algal and detrital food sources (Rogers et al. Citation2018; Morais et al. Citation2020; Rassweiler et al. Citation2020). In Moorea, the initial increase in herbivore biomass following a prolonged crown-of-thorns sea star outbreak and a cyclone facilitated the recovery of hard corals through the removal of competitive algae, leading to altered compositions of reef fish assemblages as corals recovered (Lamy et al. Citation2016). Herbivore biomass (and nutrients) also increased in Moorea in 2019 ( and S3) after coral cover was reduced once more following a coral bleaching event (Speare et al. Citation2022). We highlight the nutritional benefits that low trophic-level fishes (e.g. herbivores) provide to small-scale fisheries on low-coral cover reefs, which will likely continue to be important for food provisioning if reefs become degraded again in future. Comparatively low reef fish biomass in Moorea could potentially be linked to higher fishing pressure in response to high fish consumption and thus market demand for reef fish, particularly as larger fish are preferentially targeted by spearfishers (Rassweiler et al. Citation2020). Fish biomass trends can help inform if the fish consumption patterns on Moorea and Raiatea may be sustained and continue to provide essential nutrients, given the level of reef resources available. Our results suggest careful management may be necessary when fisheries become more dependent on low trophic-level fishes to maintain a plentiful supply of nutrients from these species, particularly when coral cover is relatively high.
As multiple reef and pelagic fishes were important components of diets, it is likely that many islanders receive nutritional benefits from reef and pelagic fisheries. For example, people in fishing households had high nutrient intakes from both fish groups () and would have had high zinc and vitamin A intakes from reef fish, and iron, calcium, and omega-3 intakes from pelagic fish. This could explain why less wealthy people (for example from lower-income households, such as fishers and farmers) had slightly higher nutrient intakes, if their diets contained plenty of locally produced foods, such as fish and vegetables they harvested themselves. For example, it is common for fishers to keep a share of their catch to eat within their household (Kawarazuka and Béné Citation2010). The popularity of carangid and scombrid fishes on both islands () suggests islanders received health benefits associated with eating pelagic fish rich in omega-3, calcium and iron. Adequate omega-3 intakes can help to prevent obesity-related health issues, which are particularly prevalent in French Polynesia (Inamo et al. Citation2011), and so pelagic fish could be hugely beneficial to those who regularly eat them, for example fishing households and Mooreans (). Fish is available at many roadside points around Moorea, whereas in Raiatea, fish and other foods tend to be sold at a large market in the north of the island (pers. obs.), which would have influenced people’s access to fish and could explain the higher frequency of fish consumption in Moorea.
Although fisheries in French Polynesia were important for supporting people’s nutritional needs, we also found evidence that fish consumption may have decreased from one generation to the next, along with an increase in meat consumption. Meat is nutrient-dense and could provide people with higher zinc intakes compared to reef fish, but with the added cost of having a higher fat content (). Globalisation of French Polynesia’s food system may have contributed to the loss of some traditional food cultures (Hughes and Lawrence Citation2005), with an increase in Western, industrialised food imports, particularly processed meat high in saturated fat and foods with high amounts of added sugar (Brewer et al. Citation2023). The increasing reliance on imported food in French Polynesia has corresponded to the high proportion of overweight and obese adults (Hawley and McGarvey Citation2015), therefore promoting traditional Polynesian diets and reducing reliance on imported foods could help to address these diet-related health issues (DiBello et al. Citation2009; Thow et al. Citation2011). As omega-3 can counteract the negative health effects of saturated fat found in red meat and many other Western foods (Shahidi and Ambigaipalan Citation2018), locally caught fish (especially pelagics) may be a particularly important food source alongside meat for those with a high reliance on imported foods.
The varying effects of people’s socioeconomic attributes on their consumption habits indicates social norms, habit, and identity can have a large influence on their nutrition (Baumhofer et al. Citation2020). We found that aspects of Polynesian culture, such as regularly eating Maa Tahiti, and speaking Tahitian in Raiatea, had positive effects on nutrition, suggesting traditional customs may be associated with health benefits. Lower total nutrient intakes in the elderly could be of concern, however this has previously been observed in French Polynesia as food intakes decrease with age (WHO Citation2003). Although there were no strong effects, our results indicate women may have had more nutritious diets and had higher nutrient intakes compared to men, which is typical worldwide (Miller et al. Citation2022). Therefore, efforts to promote nutritious diets in French Polynesian men could result in health benefits. The causes of the large differences in nutrient intakes between people in Moorea and Raiatea are presumably due to Mooreans generally consuming foods more frequently. It is unclear from our results whether this is an indication of overconsumption in Moorea or of limited nutrient intakes in Raiatea. This island effect on nutrition may stem from differences in food culture and may warrant further investigation.
Conclusion
Our study highlights the importance of nutrient-dense reef and pelagic fish from local fisheries to societies in French Polynesia. The nutrient provisioning services provided by coral reef ecosystems can be maintained when the condition of coral habitat is reduced. Despite the globalisation and industrialisation of the food system increasing reliance on imported food, it was apparent that traditional diets rich in nutritious fish had persisted in French Polynesia. While more research is needed into specific drivers of people’s food acquisition and consumption habits, our study highlights which demographics benefited most from fisheries-derived nutrition and reveals those where potential improvements to nutrition could be made. Time series of social data alongside ecological data would be immensely valuable for similar studies in the future to more closely connect reef ecosystems and their influence on human nutrition, particularly as islander diets transition over time.
Supplemental Material 1
Download PDF (544.6 KB)Supplemental Material 2
Download PDF (721 KB)Supplemental Material 3
Download MS Excel (226.7 KB)Acknowledgements
MH was funded by a studentship from the NERC Envision Doctoral Training Partnership (NE/S007423/1). EM and JPWR were funded by Early Career Fellowships from the Leverhulme Trust. JPWR was funded by a Royal Society University Research Fellowship (URF\R1\231087). NAJG was funded by a Royal Society University Research Fellowship (URF\R\201029) and a Philip Leverhulme Prize from the Leverhulme Trust.. JC was funded by Biodiversa (METRODIVER and MOVE) and Fondation de France (MultiNet). CCH was funded by an ERC Starting Grant and a Philip Leverhulme Prize from the Leverhulme Trust.. Fieldwork was funded by the Fondation de France (Nutrition). Interviewers in French Polynesia were CM, VV, Juliette Languille and Vahinerii Tautoo. We thank the Service National d’Observation CORAIL from CRIOBE for providing data on reef fish biomass and coral cover. Lisa Boström-Einarsson assisted with R code to produce Figure S1. This study was conducted with approval of the Faculty of Science and Technology Research Ethics Committee, Lancaster University (ref: FST18040). We thank two anonymous reviewers for their constructive comments which improved our manuscript.
Disclosure statement
No potential conflict of interest was reported by the author(s).
Data availability statement
Data and R code used in analyses and to produce figures can be found in the following repository on GitHub: https://github.com/Mark-H-22/FP-fish-diets/.
Supplementary material
Supplemental data for this article can be accessed online at https://doi.org/10.1080/26395916.2024.2351385
Additional information
Funding
References
- Andrew NL, Allison EH, Brewer T, Connell J, Eriksson H, Eurich JG, Farmery A, Gephart JA, Golden CD, Herrero M, et al. 2022. Continuity and change in the contemporary Pacific food system. Global Food Secur. 32:100608. doi: 10.1016/j.gfs.2021.100608.
- Ayhan HÖ. 2011. Non-probability sampling survey methods. In: Lovric M, editor. International encyclopedia of statistical science. Berlin: Springer; p. 1–13. doi: 10.1007/978-3-642-04898-2_41.
- Baumhofer NK, Panapasa SV, Cook EF, Roberto CA, Williams DR. 2020. Sociodemographic factors influencing island foods consumption in the Pacific Islander health study. Ethn Health. 25(2):305–321. doi: 10.1080/13557858.2017.1418300.
- Beal T, Massiot E, Arsenault JE, Smith MR, Hijmans RJ, Bermano G. 2017. Global trends in dietary micronutrient supplies and estimated prevalence of inadequate intakes. PLOS ONE. 12(4):e0175554. doi: 10.1371/journal.pone.0175554.
- Bell JD, Ganachaud A, Gehrke PC, Griffiths SP, Hobday AJ, Hoegh-Guldberg O, Johnson JE, Le Borgne R, Lehodey P, Lough JM, et al. 2013. Mixed responses of tropical Pacific fisheries and aquaculture to climate change. Nature Clim Change. 3(6):591–599. doi: 10.1038/nclimate1838.
- Belton B, Thilsted SH. 2014. Fisheries in transition: food and nutrition security implications for the global south. Global Food Secur. 3(1):59–66. doi: 10.1016/j.gfs.2013.10.001.
- Brewer TD, Andrew NL, Abbott D, Detenamo R, Faaola EN, Gounder PV, Lal N, Lui K, Ravuvu A, Sapalojang D, et al. 2023. The role of trade in pacific food security and nutrition. Global Food Secur. 36:100670. doi: 10.1016/j.gfs.2022.100670.
- Brown CJ, Broadley A, Adame MF, Branch TA, Turschwell MP, Connolly RM. 2019. The assessment of fishery status depends on fish habitats. Fish Fish. 20(1):1–14. doi: 10.1111/faf.12318.
- Chauvet C, Galzin R. 1996. The lagoon fisheries of French polynesia. Naga, The ICLARM Quarterly. http://worldfish.catalog.cgiar.org/naga/na_2244.pdf.
- Cruz-Trinidad A, Aliño PM, Geronimo RC, Cabral RB. 2014. Linking food security with coral reefs and fisheries in the coral triangle. Coastal Manage. 42(2):160–182. doi: 10.1080/08920753.2014.877761.
- Daigre J-L, Atallah A, Boissin J-L, Jean-Baptiste G, Kangambega P, Chevalier H, Balkau B, Smadja D, Inamo J. 2012. The prevalence of overweight and obesity, and distribution of waist circumference, in adults and children in the French Overseas Territories: the PODIUM survey. Diabetes Metab. 38(5):404–411. doi: 10.1016/j.diabet.2012.03.008.
- DiBello JR, McGarvey ST, Kraft P, Goldberg R, Campos H, Quested C, Laumoli TS, Baylin A. 2009. Dietary patterns are associated with metabolic syndrome in adult samoans. J Nutr. 139(10):1933–1943. doi: 10.3945/jn.109.107888.
- Drewnowski A. 2009. Defining nutrient density: development and validation of the nutrient rich doods index. J Am Coll Nutr. 28(4):421S–426S. doi: 10.1080/07315724.2009.10718106.
- [EFSA] European Food Safety Authority. 2010. Scientific opinion on dietary reference values for fats, including saturated fatty acids, polyunsaturated fatty acids, monounsaturated fatty acids, trans fatty acids, and cholesterol. Efsa J. 8(3):1461. doi:10.2903/j.efsa.2010.1461.
- Ferguson EL, Watson L, Berger J, Chea M, Chittchang U, Fahmida U, Khov K, Kounnavong S, Le BM, Rojroongwasinkul N, et al. 2019. Realistic food-based approaches alone may not ensure dietary adequacy for women and young children in South-East Asia. Matern Child Health J. 23(S1):55–66. doi: 10.1007/s10995-018-2638-3.
- Food and Agriculture Organisation. 1988. Requirements of Vitamin A, Iron, Folate, and Vitamin B12: Report of a Joint FAO/WHO Expert Consultation. FAO Food and Nutrition Series, Rome, Italy.
- Food and Agriculture Organisation. 2004. The Pacific Islands food composition tables. 2nd ed. Rome, Italy. https://www.fao.org/3/y5432e/y5432e00.htm.
- Food and Agriculture Organisation. 2022. FAO/WHO Global Individual Food consumption data Tool (GIFT): methodological document. FAO. https://www.fao.org/3/cb8809en/cb8809en.pdf.
- Friel S, Baker PI. 2009. Equity, food security and health equity in the Asia Pacific region. Asia Pac J Clin Nutr. 18(4):620–632.
- Froese, R, 2006. Cube law, condition factor and weight–length relationships: history, meta-analysis and recommendations. Journal of Applied Ichthyology. 22:241–253. doi: 10.1111/j.1439-0426.2006.00805.x.
- Froese R, Pauly D, editors. 2022. FishBase. World Wide Web electronic publication. version (08/2022). www.fishbase.org.
- Golden CD, Allison EH, Cheung WWL, Dey MM, Halpern BS, McCauley DJ, Smith M, Vaitla B, Zeller D, Myers SS. 2016. Nutrition: fall in fish catch threatens human health. Nature. 534(7607):317–320. doi: 10.1038/534317a.
- Golden CD, Koehn JZ, Shepon A, Passarelli S, Free CM, Viana DF, Matthey H, Eurich JG, Gephart JA, Fluet-Chouinard E, et al. 2021. Aquatic foods to nourish nations. Nature. 598(7880):315–320. doi: 10.1038/s41586-021-03917-1.
- Greenacre M. 2018. Compositional data analysis in practice. New York, USA: Chapman & Hall, CRC Press.
- Hawley NL, McGarvey ST. 2015. Obesity and diabetes in pacific islanders: the Current Burden and the need for urgent action. Curr Diab Rep. 15(5):29. doi: 10.1007/s11892-015-0594-5.
- Heilpern SA, Fiorella K, CañCañAs C, Flecker AS, Moya L, Naeem S, Sethi SA, Uriarte M, DeFries R. 2021. Substitution of inland fisheries with aquaculture and chicken undermines human nutrition in the Peruvian Amazon. Nat Food. 2(3):192–197. doi: 10.1038/s43016-021-00242-8.
- Hicks CC, Cohen PJ, Graham NAJ, Nash KL, Allison EH, D’Lima C, Mills DJ, Roscher M, Thilsted SH, Thorne-Lyman AL, et al. 2019. Harnessing global fisheries to tackle micronutrient deficiencies. Nature. 574(7776):95–98. doi: 10.1038/s41586-019-1592-6.
- Hicks CC, Graham NAJ, Maire E, Robinson JPW. 2021. Secure local aquatic food systems in the face of declining coral reefs. One Earth. 4(9):1214–1216. doi: 10.1016/j.oneear.2021.08.023.
- Hughes RG, Lawrence MA. 2005. Globalisation, food and health in Pacific Island countries. Asia Pac J Clin Nutr. 14(4):298–306.
- Hughes RG, Marks GC. 2009. Against the tide of change: diet and health in the Pacific Islands. J Am Diet Assoc. 109(10):1700–1703. doi: 10.1016/j.jada.2009.07.015.
- Inamo J, Daigre J-L, Boissin J-L, Kangambega P, Larifla L, Chevallier H, Balkau B, Smadja D, Atallah A. 2011. High blood pressure and obesity: disparities among four French overseas territories. J Hypertens. 29(8):1494. doi: 10.1097/HJH.0b013e328348fd95.
- Institute of Statistics of French Polynesia. 2017. Detailed figures. [accessed 2022 Aug 11]. https://www.ispf.pf/chiffres.
- Kawarazuka N, Béné C. 2010. Linking small-scale fisheries and aquaculture to household nutritional security: an overview. Food Sec. 2(4):343–357. doi: 10.1007/s12571-010-0079-y.
- Kawarazuka N, Béné C. 2011. The potential role of small fish species in improving micronutrient deficiencies in developing countries: building evidence. Public Health Nutr. 14(11):1927–1938. doi: 10.1017/S1368980011000814.
- Kennedy PG, Ballard T, Dop M. 2011. Guidelines for measuring household and individual dietary diversity. Rome, Italy: Nutrition and Consumer Protection Division, FAO, FANTA.
- Lamy T, Galzin R, Kulbicki M, Lison de Loma T, Claudet J. 2016. Three decades of recurrent declines and recoveries in corals belie ongoing change in fish assemblages. Coral Reefs. 35(1):293–302. doi: 10.1007/s00338-015-1371-2.
- Leenhardt P, Lauer M, Madi Moussa R, Holbrook SJ, Rassweiler A, Schmitt RJ, Claudet J. 2016. Complexities and uncertainties in transitioning small-scale coral reef fisheries. Front Mar Sci. 3:70. doi: 10.3389/fmars.2016.00070.
- Maire E, Graham NAJ, MacNeil MA, Lam VWY, Robinson JPW, Cheung WWL, Hicks CC. 2021. Micronutrient supply from global marine fisheries under climate change and overfishing. Curr Biol. 31(18):4132–4138.e3. doi: 10.1016/j.cub.2021.06.067.
- Miller V, Webb P, Cudhea F, Shi P, Zhang J, Reedy J, Erndt-Marino J, Coates J, Mozaffarian D, Bas M. 2022. Global dietary quality in 185 countries from 1990 to 2018 show wide differences by nation, age, education, and urbanicity. Nat Food. 3(9):694–702. doi: 10.1038/s43016-022-00594-9.
- Morais RA, Connolly SR, Bellwood DR. 2020. Human exploitation shapes productivity–biomass relationships on coral reefs. Global Change Biol. 26(3):1295–1305. doi: 10.1111/gcb.14941.
- Morais RA, Depczynski M, Fulton C, Marnane M, Narvaez P, Huertas V, Brandl SJ, Bellwood DR, El‐Sabaawi R. 2020. Severe coral loss shifts energetic dynamics on a coral reef. Funct Ecol. 34(7):1507–1518. doi: 10.1111/1365-2435.13568.
- Nassiri A, Thébaud O, Holbrook SJ, Lauer M, Rassweiler A, Schmitt RJ, Claudet J. 2021. Hedonic evaluation of coral reef fish prices on a direct sale market. Mar Policy. 129:104525. doi: 10.1016/j.marpol.2021.104525.
- Oksanen J, Simpson G, Blanchet F, Kindt R, Legendre P, Minchin P, O’Hara R, Solymos P, Stevens M, Szoecs E, et al. 2022. Vegan: Community Ecology Package. R package version 2.6-4. https://CRAN.R-project.org/package=vegan.
- Parravicini V, Casey JM, Schiettekatte NMD, Brandl SJ, Pozas-Schacre C, Carlot J, Edgar GJ, Graham NAJ, Harmelin-Vivien M, Kulbicki M, et al. 2020. Delineating reef fish trophic guilds with global gut content data synthesis and phylogeny. PLOS Biol. 18(12):e3000702. doi: 10.1371/journal.pbio.3000702.
- Parry J. 2010. Conference calls for urgent action on food security in Pacific. BMJ. 340(apr28 2):c2321. doi: 10.1136/bmj.c2321.
- Pérez-Rosales G, Brandl SJ, Chancerelle Y, Siu G, Martinez E, Parravicini V, Hédouin L. 2021. Documenting decadal disturbance dynamics reveals archipelago-specific recovery and compositional change on Polynesian reefs. Mar Pollut Bull. 170:112659. doi: 10.1016/j.marpolbul.2021.112659.
- Rassweiler A, Lauer M, Lester SE, Holbrook SJ, Schmitt RJ, Madi Moussa R, Munsterman KS, Lenihan HS, Brooks AJ, Wencélius J, et al. 2020. Perceptions and responses of Pacific Island fishers to changing coral reefs. AMBIO. 49(1):130–143. doi: 10.1007/s13280-019-01154-5.
- R Core Team. 2022. R: A language and environment for statistical computing. Vienna, Austria: R Foundation for Statistical Computing. https://www.R-project.org/.
- Robinson JPW, Maire E, Bodin N, Hempson TN, Graham NAJ, Wilson SK, MacNeil MA, Hicks CC. 2022. Climate-induced increases in micronutrient availability for coral reef fisheries. One Earth. 5(1):98–108. doi: 10.1016/j.oneear.2021.12.005.
- Robinson JPW, Mills DJ, Asiedu GA, Byrd K, Mancha Cisneros MDM, Cohen PJ, Fiorella KJ, Graham NAJ, MacNeil MA, Maire E, et al. 2022. Small pelagic fish supply abundant and affordable micronutrients to low- and middle-income countries. Nat Food. 3(12):1075–1084. doi: 10.1038/s43016-022-00643-3.
- Robinson JPW, Wilson SK, Robinson J, Gerry C, Lucas J, Assan C, Govinden R, Jennings S, Graham NAJ. 2019. Productive instability of coral reef fisheries after climate-driven regime shifts. Nat Ecol Evol. 3(2):183–190. doi: 10.1038/s41559-018-0715-z.
- Rogers A, Blanchard JL, Mumby PJ, Arlinghaus R. 2018. Fisheries productivity under progressive coral reef degradation. J Appl Ecol. 55(3):1041–1049. doi: 10.1111/1365-2664.13051.
- Sahal Estimé M, Lutz B, Strobel F. 2014. Trade as a structural driver of dietary risk factors for noncommunicable diseases in the Pacific: an analysis of household income and expenditure survey data. Global Health. 10(1):48. doi: 10.1186/1744-8603-10-48.
- Shahidi F, Ambigaipalan P. 2018. Omega-3 polyunsaturated fatty acids and their health benefits. Annu Rev Food Sci Technol. 9(1):345–381. doi: 10.1146/annurev-food-111317-095850.
- Speare KE, Adam TC, Winslow EM, Lenihan HS, Burkepile DE. 2022. Size-dependent mortality of corals during marine heatwave erodes recovery capacity of a coral reef. Global Change Biol. 28(4):1342–1358. doi: 10.1111/gcb.16000.
- Stevens GA, Beal T, Mbuya MNN, Luo H, Neufeld LM, Addo OY, Adu-Afarwuah S, Alayón S, Bhutta Z, Brown KH, et al. 2022. Micronutrient deficiencies among preschool-aged children and women of reproductive age worldwide: a pooled analysis of individual-level data from population-representative surveys. Lancet Global Health. 10(11):e1590–e1599. doi: 10.1016/S2214-109X(22)00367-9.
- Thow AM, Heywood P, Schultz J, Quested C, Jan S, Colagiuri S. 2011. Trade and the nutrition transition: strengthening policy for health in the Pacific. Ecol Food Nutr. 50(1):18–42. doi: 10.1080/03670244.2010.524104.
- Tilman D, Clark M. 2014. Global diets link environmental sustainability and human health. Nature. 515(7528):518–522. doi: 10.1038/nature13959.
- Woodhead AJ, Hicks CC, Norström AV, Williams GJ, Graham NAJ. 2019. Coral reef ecosystem services in the Anthropocene. Funct Ecol. 33:1023–1034. doi: 10.1111/1365-2435.13331.
- World Health Organisation. 2003. Diet, food supply and obesity in the Pacific. NLM Classification: WA 695. ISBN 92 9061 044 1. https://apps.who.int/iris/bitstream/handle/10665/206945/9290610441_eng.
- World Health Organisation, Food and Agriculture Organisation of the United Nations editor. 2004. Vitamin and mineral requirements in human nutrition. 2nd ed. Rome: WHO; FAO, Geneva.
- Zuur AF, Ieno EN. 2016. A protocol for conducting and presenting results of regression-type analyses. Methods Ecol Evol. 7(6):636–645. doi: 10.1111/2041-210X.12577.