
ABSTRACT
The Sundarbans mangrove forest in Bangladesh underpins local livelihoods in multiple ways, but its ecological integrity is under threat. In this paper, we seek to explore how local people value the Sundarbans landscapes spatially and how the Sundarbans contributes to their sense of place. To elicit spatially distributed landscape values, we applied a Public Participation GIS (PPGIS) method with 344 local people of the Sundarbans in the Bagerhat district, Bangladesh, and we collected 2007 geo-locations. Our study reveals that the Sundarbans mangrove forest is most frequently valued for enabling social activities (37.3% of all identified points). Other important landscape values were fishing, aesthetics, recreation, and honey collection, which were relatively widely distributed throughout the Sundarbans protected area. The local people also identified dependency on the Sundarbans for their livelihoods and for protection against biophysical threats such as cyclones and storms. The Sundarbans forest shapes people’s sense of place in the form of place identity, place attachment, and place dependence. This study demonstrates the value of spatial data and investigating sense of place in policy and planning for mangrove biodiversity hotspots.
EDITED BY:
Introduction
Delta landscapes are dynamic social-ecological systems that provide essential habitat for biodiversity and support the livelihoods of local people. Worldwide, there are more than 500 million people living in delta landscapes (Ghosh et al. Citation2023), of which many contain mangrove forest. These landscapes provide multiple benefits to people, including opportunities for fishing and aquaculture, and protection against flood and storm surges. However, these landscapes and their inhabitants are increasingly threatened by climate change-related processes, such as sea-level rise and shifting rainfall patterns, as well as human activities, such as construction, increasing tourism, and infrastructure development (Edmonds et al. Citation2020). Such activities threaten the natural integrity of delta landscapes and, in turn, their capacity to sustain people (Collins et al. Citation2023).
Mangrove forest restoration and community-based disaster protection can lead to improved deltaic landscape conservation. However, current delta management frequently lacks public participation (Ghosh et al. Citation2023). Understanding the values that local people associate with the landscape is an important part of integrating people into conservation. These values may be known as landscape values (Brown et al. Citation2020), but have also been analyzed using ecosystem services or nature’s contributions to people frameworks (e.g. Plieninger et al. Citation2013; Kadykalo et al. Citation2019). Landscape values may be understood as those aspects of landscape that contribute to human wellbeing (Garcia-Martin et al. Citation2017). Material landscape values such as honey production (GoB Citation2010) and fishing (Poe et al. Citation2016) support livelihoods. Non-material landscape values can contribute to people’s mental wellbeing (Masterson et al. Citation2017; Solecka et al. Citation2022). These values can be recreational (Dasgupta et al. Citation2021), aesthetic or spiritual (Baumeister et al. Citation2022).
People’s relationship with landscape is mediated by their socioeconomic characteristics, such as age, gender, and occupation. For instance, Shoyama and Yamagata (Citation2016) found younger residents in the Kushiro watershed in Northern Japan preferred cultural services more intensively compared to older people. Older people were more satisfied with the beauty of the countryside while the younger people were not (Swanwick Citation2009) in the United Kingdom. Yang et al. (Citation2018) found that water quality, biodiversity, and erosion control were more frequently perceived by women, whereas men identified fuel and timber services more often.
One particular landscape value is sense of place (Masterson et al. Citation2017; Wartmann and Purves Citation2018), which has often been less considered than recreation, aesthetic, and spiritual values (Plieninger et al. Citation2013; Wartmann and Purves Citation2018). Sense of place is developed by experiences of living in a place, both as an individual or as a society, and the meaning attached to that place (Masterson et al. Citation2017; Hawthorne et al. Citation2022). Place meaning and place attachment, two central aspects of sense of place, are dependent on each other (Gottwald et al. Citation2022). However, the meaning of a place may vary according to material advantages, symbolic meaning, inherent societal norm, and day to day involvement (Williams Citation2014). Attachment with a place can be emotional, or a direct bond or physical connection that expresses a relationship between people and place. Dimensions of place attachment are place identity and place dependence (Masterson et al. Citation2017). Place identity can be expressed as an emotional perspective and is related to belonging (Tapsuwan et al. Citation2011; Brown et al. Citation2015; Gottwald et al. Citation2022). In contrast, place dependence is active engagement with a place fulfilling some physical needs (Tapsuwan et al. Citation2011) that can be expressed as functional attachment (Gottwald et al. Citation2022). All these dimensions of sense of place can have an influential role in people’s awareness raising towards conservation (Mullendore et al. Citation2015).
Different types of landscape values can be elicited through spatial assessment, an essential part of sustainable land use planning and management (Alessa et al. Citation2008; Cusens et al. Citation2021; Gottwald et al. Citation2022). Mapping landscape values helps to relate human perception to landscape features in social-ecological systems (Alessa et al. Citation2008), as it can easily connect public preferences to the landscape to which they belong (Brown et al. Citation2012; Baumeister et al. Citation2022). Visualization of values through landscape mapping also helps in understanding and adapting the highly prioritized values and special areas to be focused for management (Plieninger et al. Citation2013).
Accordingly, Public Participation Geographic Information System (PPGIS) approaches have been widely used in geography and sustainability science to involve people in practical GIS that helps to assess values perceived by local people and their knowledge about a place (Brown and Weber Citation2011; Brown et al. Citation2014; Plieninger et al. Citation2018; Cusens et al. Citation2021). PPGIS has been practiced to, for instance, map cultural ecosystem services (Plieninger et al. Citation2013), emotional attachment (Hawthorne et al. Citation2022), adolescent’s sense of place (Hewitt et al. Citation2020), and sense of place in cultivated land (Pérez-Ramírez et al. Citation2019), but few such studies have taken place in delta landscapes.
The largest river delta in the world is the Sundarbans delta, also known as the Ganges delta, located on the Ganges-Brahmaputra-Meghna river in India and Bangladesh. This region contains extensive mangrove forest that provides habitat for many endemic wildlife species, most notably the endangered Royal Bengal Tiger (Islam et al. Citation2017; Banerjee et al. Citation2023). Furthermore, the Sundarbans mangrove forest plays a vital role in balancing the environment through carbon sequestration (Mitra et al. Citation2012). This unique ecosystem is central for the livelihood and wellbeing of the local people living adjacent to the forest, both in terms of material value, such as supply of foods (fruits, honey, fish), and non-material value, such as recreation and spiritual value (Chowdhury and Hafsa Citation2022). Anthropogenic impacts are serious threats (Hagger et al. Citation2022) to this mangrove delta. For example, overharvesting of resources threatens the forest ecosystems (Prusty et al. Citation2017; Sunny Citation2017). Also, climate change is a serious threat to the Sundarbans delta and vulnerable people living around it (Dasgupta et al. Citation2020) which has impacts on the frequency and intensity of cyclones. Most recently, cyclone Amphan in 2020 hit coastal Bangladesh and India, destroyed thousands of shelters, and made landfall in the Sundarbans (Banerjee et al. Citation2023). Storm surges and increasing salinity are also major problems (Ghosh et al. Citation2023). As a consequence, livelihoods are at risk (Ayeb-Karlsson et al. Citation2016) in this region. Administrative interventions (Mallick et al. Citation2021) such as seasonal ban on harvesting also impacts livelihoods and tend to overharvesting of resources. Therefore, identifying threats to the livelihoods are also important to design conservation policies against mangrove destruction. Non-material landscape values have been spatially assessed in the Indian part of the Sundarbans region (Dasgupta et al. Citation2021), but less attention has been paid to the Bangladeshi side. In this study, our objective was to spatially elicit landscape values (both material and non-material), and explore local people’s sense of place in the Sundarbans mangrove forest in Bangladesh. We developed a PPGIS survey to answer the following research questions:
How are material and non-material landscape values spatially distributed in the Bangladeshi Sundarbans delta?
How do mapped landscape values vary with respondent’s socio-demographic characteristics?
How does the Bangladeshi Sundarbans delta contribute to local people’s sense of place?
What do local people in the Bangladeshi Sundarbans perceive as threats to their livelihoods and sense of place?
Methods
Study area
The Sundarbans delta and mangrove forest are located in the coastal region of the Bay of Bengal, shared by Bangladesh and India (Nasrin et al. Citation2021). The total area of the Sundarbans is approximately 10,000 km2 (Sannigrahi et al. Citation2020; Dasgupta et al. Citation2021), of which nearly 60% (6000 km2) is located in Bangladesh (Iqbal and Hossain Citation2022). This area is split into three administrative districts: Satkhira, Khulna, and Bagerhat (). A 10 km buffer zone around the Sundarbans mangrove forest is designated as an Ecologically Critical Area (ECA) where development activities are restricted by the government of Bangladesh (GoB Citation2010; CEGIS Citation2016).
Figure 1. Study area: The Sundarbans Reserve Forest (SRF) and study area extent (SRF plus a 10 km buffer zone).
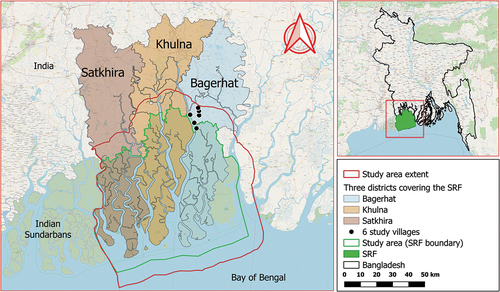
Around 31% of land cover in the Sundarbans are waterbodies, such as rivers and canals (Sarker et al. Citation2016). The three protected areas (known as Wildlife Sanctuaries) in the Bangladeshi part of the Sundarbans (Sundarbans East, West, and South wildlife sanctuaries) (Hossain et al. Citation2018), have been declared as UNESCO World Heritage Site in 1997 (Islam et al. Citation2018; Khan et al. Citation2020). Within these three wildlife sanctuaries, all kinds of resource harvesting is strictly prohibited (MoEFC Citation2022). Forest dependence among local people is shown through regional culture and language. For example, depending on the forest-related activities and involvement, different groups of people engaged with the mangrove forest have specific local names, such as Bawalis (wood and golpata collectors), Mawalis (honey collectors), and Jele (fisher) (Roy et al. Citation2013; Saito et al. Citation2020). We selected six villages in the Mongla Upazila in Bagerhat district for our study. The study villages, namely Kanainagar, Sundartola, Joymoni, Mithakhali, Duttermeth, and Burburia, were selected purposively based on their proximity to the Sundarbans mangrove forest boundary (). All villages were located within the ECA of the Sundarbans mangrove forest (see Supplementary Material).
PPGIS survey design
To elicit landscape values spatially, we employed PPGIS, where participants identify locations on the map of a particular landscape (Alessa et al. Citation2008). There are several ways to collect spatial data in landscape value assessment study, such as paper maps and digital maps (Brown and Reed Citation2009). An internet based PPGIS approach is commonly used (Baumeister et al. Citation2022) because it is time and cost effective compared with other approaches (Brown and Reed Citation2009). Thus, we used the internet-based tool Maptionnaire-a licensed-based mapping software that helps to create and design digital PPGIS survey to elicit landscape attributes. In our case, we used a tablet incorporating mobile network to run the Maptionnaire software (see www.maptionnaire.com). Additionally, we set the open street map as the base map on Maptionnaire. On the Maptionnaire platform, we set up all the questions and information. The first page was an information page and consent form. The survey was designed to gather three types of information: spatial locations of material and non-material landscape values, responses to open-ended questions about sense of place, and socio-demographic characteristics. We chose to use the concept of landscape values rather than ecosystem services or nature’s contributions to people as it may be easier to conceptualize for respondents and the spatial aspect is explicit.
For mapping of location-based values, we identified 10 categories of landscape values based on prior PPGIS studies and tailored to the Sundarbans context: fishing/crab collection, honey collection, firewood and building material (GoB Citation2010), medicinal plants, social activities, aesthetic, recreation, spiritual/religious, learning and inspiration, and cultural heritage (Brown and Reed Citation2000; Plieninger et al. Citation2013; Díaz et al. Citation2018; Hewitt et al. Citation2020; Dasgupta et al. Citation2021). We showed participants a digital map of the Sundarbans and asked them to identify locations they associated with these categories. We facilitated our respondents with a printed version of the study area map which was very useful to make them familiar with the spatial character of the Sundarbans. To clearly identify a place, we helped them through zoom in and out of our map extent. Locations that could be mapped were limited to the Sundarbans mangrove forest area plus a 10 km buffer zone but there were no limitations placed on distance within the SRF and study area extent. To explore more deeply how local people do perceive a sense of place in their landscape, we asked three open questions: I) How is the Sundarbans meaningful to you? II) Which bio-physical features of the landscape contribute to your sense of place? III) What are the threats to your sense of place, either at present or in the future? Lastly, we collected socio-demographic information including respondent’s age, gender, education, profession, and religion.
Data collection
Our survey took place between June 15 and 15 September 2022. We made a pilot survey in the first week to test the clarity of the interview questions and to adjust the survey accordingly. We applied a systematic random sampling method to reach a representative sample of the local village populations. We chose central starting points in each village, such as a roundabout, tea stall, or marketplace. We then commenced by selecting the first household immediately next to each starting point and proceeded to interview an available individual in every 5th household from there on, resulting in a sample of 344 individuals. In the case of unavailable representatives/households, we interviewed the next available neighbour. We limited our respondents to those being 18 years or older. The survey was carried out by the first author and two field assistants. The average duration of an interview was 17 minutes. The language of instruction and data collection was Bengali, but responses were directly translated to English for entry into the Maptionnaire platform. Each participant was informed about the concept and purposes of the study and uses of the data, and their informed consent to participate was obtained verbally before starting the survey. Respondents were asked to digitally map point features for each of the activities they do, benefits they find, observe, and feel in the Sundarbans and surrounding their home. We allowed each respondent to map more than one place of landscape values. Additionally, they were requested to name a place (if it was an important place for them) not listed on the survey platform as ‘other place of interest’.
Data analysis
We used Quantum GIS (version 3.26) for the visualization of the spatial distribution of landscape values and spatial density analysis. To identify hot and cold spots of landscape values, we used the Kernel Density Estimation tool. This tool shows high and low spatial density based on point intensity (Baumeister et al. Citation2020). Higher density of points indicates hot spots and lower density of points indicates cold spots. To get an overview of the distribution of points at the village scale, we created maps for each village plus a 1.5 km buffer (see Supplementary Material).
We calculated the frequency and frequency percentage for each socio-demographic characteristic such as age, gender, education, profession, and religion. We calculated the frequency of total mapped points for each of the landscape values and compared it with the socio-demographic characteristics. We performed Kruskal-Wallis test because we have more than two groups of independent variables of each category of our socio-demographic information, e.g. in age, profession, education () to see if total mapped landscape values per respondent were related to socio-demographic characteristics and Wilcoxon rank-sum tests with gender to compare between male and female perceptions on landscape values. Frequency analyses and statistical tests were performed in R (version 4.1.2).
Table 1. Kruskal-Wallis tests of differences in the number of mapped landscape values between sociodemographic categories of respondents.
To analyze the open-ended responses on sense of place, we used MAXQDA-22 software (VERBI Software, Citation2022). Initially, we coded these responses inductively. Inductive coding is a data-driven approach where the possible responses are totally unknown prior to the categorization (Rädiker and Kuckartz Citation2020). Then, we counted the frequency for a respondent’s perceived sense of place. We presented examples for each aspect of perceived sense of place from the coded segments (). Finally, we categorized each of these themes into three sub-components: place identity, place attachment, and place dependence (Jorgensen and Stedman Citation2006; Sherrouse et al. Citation2011; Tapsuwan et al. Citation2011; Mullendore et al. Citation2015; Gottwald et al. Citation2022) as sense of place has sometimes been considered as accumulation of these three sub-components (Mullendore et al. Citation2015). We applied the same method to identify the perceived bio-physical features and perceived threats to the respondent’s livelihoods and sense of place.
Table 2. Perceived sense of place in the Sundarbans mangrove forest.
Results
Respondent profiles
A total of 344 respondents participated in our study (female: 36.3%, male: 63.7%). Respondents were distributed across four age groups; 18–35 years (38.1%), 36–50 years (30.2%), 51–65 years (23.0%), and older than 65 years (8.7%). A total of 37.2% of our respondents did not complete formal schooling (). However, 29.1% of the respondents completed primary school, followed by secondary school (18.9%), high school (8.7%), bachelor degree (3.8%), master degree (2.0%), and technical college (0.3%). More respondents worked as homemakers (28.2%) than any other occupation, followed by work in aquaculture (16.9%), fishing and crab collection (16.0%). The most commonly held religion in the study area was Islam (70.1%), followed by Hinduism (27.6%), and Christianity (2.3%).
Spatial distribution of landscape values
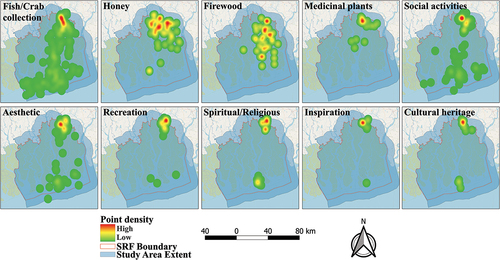
We collected altogether 1934 locations for our 10 specified landscape values. The most frequently mapped landscape values were for social activities (37.3%), followed by fishing/crab collection (22.8%), aesthetic (14.5%), recreation (10.4%), and spiritual (5.7%) (). Less frequently mapped landscape values were cultural heritage (0.9%), medicinal plants (1.0%), learning and inspiration (1.2%), firewood and building material (2.0%), and honey (4.1%). Respondents listed 73 ‘other places of interest’ that did not correspond to the pre-defined values. The result of kernel density estimation shows that landscape values were distributed unequally over the mangrove forest. Values for social activities and fishing were clustered at the entrance of the forest, especially around the Karamjol eco-park, in the Pashur river, and in the forest area adjacent to the Bay of Bengal. Non-material values such as cultural heritage, learning and inspiration were scarcely distributed out of the core zone of the mangrove forest. Religious values were widely distributed in the Dublar Chor close to the Bay of Bengal. Extraction of firewood and building material, medicinal plants, and honey production values were widely spread out inside the mangrove forest. Recreational values were mostly distributed around the respondent’s home location. The most clustered landscape values in the study area were identified within the mangrove forest.
Figure 2. Spatial distribution of material and non-material landscape values. Intensity decreases from red to yellow to green. The Sundarbans Reserve Forest (SRF), and the study area extent means the Sundarbans mangrove forest core zone including 10 km buffer zone.
Relationship between socio-demographic characteristics and mapped landscape values
More points were mapped by those respondents working in fishing and crab collection than in any other profession. No significant differences were found among most of the socio-demographic characteristics. However, we found that the number of total mapped values were significantly different by respondent’s profession () and gender. The results of Wilcoxon rank sum test show that male respondents identified significantly more landscape values than female respondents (where the average number of mapped points per female was 3.6, and average number of mapped points per male was 6.8). However, the effect size was medium (w = 5268, r = −0.515, p = 0.001).
The role of perceived bio-physical features and mangroves in local people’s sense of place
A total of 436 responses were collected under 10 aspects of sense of place. Dependence on forests for livelihood activities (‘In my childhood, I collected wood from the Sundarbans’) was the most frequently mentioned contribution to local people’s sense of place (). Year-round continued support against natural disaster such as storm surges and cyclones (‘During storm, Sundarbans reduces the speed of wind dramatically’), was also frequently named. The third most frequently perceived of aspect sense of place was identity (‘Sundarbans is our [source of] pride, people know us because of the Sundarbans’). Additionally, we find that local people perceived five types of bio-physical features (forest land, rivers, shrimp ponds, agricultural land, and canals) that contribute to their sense of place. Local people perceived forest land (42.3%) as the most prominent bio-physical feature in the Sundarbans, followed by rivers (29.6%), shrimp ponds (27.2%), agricultural land (11.5%), and canals (6.9%).
Perceived threats to livelihoods and sense of place
The most frequently specified threat in the study area was drinking water scarcity (25.9%), followed by encroachment of salt water (19.6%), and lack of transportation and communication (10.2%) (). Less frequently mentioned threats were river damming (0.2%), overharvesting of resources (0.2%), lack of education (0.7%), inequity (1.2%), and fishing with poison (1.2%).
Table 3. Perceived threats to livelihood and sense of place.
Discussion
Spatial distribution of landscape values
This study identified the landscape values based on spatial perceptions of local people, and the various meanings of place based on the ‘sense of place’ approach. The results of our study show that landscape values were not equally distributed () across the study area. This may be due to the location of our survey villages in the Northeastern part of the mangrove forest. Many of the mapped points were distributed in areas around these villages as the people from this area are engaged in forest-related activities inside the forest and close to their home location. Fishing/crab collection locations were distributed in the Pashur river (at the entrance of the forest and down to the Bay of Bengal). Forest dependent people from this region enter into the deeper part of the forest and sometimes they travel beyond the forest down to the Bay of Bengal, through the Pashur river. However, the nearby Shila river was also mentioned as an important source of fishing and crab collection. Therefore, mapped fishing locations were distributed in the Shila river, too. Down to the forest, in the Bay of Bengal, and the entrance of the Pashur river were hot spots for fishing and crab collection. Respondents who have fishing pass and Boat License Certificate (BLC), catch fish inside the forest and in the area adjacent to the Bay of Bengal. On the other hand, those having no BLC, catch fish around their home.
Overall, it appears that spiritual values and activities like fishing and honey collection inspire people to move throughout the mangrove forest more than other landscape values such as recreation. Thus, only certain people come into contact with the more pristine parts of the mangrove forest, such as honey collectors, who travel to deeper parts of the forest where tree density and height are generally greater (). Thus, conservation policies aimed at protecting these parts of the forest may affect these inhabitants more directly.
We found the Sundarbans mangrove forest to be a source of social activities where people meet friends and family during the Eid festival, Durga Puja (one of the biggest Hindu religious festivals), and Christmas day. The mangrove forest thus provides cultural values, as highlighted by James et al. (Citation2013) for the Niger Delta, the largest delta in Africa. In the month of November, people of Hindu religion travel to the Dublar Chor (an island, part of the Sundarbans forest attached to the Bay of Bengal) and celebrate the ‘Rash Mela’ festival (Islam et al. Citation2017). It is not only an important sacred place for the devoted Hindu people but also a yearly meeting place for people from other religions from the study area and beyond. Spiritual/religious values provided by the Sundarbans mangrove forest seem to bring all people together and build strong people-nature relationships. Similar types of spiritual and traditional beliefs are expressed by local people through wearing traditional dresses before entering the forest (James et al. Citation2013). These spiritual benefits are not only prevalent in Bangladeshi Sundarbans but have also seen in the Indian part of the Sundarbans. For example, Dasgupta et al. (Citation2021) described a place where local people get together and take holy baths in the Southeastern part of the Indian Sundarbans. A similar way of building a people-nature relationship has also been described for the tribal and non-tribal residents of the Puget Sound Shoreline in the USA (Poe et al. Citation2016).
Cultural heritage and recreational places were mostly located surrounding the resident’s home. Similarly, Cusens et al. (Citation2021) found the highest intensity of cultural values, recreational values to be located close to the respondent’s homes. While this study, which was carried out in a Norwegian Biosphere Reserve, identified more recreational values Cusens et al. (Citation2021), our study revealed more provisioning values, which could be due to the economic differences between these regions. We observed female respondents often perceived recreational values around and very close to their home mostly on the roadside, and on the shore of the shrimp pond. This may be a consequence of women’s day-to-day activities being closer to their homes as they are homemakers by profession (28.2%) and may be less involved in resource harvesting from the mangrove forest compared to men. Similar findings were described by Jones et al. (Citation2020) within Riverside Park in Southampton, UK. This difference in landscape valuation suggests that conservation and landscape management may impact local men and women differently, and their differing priorities should be considered for socially robust policies.
Sense of place, landscape features, and conservation
Sense of place is an important attribute to integrate into landscape conservation, because place meanings can act as a mediator between physical landscape and people’s attachment to it (Gottwald et al. Citation2022). In some social-ecological contexts, people are more likely to practice pro-environmental behavior or accept conservation policies when they have strong place attachment (Hausmann et al. Citation2016; Mook et al. Citation2022). This could include, for example, accepting the expansion of protected area networks. Mapping people’s sense of place in particular can help identify places of value that may have been overlooked (Hausmann et al. Citation2016). By locating places of meaning in the Bangladeshi Sundarbans, we identify areas where social and natural capital are combined, which can contribute to a bottom-up conservation approach whereby conservation policies can be rooted in local people’s perspectives.
Our study found that livelihood provision, protection against cyclones, and identity were the most frequently perceived aspects of sense of place among Sundarbans residents. Resident’s sense of place may be strongly based on their livelihood-oriented activities, as found elsewhere among forest-dependent people (Roy Citation2016). Sense of place is not only a provider of the recreational or cultural meaning of place dependence, but of economic well-being too (Cross et al. Citation2011). Interestingly, we found that a strong sense of protection against disaster by the Sundarbans ecosystem also contributed to local people’s place attachment. Thus, the Sundarbans are recognised not only to provide livelihoods but also to protect lives. This appeared to afford comfort and security to residents, which may be an overlooked aspect of place attachment, and one that could become even more important with regards to future climate change (Munang et al. Citation2013). This finding also illustrates that the components of sense of place overlap, and that aspects of physical place dependence can also strongly feature in a sense of place identity.
We found that the mangrove forest itself was the most frequently cited biophysical feature that contributes to the local people’s sense of place, although other features are becoming more characteristic of the region, such as human-made shrimp ponds. Place dependence was also mostly associated with the mangrove forest core zone. The resident’s close proximity to the forest may foster this awareness, as the strongest place attachment occurs at close proximity (Gottwald et al. Citation2022).
Sense of place and livelihood at risk
Most of our respondents reported that their livelihood to be in trouble because of the scarcity of fresh drinking water. The second major threat declared was an encroachment of saltwater. Many locals stressed that they would be able to cope with other threats, but that the scarcity of drinking water was making their life and living very complicated. If they wished to buy bottled water from the market, it increases plastic pollution in the surrounding environment and costs a large portion of their monthly income. Thus, financial insolvency was additionally perceived as a threat that limited them within the mangrove forest-related activities. This resembles the findings of Roy (Citation2016) who mentioned that low economic status pushes the local people to the forest. Accordingly, the mangrove forest loses its salient feature in contributing to people’s sense of place. According to Roy (Citation2016), the average income of the Sundarbans forest-dependent people is lower than the average income level of Bangladesh. A notable threat reported was a virus affecting shrimps, which threatened shrimp farming profitability and strongly affected those farmers who had recently converted their land into shrimp ponds. Another very serious threat perceived by our respondents was skin rash, due to saltwater bathing. Many of the threats identified in this study are similar to those described by Inskip et al. (Citation2013) where they found some problem categories to the livelihoods of local people such as saline water, access to education, and poor roads and transport.
Limitations, strengths, and lessons of the PPGIS survey approach
PPGIS has been widely applied in conservation science to identify spatially explicit landscape value. We found this method to have some limitations. First, it is a technical approach that can be difficult for some respondents to understand, particularly if they have no formal schooling, as did 37.2% of the respondents in our study. Second, when employed in the field as opposed to online, the method can be time-consuming, which is a challenge for the logistics of fieldwork. However, the method also has many strengths. For example, it is more engaging for participants than a traditional questionnaire, as it is visual and connects people directly to their surrounding environment. Also, the spatial data can be analysed and presented in ways that are more intuitive to grasp than other types of data, a useful aspect for policymakers and dissemination. Additionally, the capacity to build in open questions into the PPGIS survey allows for a rich qualitative dataset that can provide more insight than merely spatial or closed question data alone. Our study advances the spatial understanding of how local people in Bangladesh value the Sundarbans; however, an improvement in the social dimension of this approach could be achieved by closer co-operation with local peoples in developing spatial studies, in order to better harness local knowledge and target issues of local importance (Fagerholm et al. Citation2022).
Conclusion
The participatory mapping approach developed in this study highlights the understanding of how local people perceive and use multiple values of their surrounding landscapes. It further assesses people’s involvement with the Sundarbans mangrove forest, and some natural and anthropogenic pressures on their sense of place. Local perceptions collected in this way can accelerate the understanding of forest landscapes that may build a continuous and sustainable connection between local people and forest administrators. Overall, people’s attitudes, behavior, and the nature of this particular mangrove delta provide evidence of a strong bond between local people and the environment. Fostering these bonds may improve the sustainability of natural resource use also in other contexts. Until now, the Sundarbans have mainly been acknowledged for their provisioning services. In this study, we showed that the Sundarbans is also important for local people’s sense of place. We argue that fostering a sense of place through increasing public participation in decision-making and climate change adaptation processes can be a solution to improve future delta conservation approaches. As a unique example from Southeast Asia, this landscape brings multifunctional uses of mangrove and delta landscapes in focus. Here, we synthesized some insights on the social perception of this ecologically crucial mangrove delta, which may be useful for management and policy of similar types of landscapes at a national level and beyond:
While previous literature has highlighted the importance of the mangrove forests for livelihoods, our research suggests that they are of paramount importance for supporting social activities and for other non-material values (e.g. aesthetics and spiritual values). Conservation planning and management should consider to not only foster local people livelihoods but also to continue established social and cultural practices.
Respondents who are active in fisheries and crab collection seem to have a strong attachment with the landscape. Their knowledge of human-nature interactions should be studied more deeply through not only increasing conservation studies but also involving them in the decision-making.
Educational campaigns may focus on fostering awareness of the landscape values of the Sundarbans of less informed parts of local communities. Here, our PPGIS study uncovered many unknown features of the mangrove forest to the local people which may increase the awareness of local people to conservation of mangroves. Additionally, many threats are strongly associated with climate change, e.g. water scarcity and salinization. Policy makers should focus more on climate change adaptation strategy linked with local ecological knowledge. We recommend that forest administration may also support local people to increase their adaptive capacity through local knowledge-based adaptation strategies, e.g. rainwater harvesting, use of medicinal plants, and homestead gardening.
Local people’s sense of place is shaped through dimensions of place identity, place attachment, and place dependence. Disaster protection provided by the mangrove forest is a key aspect for local people’s sense of security and attachment to the Sundarbans. Conservation policy making should emphasize this aspect to enhance the uptake of measures.
Perceived threats to sense of place predominantly relate to tangible pressures that put livelihoods at risk. Most notably, water degradation (affecting both drinking water and farmlands through salinization) is a key issue that needs to be addressed. Additionally, sometimes they need to buy drinking water from the market. To meet these excess needs, which are not fulfilled by their regular income, they tend to harvest more resources from the mangrove forest, that can put additional pressure on the mangrove ecological integrity. Policy makers should focus more on water crisis in this area. The government should consider providing subsidies for drinking water or supply sufficient water tanks to store rainwater, to ease the direct pressure on local people’s livelihoods and indirect pressure on forest resources.
The local people involved in our study are enriched with much local-ecological knowledge, but their knowledge is not documented or integrated in the decision-making. We recommend that respective authorities should ensure local’s participation in decision-making and integrating local ecological knowledge in the future management practice that may ensure sustainable conservation of this exceptional biodiversity hotpot.
Consent to participate
All respondents gave their consent to participate in the study by completing a consent form that informed the respondent of their right to withdraw from the study at any time, that their data would be treated confidentially and they would be pseudonymised, their right to request their data, and the potential uses of the data and data privacy regulations.
Consent for publication
The authors confirm that the respondents provided informed consent for publication of data acquired from their participation.
Ethics approval
Prior to beginning the study, we conducted an ethics self-assessment from the University of Kassel and were recommended to take an ethically sensitive approach with adherence to scientific standards, but not required to obtain clearance from the university’s ethics committee.
Supplemental Material
Download PDF (701.6 KB)Acknowledgements
We would like to thank all the respondents who participated in our PPGIS study and colleagues who internally reviewed our manuscript. Additionally, we would like to thank the University of Kassel for supporting this research to be open access.
Disclosure statement
No potential conflict of interest was reported by the author(s).
Supplementary material
Supplemental data for this article can be accessed online at https://doi.org/10.1080/26395916.2024.2370531
Additional information
Funding
References
- Alessa L (Naia), Kliskey A, Brown G. 2008. Social-ecological hotspots mapping: a spatial approach for identifying coupled social-ecological space. Landsc Urban Plan. 85(1):27–13. doi: 10.1016/j.landurbplan.2007.09.007.
- Ayeb-Karlsson S, van der Geest K, Ahmed I, Huq S, Warner K. 2016. A people‐centred perspective on climate change, environmental stress, and livelihood resilience in Bangladesh. Sustainability Sci. 11(4):679–694. doi: 10.1007/s11625-016-0379-z.
- Banerjee S, Ladd CJT, Chanda A, Shil S, Ghosh T, Large A, Balke T. 2023. Securing the sustainable future of tropical deltas through mangrove restoration: lessons from the Indian Sundarban. One Earth. 6(3):190–194. doi: 10.1016/J.ONEEAR.2023.02.015.
- Baumeister CF, Gerstenberg T, Plieninger T, Schraml U. 2020. Exploring cultural ecosystem service hotspots: linking multiple urban forest features with public participation mapping data. Urban For Urban Greening. 48(March 2019):126561. doi: 10.1016/j.ufug.2019.126561.
- Baumeister CF, Gerstenberg T, Plieninger T, Schraml U. 2022. Geography of disservices in urban forests: Public participation mapping for closing the loop. Ecosyst People. 18(1):44–63. doi: 10.1080/26395916.2021.2021289.
- Brown G, Montag JM, Lyon K. 2012. Public participation GIS: a method for identifying ecosystem services. Soc Natur Resour. 25(7):633–651. doi: 10.1080/08941920.2011.621511.
- Brown G, Raymond CM, Corcoran J. 2015. Mapping and measuring place attachment. Appl Geogr. 57:42–53. doi: 10.1016/J.APGEOG.2014.12.011.
- Brown G, Reed P. 2000. Validation of a forest values typology for use in national forest planning. For Sci. 46(2):240–247. doi: 10.1093/forestscience/46.2.240.
- Brown G, Reed P. 2009. Public participation GIS: a new method for use in national forest planning. For Sci. 55(2):166–182. doi: 10.1093/forestscience/55.2.166.
- Brown G, Reed P, Raymond CM. 2020. Mapping place values: 10 lessons from two decades of public participation GIS empirical research. Appl Geogr. 116:102156. doi: 10.1016/J.APGEOG.2020.102156.
- Brown G, Weber D. 2011. Public participation GIS: a new method for national park planning. Landsc Urban Plan. 102(1):1–15. doi: 10.1016/j.landurbplan.2011.03.003.
- Brown G, Weber D, De Bie K. 2014. Assessing the value of public lands using public participation GIS (PPGIS) and social landscape metrics. Appl Geogr. 53:77–89. doi: 10.1016/j.apgeog.2014.06.006.
- CEGIS. 2016. Joint landscape narrative by India and Bangladesh. Center for Environmental and Geographic Information Services (CEGIS), unpublished report.
- Chowdhury MS, Hafsa B. 2022. Multi-decadal land cover change analysis over Sundarbans mangrove forest of Bangladesh: a GIS and remote sensing based approach. Global Ecol Conserv. 37:e02151. doi: 10.1016/J.GECCO.2022.E02151.
- Collins L, Kelly A, Tait C, Zhang S, Li Y, Bondre N, editors. 2023. Keeping pace with changing deltas. In: One earth. Vol. 6. p. 183–184. doi: 10.1016/j.oneear.2023.03.002.
- Cross JE, Keske CM, Lacy MG, Hoag DLK, Bastian CT. 2011. Adoption of conservation easements among agricultural landowners in Colorado and Wyoming: The role of economic dependence and sense of place. Landsc Urban Plan. 101(1):75–83. doi: 10.1016/J.LANDURBPLAN.2011.01.005.
- Cusens J, Barraclough AMD, Måren IE. 2021. Participatory mapping reveals biocultural and nature values in the shared landscape of a Nordic UNESCO biosphere reserve. People Nat. 4:365–381. doi: 10.1002/pan3.10287.
- Dasgupta R, Hashimoto S, Basu M, Okuro T, Johnson BA, Kumar P, Dhyani S. 2021. Spatial characterization of non-material values across multiple coastal production landscapes in the Indian Sundarban delta. Sustain Sci. 17:725–738. doi: 10.1007/s11625-020-00899-3.
- Dasgupta S, Wheeler D, Sobhan MI, Bandyopadhyay S, Paul T. 2020. Coping with Climate Change in the Sundarbans: Lessons from Multidisciplinary Studies. In: International Development in Focus. Washington, DC: World Bank Publications. doi:10.1596/978-1-4648-1587-4.
- Díaz S, Pascual U, Stenseke M, Martín-López B, Watson RT, Molnár Z, Hill R, Chan KMA, Baste IA, Brauman KA, et al. 2018. Supplementary material for assessing nature’s contributions to people. Science. 359(6373):270–272. doi: 10.1126/science.aap8826.
- Edmonds DA, Caldwell RL, Brondizio ES, Siani SMO. 2020. Coastal flooding will disproportionately impact people on river deltas. Nat Commun. 11(1):1–8. doi: 10.1038/s41467-020-18531-4.
- Fagerholm N, García-Martín M, Torralba M, Bieling C, Plieninger T. 2022. Public participation geographical information systems (PPGIS): participatory research methods for sustainability‐toolkit# 1. GAIA-Ecol Perspect Sci Soc. 31(1):46–48. doi: 10.14512/gaia.31.1.10.
- Garcia-Martin M, Fagerholm N, Bieling C, Gounaridis D, Kizos T, Printsmann A, Müller M, Lieskovský J, Plieninger T. 2017. Participatory mapping of landscape values in a Pan-European perspective. Landscape Ecol. 32(11):2133–2150. doi: 10.1007/s10980-017-0531-x.
- Ghosh T, Loc HH, Park E, Mortreux C, Okoh R, Nesterenko M, Dubey SK, Gain AK, Le DP, Giosan L, et al. 2023. Adaptation for changing deltas. One Earth. 6(3):185–189. doi: 10.1016/j.oneear.2023.02.014.
- GoB. 2010. Integrated resources management plans for the Sundarbans: volume 1. Dhaka, Bangladesh: Forest Department, Ministry of Environment, Forest and Climate Change, Government of the people’s republic of Bangladesh.
- Gottwald S, Albert C, Fagerholm N. 2022. Combining sense of place theory with the ecosystem services concept: empirical insights and reflections from a participatory mapping study. Landscape Ecol. 37(2):633–655. doi: 10.1007/s10980-021-01362-z.
- Hagger V, Worthington TA, Lovelock CE, Adame MF, Amano T, Brown BM, Friess DA, Landis E, Mumby PJ, Morrison TH, et al. 2022. Drivers of global mangrove loss and gain in social-ecological systems. Nat Commun. 13(1):6373. doi: 10.1038/s41467-022-33962-x.
- Hausmann A, Slotow ROB, Burns JK, Di Minin E. 2016. The ecosystem service of sense of place: benefits for human well-being and biodiversity conservation. Environ Conserv. 43(2):117–127. doi: 10.1017/S0376892915000314.
- Hawthorne TL, Toohy KR, Yang B, Graham L, Lorenzo EM, Torres H, McDonald M, Rivera F, Bouck K, Walters LJ. 2022. Mapping emotional attachment as a measure of sense of place to identify coastal restoration priority areas. Appl Geogr. 138:102608. doi: 10.1016/J.APGEOG.2021.102608.
- Hewitt RJ, Pera FA, García-Martín M, Gaudry-Sada KH, Hernández-Jiménez V, Bieling C. 2020. Mapping adolescents’ sense of place and perceptions of change in an urban–rural transition area. Environ Manage. 65(3):334–354. doi: 10.1007/s00267-019-01249-5.
- Hossain ANM, Lynam AJ, Ngoprasert D, Barlow A, Barlow CG, Savini T. 2018. Identifying landscape factors affecting tiger decline in the Bangladesh Sundarbans. Global Ecol Conserv. 13:e00382. doi: 10.1016/J.GECCO.2018.E00382.
- Inskip C, Ridout M, Fahad Z, Tully R, Barlow A, Barlow CG, Islam MA, Roberts T, MacMillan D. 2013. Human-tiger conflict in context: risks to lives and livelihoods in the Bangladesh Sundarbans. Hum Ecol. 41(2):169–186. doi: 10.1007/s10745-012-9556-6.
- Iqbal MH, Hossain ME. 2022. Tourists’ willingness to pay for restoration of Sundarbans mangrove forest ecosystems: a contingent valuation modelling study. Environ Dev Sus. 0123456789. doi: 10.1007/s10668-022-02140-w.
- Islam MM, Hossain MM. 2017. Community dependency on the ecosystem services from the Sundarbans mangrove wetland in Bangladesh. In: Prusty BAK, editor. Wetland Science: Perspectives from South Asia. New Delhi, India: Springer; p. 301–316. doi: 10.1007/978-81-322-3715-0_16.
- Islam MM, Sunny AR, Hossain MM, Friess DA. 2018. Drivers of mangrove ecosystem service change in the Sundarbans of Bangladesh. Singap J Trop Geogr. 39(2):244–265. doi: 10.1111/sjtg.12241.
- James GK, Adegoke JO, Osagie S, Ekechukwu S, Nwilo P, Akinyede J. 2013. Social valuation of mangroves in the Niger Delta region of Nigeria. Int J Of Biodiversity Science, Ecosystem Services And Management. 9(4):311–323. doi: 10.1080/21513732.2013.842611.
- Jones L, Holland RA, Ball J, Sykes T, Taylor G, Ingwall-King L, Snaddon JL, Peh KS-H. 2020. A place-based participatory mapping approach for assessing cultural ecosystem services in urban green space. People Nat. 2(1):123–137. doi: 10.1002/pan3.10057.
- Jorgensen BS, Stedman RC. 2006. A comparative analysis of predictors of sense of place dimensions: attachment to, dependence on, and identification with lakeshore properties. Journal Of Environmental Management. 79(3):316–327. doi: 10.1016/J.JENVMAN.2005.08.003.
- Kadykalo AN, López-Rodriguez MD, Ainscough J, Droste N, Ryu H, Ávila-Flores G, Le Clec’h S, Muñoz MC, Nilsson L, Rana S, et al. 2019. Disentangling ‘ecosystem services’ and ‘nature’s contributions to people’. Ecosyst People. 15(1):269–287. doi: 10.1080/26395916.2019.1669713.
- Khan MNI, Khatun S, Azad MS, Mollick AS. 2020. Leaf morphological and anatomical plasticity in Sundri (Heritiera fomes Buch. -Ham.) along different canopy light and salinity zones in the Sundarbans mangrove forest, Bangladesh. Global Ecol Conserv. 23:e01127. doi: 10.1016/J.GECCO.2020.E01127.
- Mallick B, Priodarshini R, Kimengsi JN, Biswas B, Hausmann AE, Islam S, Huq S, Vogt J. 2021. Livelihoods dependence on mangrove ecosystems: empirical evidence from the Sundarbans. Curr Res Environ Sustain. 3:100077. doi: 10.1016/J.CRSUST.2021.100077.
- Masterson VA, Stedman RC, Enqvist J, Tengö M, Giusti M, Wahl D, Svedin U. 2017. The contribution of sense of place to social-ecological systems research: a review and research agenda. Ecol Soc. 22(1). doi: 10.5751/ES-08872-220149.
- Mitra A, Sengupta K, Banerjee K. 2012. Spatial and temporal trends in biomass and carbon sequestration potential of Sonneratia Apetala Buch. -Ham in Indian Sundarbans. Proc Natl Acad Sci, India, Sect B Biol Sci. 82(2):317–323. doi: 10.1007/s40011-012-0021-5.
- MoEFC. 2022. Ministry of environment, forest and climate change. Government of Bangladesh. The Sundarbans (Bangladesh). (N 798). progress report on the decisions of 44 COM 7B.91 the world heritage committee on the Sundarbans world heritage site.
- Mook A, Goyke N, Dwivedi P. 2022. Conservation intentions and place attachment among male and female forest landowners*. Rural Sociol. 87(3):817–846. doi: 10.1111/ruso.12434.
- Mullendore ND, Ulrich-Schad JD, Prokopy LS. 2015. U.S. farmers’ sense of place and its relation to conservation behavior. Landsc Urban Plan. 140:67–75. doi: 10.1016/J.LANDURBPLAN.2015.04.005.
- Munang R, Thiaw I, Alverson K, Liu J, Han Z. 2013. The role of ecosystem services in climate change adaptation and disaster risk reduction. Curr Opin Environ Sustain. 5(1):47–52. doi: 10.1016/j.cosust.2013.02.002.
- Nasrin S, Mahmood H, Rahman MM. 2021. Parental influences on salt adaptive divergence of Sonneratia apetala (Buch. -Ham.) seedlings along the salinity gradient in the Sundarbans of Bangladesh. Environ Challenges. 4:100121. doi: 10.1016/J.ENVC.2021.100121.
- Pérez-Ramírez I, García-Llorente M, Benito A, Castro AJ. 2019. Exploring sense of place across cultivated lands through public participatory mapping. Landscape Ecol. 34(7):1675–1692. doi: 10.1007/s10980-019-00816-9.
- Plieninger T, Dijks S, Oteros-Rozas E, Bieling C. 2013. Assessing, mapping, and quantifying cultural ecosystem services at community level. Land Use Policy. 33(July):118–129. doi: 10.1016/j.landusepol.2012.12.013.
- Plieninger T, Rana HÁA, Fagerholm N, Ellingsgaard GF, Magnussen E, Raymond CM, Olafsson AS, Verbrugge LNH. 2018. Identifying and assessing the potential for conflict between landscape values and development preferences on the Faroe Islands. Global Environ Change. 52(May):162–180. doi: 10.1016/j.gloenvcha.2018.07.006.
- Poe MR, Donatuto J, Satterfield T. 2016. “Sense of place”: human wellbeing considerations for ecological restoration in Puget sound. Coastal Manage. 44(5):409–426. doi: 10.1080/08920753.2016.1208037.
- Prusty BAK, Chandra R, Azeez PA. 2017 Apr. Perspectives from South Asia. In: Wetland Science. 1–587. 10.1007/978-81-322-3715-0.
- Rädiker S, Kuckartz U. 2020. Focused analysis of qualitative interviews with MAXQDA: step by step. Berlin: MAXQDA Press. 10.36192/978-3-948768072.
- Roy AKD. 2016. Local community attitudes towards mangrove forest conservation: lessons from Bangladesh. Mar Policy. 74(September):186–194. doi: 10.1016/j.marpol.2016.09.021.
- Roy AKD, Alam K, Gow J. 2013. Community perceptions of state forest ownership and management: a case study of the Sundarbans mangrove forest in Bangladesh. Journal Of Environmental Management. 117:141–149. doi: 10.1016/J.JENVMAN.2012.12.004.
- Saito O, Subramanian SM, Hashimoto S, Takeuchi K. 2020. Managing socio-ecological production landscapes and seascapes for sustainable communities in Asia: mapping and navigating stakeholders, policy and action 179. Springer Nature. 10.1007/978-981-15-1133-2.
- Sannigrahi S, Zhang Q, Pilla F, Joshi PK, Basu B, Keesstra S, Roy PS, Wang Y, Sutton PC, Chakraborti S, et al. 2020. Responses of ecosystem services to natural and anthropogenic forcings: a spatial regression based assessment in the world’s largest mangrove ecosystem. Sci Total Environ. 715:137004. doi: 10.1016/j.scitotenv.2020.137004.
- Sarker SK, Reeve R, Thompson J, Paul NK, Matthiopoulos J. 2016. Are we failing to protect threatened mangroves in the Sundarbans world heritage ecosystem? Sci Rep. 6(October 2015):1–12. doi: 10.1038/srep21234.
- Sherrouse BC, Clement JM, Semmens DJ. 2011. A GIS application for assessing, mapping, and quantifying the social values of ecosystem services. Appl Geogr. 31(2):748–760. doi: 10.1016/j.apgeog.2010.08.002.
- Shoyama K, Yamagata Y. 2016. Local perception of ecosystem service bundles in the Kushiro watershed, Northern Japan – application of a public participation GIS tool. Ecosyst Serv. 22(July):139–149. doi: 10.1016/j.ecoser.2016.10.009.
- Solecka I, Rinne T, Caracciolo Martins R, Kytta M, Albert C. 2022. Important places in landscape – investigating the determinants of perceived landscape value in the suburban area of Wrocław, Poland. Landsc Urban Plan. 218:104289. doi: 10.1016/J.LANDURBPLAN.2021.104289.
- Sunny AR. 2017. Impact of oil spill in the Bangladesh Sundarbans. Int J Fish Aquat Stud. 5(5):365–368.
- Swanwick C. 2009. Society’s attitudes to and preferences for land and landscape. Land Use Policy. 26:S62–S75. doi: 10.1016/j.landusepol.2009.08.025.
- Tapsuwan S, Leviston Z, Tucker D. 2011. Community values and attitudes towards land use on the Gnangara groundwater system: a sense of place study in Perth, Western Australia. Landsc Urban Plan. 100(1–2):24–34. doi: 10.1016/J.LANDURBPLAN.2010.09.006.
- VERBI Software. 2022. MAXQDA, software for qualitative data analysis, 1989 – 2024. Berlin, Germany: VERBI Software. Consult. Sozialforschung GmbH.
- Wartmann FM, Purves RS. 2018. Investigating sense of place as a cultural ecosystem service in different landscapes through the lens of language. Landsc Urban Plan. 175(March):169–183. doi: 10.1016/j.landurbplan.2018.03.021.
- Williams DR. 2014. Making sense of ‘place’: reflections on pluralism and positionality in place research. Landsc Urban Plan. 131:74–82. doi: 10.1016/J.LANDURBPLAN.2014.08.002.
- Yang YE, Passarelli S, Lovell RJ, Ringler C. 2018. Gendered perspectives of ecosystem services: a systematic review. Ecosyst Serv. 31:58–67. doi: 10.1016/j.ecoser.2018.03.015.