
ABSTRACT
Human well-being is critically linked to the condition of marine ecosystems. Intangible services, benefits, and values derived from ecosystems play a vital role in human well-being and promote conservation efforts that ultimately support ecosystem sustainability. Similar to many regions, communities along the west coast of Hawai‘i Island are intertwined with their diverse and productive ecosystem. Though multiple resource management programs focus on operationalizing ecosystem-based management in this region, they lack adequate inclusion of connections between people and their environment. To address this, we used the Cultural Ecosystem Services (CES) framework to investigate intangible connections and opportunities to include them in resource management. Through unstructured interviews with community members on Hawai‘i Island, we explored relationships between CES and human well-being. We found that certain CES seem to be strongly related and/or connected to a large number of other CES. We also describe emergent interview themes, which include the ecosystem’s influence on well-being, types of access to CES, and the values that people ascribe to their ecosystem-derived connections. Importantly, these themes represent necessary modifications to ecosystem assessment frameworks. Additionally, we suggest stepping away from discussing CES as if they exist in segregated categories that contribute to individual facets of human well-being. Taken collectively, our findings support deepening the scope of ecosystem assessments and improving sociocultural indicators for the benefit of marine ecosystems and human well-being alike.
EDITED BY:
Introduction
Human well-being encompasses the psychological, physical, spiritual, social, and economic aspects of an individual’s life and is a concept fundamentally intertwined with ecosystem sustainability (i.e. the ability for an ecosystem to sustain natural functions, processes, and productivity) (Leemans and de Groot Citation2003; Breslow et al. Citation2016; Hicks et al. Citation2016). Ecosystems contribute substantially to human well-being in material and non-material ways, forging connections between humans and their environment (Chan et al. Citation2012; Amberson et al. Citation2016). These connections influence perceptions and behaviors that can enhance both ecosystem sustainability and human well-being by encouraging conservation, fostering resilience, and promoting support for sustainable policies (Millennium Ecosystem Assessment Citation2005; Folke et al. Citation2016; Rodrigues et al. Citation2017). Conservation and management efforts have yet to adequately account for this, undermining management and sustainability goals (Millennium Ecosystem Assessment Citation2005; Ash et al. Citation2012; Chan et al. Citation2012; Dillard et al. Citation2013; Hernández-Morcillo et al. Citation2013; Fish et al. Citation2016; Ives et al. Citation2018; Donkersloot et al. Citation2020).
Cultural Ecosystem Services (CES) are part of a framework developed by the Millennium Ecosystem Assessment (Citation2005), one of the most common frameworks used to examine ecosystem services. CES are distinctly different from the other provisioning, supporting, and regulating ecosystem services in the framework, which generally refer to tangible or quantifiable services and benefits (Millennium Ecosystem Assessment Citation2005). Instead, CES describe intangible services, benefits, and values that people derive through their relationships with ecosystems, such as spiritual values and sense of place, which all contribute to human well-being (Millennium Ecosystem Assessment Citation2005; Chan et al. Citation2011). Studies have shown a positive link between ecosystem services and human well-being (King et al. Citation2014), but exploration into how changing CES may result in corresponding changes to human well-being are largely unknown (Rodrigues et al. Citation2017; Willis et al. Citation2018). There is a growing understanding that the relationship between CES and human well-being is not a linear, 1–1 relationship (Huynh et al. Citation2022). Investigating how communities identify, appreciate, and interact with CES will help unravel the links between CES and human well-being, which is necessary to achieve marine environmental sustainability goals (Milcu et al. Citation2013; Pascua et al. Citation2017; Rodrigues et al. Citation2017; Kosanic and Petzold Citation2020) and support marine management under increased threats from human impacts and global climate change (Qiang and Silliman Citation2019).
The linkages between ecosystem services and human well-being are a critical component of ecosystem-based management (EBM), which is a management strategy rooted in social-ecological systems thinking for achieving sustainability (O’Higgins et al. Citation2020; Piet et al. Citation2020). EBM commonly relies on ecosystem assessments and indicators to evaluate the state of ecosystem conditions (Rice and Rochet Citation2005; Piet et al. Citation2020). Indicators typically focus on conventional and quantifiable metrics (e.g. biophysical and ecological data) rather than non-monetary social dynamics, such as human well-being and CES (Breslow et al. Citation2017; Dacks et al. Citation2019; Hornborg et al. Citation2019). While indicators of biological and ecological conditions are critical, it is a large leap to assume they wholly represent what society values and finds meaningful in a given ecosystem. Importantly, the selection of indicators inherently defines what is considered ‘relevant’ in a given region, thereby carrying a huge influence on what is managed (Hicks et al. Citation2016). The challenge lies in understanding how the marine environment is contributing to human well-being, learning the social meanings and values attributed to CES, and embedding this information within EBM strategies.
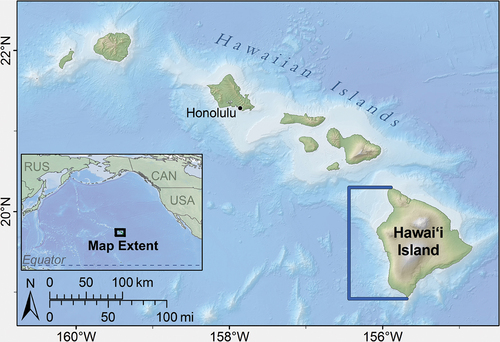
The west coast of Hawai‘i Island, an area commonly known as West Hawai‘i, is home to many communities defined by geography, ethnicity, identity, and interest who live within a diverse and productive ecosystem (). The region’s population includes Indigenous Kanaka Maoli (Native Hawaiians), locals with multi-generational ties or more recent settlers, and large populations of transient communities (e.g. tourists, short-term residents, traveling professionals). The diverse marine environment is a backbone in providing ecosystem services such as food, recreation, and cultural identity. Global and local stressors including climate change, rapid population increase, coastal development, pollutants, and fishing pressures compromise the condition of the marine environment and connected human well-being (Friedlander et al. Citation2008; Gove et al. Citation2019).
Figure 1. Map of the general location of West Hawai‘i within the hawaiian archipelago.
Multiple management regimes focused on operationalizing EBM exist in this region, including the National Oceanic and Atmospheric Administration’s Integrated Ecosystem Assessment (IEA). The IEA seeks to achieve local management goals by identifying and monitoring components of social-ecological systems. This research purposefully works to help fill the social indicator gap within the IEA and beyond by using research results to guide social indicator development. We conducted in-depth, unstructured interviews to investigate the relationship between CES and human well-being among community members in West Hawai‘i. Discussions about CES can reveal the importance of different aspects of relationships and interactions between people and their environment (Leemans and de Groot Citation2003). Our research objectives were 1) to investigate how the marine environment contributes to human well-being through CES specifically, and 2) determine how this information could be operationalized within management approaches. In our results, we describe patterns from the data and emergent interview themes which help illuminate the multifaceted nature of understanding and monitoring intangible elements of human well-being in resource management.
Methods
Research approach and data collection
We began by completing extensive preliminary research to frame our research scope (Ingram et al. Citation2018; Leong et al. Citation2019). Preliminary research included a detailed literature review, discussions with and input from field experts, and pilot interviews; all of which guided development of background materials used in this research, including human well-being domains and interview guides (see Leong et al. (Citation2019) for detailed review). We applied a qualitative, case study approach to address our research objectives and contribute to human well-being and CES literature rather than attempting to generalize our results to a population level (Yin Citation2009). We then conducted in-depth, unstructured interviews with community members who live along the west coast of Hawai‘i Island. Our previous work identified key considerations that guided our selection of interviewees, including cultural, community, research, and governance/management conditions (Leong et al. Citation2019). We chose 24 interviewees using purposive sampling of key informants involved in West Hawai‘i ocean-based conservation (Patton Citation1990; Palinkas et al. Citation2015). Additionally, we used snowball sampling methods which identified seven additional interviewees (Patton Citation1990).
Interviewees’ ages ranged from 25 to 86 years old. Out of 31 interviewees, 21 were born in Hawai‘i (nine born in West Hawai‘i specifically). All interviewees had lived in West Hawai‘i for at least 10 cumulative years. They were involved in marine conservation via one or more routes (e.g. one interviewee was a marine resource manager and a volunteer for another marine conservation organization). A total of 10 interviewees were currently in or retired from a state or federal resource management position, seven interviewees worked for non-governmental resource management organizations, and nine interviewees worked for a private sector company focused on ocean conservation. Interview materials included a consent form, interview guide, and our list of human well-being domains with attributes and prompts from previous work (prompts were only used if an interviewee had not already voluntarily discussed a CES or human well-being domain) (Leong et al. Citation2019). We had two interview guides designed with both direct and indirect questions; one guide was oriented towards community leaders and one was oriented towards individuals in paid resource management roles (Appendix A). No two interviews were identical or followed the guide exactly. The depth and scope of any given topic varied depending on the interviewee’s expertise and interests.
The lead author conducted 24 unstructured interviews with 31 interviewees between April 2018 and March 2019. Three were group interviews (group sizes: two, four, and five). Interviews lasted between 45 min and 2.5 h, took place in a mutually agreed upon location, and were audio-recorded. Detailed notes on interviews were written up within 48 h of interview completion. Audio recordings of interviews were transcribed, and interviewees received a copy to review and inform the interviewer of any corrections or redactions.
Data analysis and qualitative coding
Our analysis invoked a mixed inductive and deductive approach. We created an initial codebook prior to coding interviews using a deductive process (Saldaña Citation2021). This initial codebook consisted of a list of human well-being domains, CES, and other topics related to human well-being. We used multiple sources to create this codebook including key references (Millennium Ecosystem Assessment Citation2005; Millennium Ecosystem Assessment Board Citation2005; Smith and Clay Citation2010; Michalos et al. Citation2011; Dillard et al. Citation2013; Smith et al. Citation2013; Gould et al. Citation2014; Wongbusarakum et al. Citation2014; Biedenweg et al. Citation2016; Breslow et al. Citation2016; Pascua et al. Citation2017), preliminary research (Ingram et al. Citation2018; Leong et al. Citation2019), and collaboration with related research being conducted separately from this work but simultaneously with similar communities (Gould et al. Citation2022). Our codebook went through multiple iterations during this process.
After importing transcripts into NVivo qualitative data analysis software (version 12 Pro, QSR International, Inc.), we completed two phases of coding. The lead author conducted all coding, and reviewed progress with co-authors regularly (approximately biweekly) until finished. We deductively coded relevant segments of text from each interview that illustrated pre-identified codes in our codebook. During this process, new codes were inductively added to our codebook as new concepts arose (Saldaña Citation2021). This resulted in a final multi- level codebook with 222 codes (Appendix B). Level one codes were main categories/topics and may have had nested sub-codes, referred to as level two codes. Similarly, level two codes may have also had nested sub-codes. The final codebook had 30 level one codes, 47 level two codes, 100 level three codes, 44 level four codes, and one level five code. One important level one code included ‘well-being’, under which domains of human well-being were listed (Leong et al. Citation2019). ‘Well-being’ also included the sub-code ‘CES’, which comprised 14 CES and their 13 associated sub-codes. Concurrent with the first phase of coding all interviews, we compiled our final list of CES and associated definitions and examples to explore during analysis (). This list of CES did not include any novel CES that we had not previously read in literature (largely due to the exploration of West Hawai‘i CES in Pascua et al. (Citation2017)). Using the final codebook, we then completed a comprehensive coding phase. This involved reading through each interview to verify the accuracy of existing coded sections, discovering sections of text that were missing codes, or re-code sections based on the updated codebook.
Table 1. List of Cultural Ecosystem Services, associated definitions, and an interview quote that illustrate each Cultural Ecosystem Services. Definitions are summarized from key references (see methods section for details).
Our coding process allowed for any single segment of an interview transcript (e.g. several words, one sentence, or one answer) to have multiple codes assigned to it, an event known as a co-occurrence (Saldaña Citation2021). For example, when asked about a spiritual relationship to the ocean, one interviewee replied,
For me, personally, I feel spiritually connected to the ocean because it is what brings me joy. Looking at it is what calms me down. There’s a sense of purpose when I look at the ocean. There’s a sense of connection when I look at the ocean. Things make sense when I’m in the water. (28)
Despite the interview question targeting spirituality specifically, this segment wove multiple topics together and we gave it multiple codes, including mental and emotional health, aesthetics, sense of place, and identity. Identifying co-occurrences allowed us to perform a co-occurrence analysis in which we identified, counted, and examined how often codes appeared together in the data. We examined co-occurrences between each CES and each individual code (e.g. other CES, well-being domains, and all sub-codes).
Additionally, we conducted a thematic analysis by familiarizing ourselves with the data, reviewing existing codes, organizing our codes based on patterns, and condensing patterns into broader themes (Braun and Clarke Citation2006; Seidman Citation2006; Saldaña Citation2021). Through this iterative process, we discerned three predominant themes that emerged, all illustrating how the coastal and marine environment relates to intangible aspects of human well-being.
After completing our analysis, we presented our findings to available interviewees via virtual meetings to ensure that our interpretation captured all interviewee’s meaning and correctly portrayed their perspectives and beliefs, a process called member-checking (Glesne Citation2016). We also sent a detailed report describing our research and findings to interviewees (Ingram et al. Citation2020). In addition to ensuring accurate representation, this process helped to ensure that we, as researchers, did not reveal more information than interviewees intended to be made public (Seidman Citation2006; Glesne Citation2016). All interviewees were encouraged to communicate any feedback, including discrepancies; only positive feedback was received.
Results
Strong and diverse relationships among cultural ecosystem services
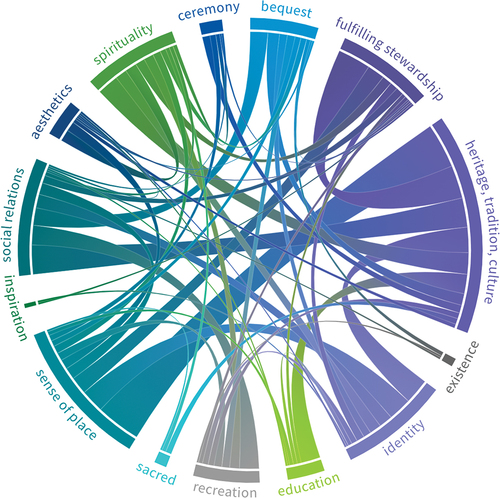
Our interview analysis resulted in 2668 individual coded segments. In alignment with our research objectives, we examined the coded segments that related to CES specifically. Our analysis revealed relationships among multiple concepts via code co-occurrences. We first examined co-occurrences between each individual CES and all other relevant codes (codes considered irrelevant for analysis included generic codes, such as ‘memorable quote’). We discovered 832 total co-occurrences, with a range of 1–23 co-occurrence pairs (Ingram et al. Citation2020; Appendix C). The CES with the highest number of co-occurrences with all other codes were Heritage, Tradition, Culture (236 co-occurrences, meaning we coded Heritage, Tradition, Culture with another code 236 times); Sense of Place (172); and Social Relations (121) (). A total of 70% (579 out of 832) of all co-occurrences in the dataset existed between a CES and non-CES code (e.g. Heritage, Tradition, Culture and Reciprocity co-occurred 8 times). However, all of these co-occurrences happened relatively fewer times than co-occurrences between a CES and another CES (e.g. Heritage, Tradition, Culture and Sense of Place co-occurred 23 times), leading us to examine these co-occurrence relationships explicitly.
Table 2. Results from our interview analysis included counting the number of times each Cultural Ecosystem Services was coded within the data. This table reports totals for each Cultural Ecosystem Services individually/alone, each Cultural Ecosystem Services when coded with any other code, and each Cultural Ecosystem Services when coded with another Cultural Ecosystem Services.
There were 253 co-occurrences between a CES and another CES. We calculated these connections in two different ways: diverse and strong connections. We calculated diverse connections by tallying the number of different CES that co-occurred with one specific CES (e.g. aesthetics co-occurred one or more times with eight other CES). We calculated strong connections by adding together the number of co-occurrences between two particular CES (e.g. aesthetics co-occurred with spirituality six times). illustrates the diversity of connections (represented by the number of individual lines) and strength of connections (represented by thickness of lines). The diversity of CES/CES connections ranged from 2 to 11. Four CES (Heritage, Tradition, Culture; Sense of Place; Social Relations; Fulfilling Stewardship) each had at least one co-occurrence with 11 different CES. The strength of connections ranged from 1 to 23. The strongest connections were between Heritage, Tradition, Culture and Sense of Place (23 co-occurrences); Heritage, Tradition, Culture and Fulfilling Stewardship (17); Heritage, Tradition, Culture and Social Relations (15); Heritage, Tradition, Culture and Identity (13); and finally, Sense of Place and Identity (12).
Figure 2. Co-occurrences between Cultural Ecosystem Services. Diversity of connections (represented by the number of individual lines) and strength of connections (represented by thickness of lines). Interactive version: https://public.flourish.studio/visualisation/10866413/.
During our member-checking process, interviewees discussed the concept of strong and diverse CES connections. They pointed out the usefulness of grouping certain CES to study them from a broader perspective, akin to viewing them through a wide-angle or ‘macro’ lens. This approach contrasts with examining each CES in isolation, which is more like looking through a narrow-focus or ‘micro’ lens. They also recognized the advantage of focusing on a CES that serves as a diverse link to other CES. This strategy was viewed as effectively highlighting the CES that might be unintentionally overlooked when each service is examined separately.
Emergent interview themes: three facets of contributions of CES to human well-being
Three dominant themes emerged from our thematic analysis: Ecological Influence, Dimensions of Coastal and Marine Access, and Values and Meanings. Ecological Influence is an expansion of what typical monitoring indicators (e.g. biological and ecological data) represent in ecosystem assessments and how ecological components impact human well-being. Dimensions of Coastal and Ocean Access refers to how people can both physically and/or mentally connect with a place. Values and Meanings illuminates the social values and meanings that people develop related to the coastal and marine environment. Our three emergent interview themes illustrate that there are multiple facets of CES (e.g. creating, obtaining, valuing) that together encompass contributions of CES to well-being; evaluating each facet individually cannot provide an accurate representation of the whole story.
Ecological influence
The Ecological Influence theme describes the impact of ecological components on human well-being. Data describing these components (e.g. fish abundance, coral cover, sea temperature) are typically included in marine ecosystem assessments. These data are necessary for monitoring the condition of an ecosystem; however, interviews provided insight into how these data reveal information not only about ecosystem condition but specifically to human well-being.
Both prompted and unprompted, interviewees gave examples of how ecological conditions influence their personal and community well-being. Interviewees discussed positive emotions that they derive from the coast or ocean, including stress relief, calmness, joy, excitement, and happiness. In contrast, multiple interviewees also brought up negative emotions, such as sadness, anger, and frustration. This was particularly true when discussing coral bleaching events (an unprompted topic). Words that interviewees used to describe coral decline included fear, sadness, anger, heartbreak, depression, and frustration. One interview describes, ‘I think on the emotional level, there has to be some kind of an impact that reflects what’s happening ecologically’ (19).
Other than influencing overall human well-being, this theme also describes how ecological conditions can influence specific CES. Here, we provide three examples from interviews. First, interviewees discussed that when fish populations are large enough to sustain local food supply, CES like Aesthetics, Identity, and Heritage, Tradition, Culture are also supported. We heard during interviews that, ‘culture and people’s identity is strongly tied to food,’ (17) as well as, ‘the way that those things of the sea contribute not only nutritionally, but aesthetically. And the flavor aspect to our lives. Our lives are just richer when we eat like that’ (10). In our second example, interviewees spoke of how water quality conditions support the existence of Recreation and Spirituality. This is highlighted in the following quote,
I used to be drawn to more ocean activities, like personally and spiritually. And now—I mean, yeah, I’ll go surfing, but I also just go to the pool because I don’t want to see [the changes]. Or, because there’s [too many] people or because I know there’s like brown water and there’s chemicals [in the ocean]. (24)
And finally, interviewees discussed how biodiversity supports Aesthetics and Recreation,
You know, just the color therapy when you go for a snorkel or even if you’re not snorkeling, you’re just sitting at the beach. Those changes in color and textures that you get to see, I think, are good for your head and your heart. (18)
Interviewees consistently described a correlation between the range of ecological conditions and the corresponding availability and/or quality of CES. This pattern underscores the integral link between the health of the ecosystems and the potential for realizing the full spectrum of benefits provided by CES.
Dimensions of coastal and ocean access
The Dimensions of Coastal and Ocean Access theme explores the multidimensional concept of access to the coastal and marine environment, which encapsulates physical, emotional, and experiential connections. Our analysis illuminated how people are creating connections not only by literal access, but also by building and maintaining connections that may or may not require physical proximity to generate the CES that contribute to their well-being. The dimensions of access in this theme were consumptive (e.g. catching fish to eat), non-consumptive (e.g. a family gathering at a beach), and felt at both individual and collective levels. Several interviewees discussed the importance of connections created through indirect access. For example, one interviewee said that their role as a fisher person included sharing catch with those who are unable to fish as a way to, ‘allow some of those people who can no longer fish, a connection. Can’t [fish], right? So, they still have that connection’ (29). These interviewees emphasized that the significance of sharing fish goes beyond sharing calories or nutrients.
This perspective of access underscores the interconnectivity among CES interviewees described. Most interviewees shared that Recreation and Fulfilling Stewardship were conduits for creating or maintaining a deeper connection with the coastal and marine environment. Interviewees frequently mentioned Recreation, but rarely as a standalone. For example, one interviewee said, ‘paddling … It’s recreational, it can be sporting, [NAMES] often invite me to pray on their canoe races before the race begins. So it’s a great medium for both physical and spiritual connection’ (10). Similarly, interviewees often discussed Fulfilling Stewardship as a means to create and maintain connections through stewardship actions. One interviewee said, ‘Engaging with this place and space, whether it’s in the ocean or the land, I think it’s a kuleanaFootnote1 in itself and [a] reconnecting’ (24). These CES are providing the conduit for people to create and maintain connections with their surroundings, leading to many associated values. A critical insight was that, as one interviewee described, ‘pure recreation’ with ‘no taking care’ (i.e. no stewardship mentality or motive) was destructive to both the environment and human well-being. Another interviewee explained that having a connection to place is a critical link to caring for place, and that, ‘a negative feedback loop [is] created if the ability for people to feel empowered and participate [in taking care of place] goes away’ (19).
Importantly, interviewees disagreed about whether physical access is a necessity in order to sustain a personal connection to the coast or ocean. While some explained that their well-being would be enhanced by memories, emotional attachment, or moʻoleloFootnote2 regardless of circumstance, some interviewees expressed that they need continued, physical access to experience a positive impact to their well-being. A few went on to explain that their access had been altered or severed due to environmental or social changes (e.g. development, land ownership changes); thus, they prefer their memories over any attempts to create a replacement connection.
This theme argues for an expanded understanding of how people access CES that redefines the traditionally narrow view to encompass the myriad ways that connections to/with CES exist, beyond physical and spatial boundaries.
Values and meanings
The Values and Meanings theme emerged from the diverse ways interviewees derive meaning from the coastal and marine environment and the values they discussed in relation to ecological conditions. Another way to interpret this theme borrows from the field of psychology and is referred to as ‘meaning-making’, defined as, ‘the process of how individuals make sense of knowledge, experience, relationships, and the self’ (Ignelzi Citation2000). The values and meanings that interviewees discussed cultivated respect and connection between people and place.
Interviewees cited examples of values which commonly included eating locally sourced food, sharing mo‘olelo, and using traditional names. Seven interviewees spoke explicitly about eating locally sourced food (i.e. caught or gathered on island). One interviewee said, ‘We have to ʻaiFootnote3 of this place in order to understand its value to us. Without that, why take care of a place, yeah? If you cannot eat from it’ (23). Another interviewee said, ‘the diversity of flavors, and just restoring the ʻono, restoring the taste that we have for the things of the sea’ (10). Eight interviewees said that sharing moʻolelo and using traditional place names is a meaningful aspect of their lives. Interviewees explained that moʻolelo and traditional place names speak of the relationship that kūpuna had with the place, resources, and habitat. In reference to using the traditional name for a beach, one person said, ‘[it] not only honors and maintains the integrity of the place, but also informs those that come there, really look at the name, [Place Name], what does it mean?’ (9) This interviewee suggested that the traditional place name teaches both history and proper care for the place. Another interviewee echoed this sentiment, ‘the moʻolelo associated with [the place] and like, how the place names really are clues into the resource management’ (21). During the member-checking process, one interviewee explained,
I think that is just one example of maintaining the integrity of place, by using the traditional names that our kūpuna gifted this place because this is what the place meant to them. I think that’s very important for us in the maintenance of our relationships with ʻāinaFootnote4 and connection with kupuna. (23)
We use the above quotes to point out how CES are embedded within the values and meanings that people create and experience from their relationships with the coastal and marine environment. For example, these quotes point specifically to CES such as Bequest; Education and Knowledge; Heritage, Tradition, Culture; Fulfilling Stewardship; Identity; and Sense of Place. During interviews, we discussed, unprompted, how understanding social values can be useful or beneficial in informing and guiding resource management. One interviewee directly involved in resource management stated that it would be helpful to have this data collected and shared, and the lack of access to this type of information hinders success. According to this interviewee, this is a weak point in the management process.
Discussion
Our analysis sought to deepen our understanding of how CES contribute to human well-being in multi-faceted ways and use this knowledge to bolster marine resource management. We used this understanding to first, improve how social data can be included within ecosystem assessments by recognizing connections between CES; and second, we suggest a strategy for broadening the inclusion of intangible elements of human well-being.
We recognize that this style of research, by nature, does include limitations. Our qualitative, case study approach is contextually bound and less generalizable, with a potential for inherent subjectivity that can lead to bias during analysis and interpretation. Additionally, quality interview data relies on the honesty and transparency of interviewees. Our preliminary research was conducted specifically to mitigate these limitations, identifying key cultural, community, academic, and governance factors to guide this research (Leong et al. Citation2019). Key informants were selected for their extensive knowledge in subjects relevant to our research goals, following the guidance of Palinkas et al. (Citation2015). And, notably, despite our study being funded by NOAA (well known in the study area as a Federal marine management agency), participants provided candid reflections, including criticisms, suggesting a level of comfort with the interview process that supports the authenticity of our findings.
Conducted before the onset of the COVID-19 pandemic, our research does not capture any potential subsequent shifts in environmental perceptions. Nevertheless, it provides a vital pre-pandemic benchmark for future comparative studies. Our study aligns with earlier research (Shackeroff Citation2008; Vaughan Citation2018) and offers a snapshot of pre-pandemic attitudes, providing a point of departure for longitudinal investigations into the pandemic’s influence on public perceptions and values in relation to the marine environment. Although timeline and changing societal values present inherent risks to the current applicability of any study, the contributions of our work lie in these baseline insights, crucial for understanding the evolution of environmental perceptions in the face of global changes.
Strong and diverse connections improve scope of social indicators
The inclusion of CES in the Ecosystem Services framework was important for incorporating elements of human-nature relationships which had largely been missing from resource management frameworks (Millennium Ecosystem Assessment Citation2005). Yet, the CES framework requires a researcher or manager to tease apart people’s experiences and values and place them into distinct categories, even though this is fundamentally contradictory to how CES exist in reality (Fish et al. Citation2016, Gould et al. Citation2019). Our results support the growing understanding that CES are not individual, separate categories, but instead exist as simultaneous and overlapping elements interwoven with each other and other ecosystem services (Klain et al. Citation2014; Amberson et al. Citation2016; Pascua et al. Citation2017; Gould et al. Citation2020). Additionally, and similar to most social concepts, CES arise from interactions and relationships between people and place; therefore, every person’s values and perceptions of CES will differ (Martín-López et al. Citation2012).
Investigating CES individually (i.e. looking at CES through a ‘micro’ lens) does serve an important purpose including understanding details about a specific CES and the mechanisms through which it enhances human well-being (i.e. how it is created, experienced, and/or valued). However, it can be unrealistic to gather this micro-level data for CES across larger scales due to cost and time constraints, and difficulties arise if incorporating into quantitative models or management tools (Leong et al. Citation2019; Freitag et al. Citation2022). Fish et al. (Citation2016) support what we heard during member-checking: that it would be more beneficial to view CES as supporting and reinforcing one another rather than existing separately. In response, we propose focusing monitoring efforts on the CES that have strong and diverse connections with other CES. Our results suggest that indicators of these particular CES (which would likely vary regionally) would also tangentially monitor other CES. For example, Sense of Place was both a strong and diverse connector in our research. This suggests that Sense of Place is very related to the presence, and possibly condition, of CES connected with Sense of Place, such as Aesthetics, Ceremony, and Identity. Using this as guidance can assist with identifying which ecosystem monitoring indicators may be a priority based on their ability to monitor multiple CES and their closely related human well-being domains, such as mental and physical health (Donkersloot et al. Citation2020). This concept is closely related to the topic of ecosystem service ‘bundling’ in which ecosystem services that frequently exist together are examined or monitored in tandem (Martín-López et al. Citation2012; Klain et al. Citation2014; Ament et al. Citation2017; Clements and Cumming Citation2017; Meacham et al. Citation2022). This can be a strong tool for management in guiding the critical selection of indicators, which would benefit from aligning with the preferences of the community (Ament et al. Citation2017; Clements and Cumming Citation2017).
Integrating community insights and values to enhance coastal and marine resource management
Our study presents three interwoven themes that support a comprehensive strategy for including intangible elements of human well-being in ecosystem assessments. The first, Ecosystem Influence, underscores that biological and ecological conditions create opportunities for ecosystems to positively influence human well-being. Our second theme, Dimensions of Coastal and Ocean Access, challenges traditional notions of access and details the multifaceted avenues in which people connect with the marine environment. Our third theme, Values and Meanings, highlights that access to desirable ecosystem conditions is necessary but not sufficient to fully understand if and how the marine environment supports human well-being. By synthesizing these themes, we offer a more comprehensive lens for examining CES and their impacts to human well-being.
Traditionally, ecosystem assessment indicators have monitored ecosystem components and high-level, secondary social data and assumed that these indicators will serve as a proxy for CES (Breslow et al. Citation2017; Dacks et al. Citation2019; Hornborg et al. Citation2019). This link between measurable, biophysical indicator metrics and how much those metrics actually matter to or affect people is widely understudied (Olander et al. Citation2018) and misses the multifaceted nature in which people interact with the environment. Our findings suggest that while the existence of CES fundamentally depends on ecological condition, this does not necessarily reveal how people obtain or value CES (Meacham et al. Citation2022). The derived values and meanings of CES are formed through a complex matrix of experiences, emotions, and memories which influence how people make choices, behave, and address trade-offs. Our research highlights a need to broaden social indicator data to address these gaps.
Successful resource management must include an understanding of how communities feel, prioritize, and make decisions regarding ecosystem services (Hicks et al. Citation2016; Lau et al. Citation2018). Resource management strategies would be bolstered by community input that guides and shapes the process of indicator development. The indicators in ecosystem assessments can more accurately reflect reality if they include data that explains how people access, experience, and value the coastal and marine environment. As our thematic analysis illustrates, these data describe how human well-being is intertwined with the environment. A representative collection of indicators would monitor CES across multiple levels: where they are generated, accessed, and valued.
An essential step in effectively monitoring CES will be to recognize them as an interrelated web, and step away from attempts to measure CES only as segregated categories. This would acknowledge the values that CES provide are often greater as a whole than as individual parts. Including CES in ecosystem assessments in this way would introduce new challenges, such as implementing or designing methodologies for capturing and interpreting complex, intersecting data. Despite challenges, it is a worthwhile effort that is likely to benefit from community involvement. Indicators developed through local, participatory processes are more likely to accurately represent the lived experiences and values of a community, which in turn can bolster support for the ecosystem assessment and subsequent policies (King et al. Citation2014; Hernández-Morcillo et al. Citation2013; Biedenweg et al. Citation2016; Breslow et al. Citation2017; Sterling et al. Citation2017). Future research should aim to address how the complexities of CES that we have described here can positively influence policy-making and conservation strategies.
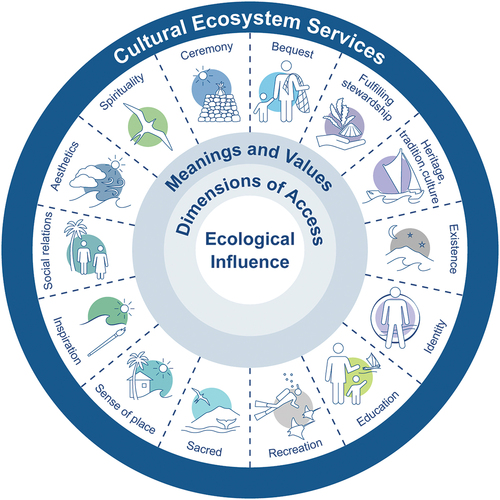
Managing for favorable ecosystem conditions is a critical step for ensuring the availability of CES, yet this step alone is not sufficient. Understanding and monitoring the dimensions of access and the myriad values associated with the marine environment are necessary additions to ecosystem assessment frameworks. Together, these three layers are critical to the existence and understanding of CES as a whole (). To help achieve this goal, we suggest adopting a gestalt perspective that recognizes that biological or ecological indicators alone will not add up to the entire social-ecological system. Such indicators are imperative in understanding ecosystem conditions, but this data alone cannot accurately provide insight on how the relationships between people and their environment contribute to well-being. To support both ecological and social sustainability, indicators must expand to include data on how communities create meaning and assign value to the marine environment. This expanded data would empower communities and bolster management by capturing how people connect with the coastal and marine environment and fostering policy supported by the communities they serve.
Figure 3. A conceptual framework illustrating our thematic analysis. The innermost circle, ecosystem influence, represents the foundation upon which Cultural Ecosystem Services are built. The next circle, dimensions of coastal and ocean access, expands the access to a multidimensional perspective. The next circle, values and meanings, encompasses the diverse social values and meanings associated with the marine environment. These circles build upon one another to create the core of an interrelated web of Cultural Ecosystem Services. This framework underpins the need for a suite of indicators that can represent a gestalt perspective of the social-ecological system they monitor.
Ethics statement
This study was carried out in accordance with the recommendations of the University of Hawai‘i Institutional Review Board with written informed consent from all subjects. The project has exempt status for Human Subjects Research from the University of Hawai‘i Committee on Human Studies under the exempt project 19,449, Socioeconomics of Western Pacific Fisheries.
Appendix B
Download MS Word (32 KB)Appendix A
Download MS Word (23.2 KB)Appendix C
Download MS Excel (22.7 KB)Acknowledgements
This research exists solely because of the generosity of interviewees, to whom we extend our gratitude. Their dedication to protecting their place is admirable and inspiring. We acknowledge and thank project mentors for their input. We give credit to Amanda Merritt for designing and creating all graphics. We thank two anonymous reviewers. This research was supported by NOAA’s Integrated Ecosystem Assessment Program (contribution no. 2023_3).
Disclosure statement
No potential conflict of interest was reported by the author(s).
Data availability statement
The data that support the findings of this study are openly available in NOAA’s Institutional Repository at https://www.fisheries.noaa.gov/inport/item/62739.
Supplementary material
Supplemental data for this article can be accessed online at https://doi.org/10.1080/26395916.2024.2378155.
Notes
1. Kuleana: Right, privilege, concern, responsibility, title, jurisdiction, authority, ownership; reason, cause, function, justification; small piece of property.
2. Moʻolelo: Story, tale, myth, history, tradition, literature, legend, chronical, record.
3. ʻAi: Food, food plant; to eat, destroy, consume; to taste, bite, grasp; edible.
4. ʻĀina: Land, earth; Lit. that which feeds.
References
- Amberson S, Biedenweg K, James J, Christie P. 2016. ‘The heartbeat of our people’: identifying and measuring how salmon influences Quinault tribal well-being. Soc & Nat Resour. 29(12):1389–14. doi: 10.1080/08941920.2016.1180727.
- Ament JM, Moore CA, Herbst M, Cumming GS. 2017. Cultural ecosystem services in protected areas: understanding bundles, trade‐offs, and synergies. Conserv Lett. 10(4):440–450.
- Ash N, Blanco H, Garcia K, Tomich T, Vira B, Zurek M, Brown C. 2012. Assessing ecosystems, ecosystem services, and human well-being. In: Ecosystems and human well-being. Washington (DC): Island Press; p. 1.
- Biedenweg K, Stiles K, Wellman K. 2016. A holistic framework for identifying human wellbeing indicators for Marine policy. Mar Policy. 64:31–37. doi: 10.1016/j.marpol.2015.11.002.
- Braun V, Clarke V. 2006. Using thematic analysis in psychology. Qualitative Res Phychol. 3(2):77–101. doi: 10.1191/1478088706qp063oa.
- Breslow SJ, Allen M, Holstein D, Sojka B, Barnea R, Basurto X, Carothers C, Charnley S, Coulthard S, Dolsak N, et al. 2017. Evaluating indicators of human well-being for ecosystem-based management. Ecosyst Health Sustainability. 3(12):1–18. doi: 10.1080/20964129.2017.1411767.
- Breslow SJ, Sojka B, Barnea R, Basurto X, Carothers C, Charnley S, Coulthard S, Dolšak N, Donatuto J, García-Quijano C, et al. 2016. Conceptualizing and operationalizing human wellbeing for ecosystem assessment and management. Environ Sci & Policy. 66:250–259. doi: 10.1016/j.envsci.2016.06.023.
- Chan K, Goldstein J, Satterfield T, Hannahs N, Kikiloi K, Naidoo R, Vadeboncoeur N, Woodside U. 2011. Cultural services and non-use values. In: Natural capital: theory & practice of mapping ecosystem services. Oxford, (UK): Oxford University Press; p. 206–228.
- Chan KMA, Guerry AD, Balvanera P, Klain S, Satterfield T, Basurto X, Bostrom A, Chuenpagdee R, Gould R, Halpern BS, et al. 2012. Where are cultural and social in ecosystem services? A framework for constructive engagement. BioScience. 62(8):744–756. doi: 10.1525/bio.2012.62.8.7.
- Clements HS, Cumming GS. 2017. Manager strategies and user demands: determinants of cultural ecosystem service bundles on private protected areas. Ecosystem Serv. 28:228–237.
- Dacks R, Ticktin T, Mawyer A, Caillon S, Claudet J, Fabre P, Jupiter SD, McCarter J, Mejia M, Pascua P, et al. 2019. Developing biocultural indicators for resource management. Conserv Sci Pract. 1(6):e38. doi: 10.1111/csp2.38.
- Dillard MK, Goedeke TL, Lovelace S, Orthmeyer A. 2013. Monitoring well-being and changing environmental conditions in coastal communities: development of an assessment method. https://repository.library.noaa.gov/view/noaa/385.
- Donkersloot R, Black JC, Carothers C, Ringer D, Justin W, Clay PM, Poe MR, Gavenus ER, Voinot-Baron W, Stevens C. 2020. Assessing the sustainability and equity of Alaska salmon fisheries through a well-being framework. Ecol Soc. 25(2). doi: 10.5751/ES-11549-250218.
- Donkersloot R, Coleman J, Carothers C, Ringer D, Cullenberg P. 2020. Kin, community, and diverse rural economies: rethinking resource governance for Alaska rural fisheries. Mar Policy. 117:103966. doi: 10.1016/j.marpol.2020.103966.
- Fish R, Church A, Winter M. 2016. Conceptualising cultural ecosystem services: a novel framework for research and critical engagement. Ecosyst Serv. 21:208–217. doi: 10.1016/j.ecoser.2016.09.002.
- Folke C, Biggs R, Norström AV, Reyers B, Rockström J. 2016. 3. Social-ecological resilience and biosphere-based sustainability science. E&S. 21(3). http://www.jstor.org/stable/26269981.
- Freitag A, Blake S, Clay PM, Haynie AC, Kelble C, Jepson M, Kasperski S, Leong KM, Moss JH, Regan SD. 2022. Scale matters: relating wetland loss and commercial fishing activity in Louisiana across spatial scales. Nat Culture. 17(2):144–169. doi: 10.3167/nc.2022.170202.
- Friedlander A, Aeby G, Brainard R, Brown E, Chaston K, Clark A, McGowan P, Montgomery T, Walsh W, Williams I, et al. 2008. The state of coral reef ecosystems of the main hawaiian islands. In: Waddell J Clarke A, editors. The state of coral reef ecosystems of the United States and pacific freely associated states: 2008. Silver Spring (MD): NOAA Technical Memorandum NOS NCCOS 73. NOAA/NCCOS Center for Coastal Monitoring and Assessment’s Biogeography Team. p. 219–261, 558.
- Glesne C. 2016. Becoming qualitative researchers: an introduction. 5th ed. New Jersey: Pearson.
- Gould RK, Adams A, Vivanco L. 2020. Looking into the dragons of cultural ecosystem services. Ecosyst People. 16(1):257–272. doi: 10.1080/26395916.2020.1815841.
- Gould RK, Ardoin NM, Woodside U, Satterfield T, Hannahs N, Daily GC. 2014. The forest has a story: cultural ecosystem services in Kona, Hawai‘i. E&S. 19(3):29. doi: 10.5751/Es-06893-190355.
- Gould RK, Morse CE, Brooks J, Adams A. 2022. “SO MUCH FOR ACCESS:” DIFFERENCE, BENEFITS, AND BARRIERS AT HAWAII’S SHORELINES. Geographical Rev. 112(4):532–549.
- Gould RK, Morse JW, Adams AB, Ladle R. 2019. Cultural ecosystem services and decision-making: how researchers describe the applications of their work. People Nat. 1(4):457–475. doi: 10.1002/pan3.10044.
- Gove JM, Lecky J, Walsh WJ, Ingram RJ, Leong K, Williams ID, Polovina JJ, Maynard J, Whittier R, Kramer KL. 2019. West Hawaiʻi integrated ecosystem assessment ecosystem status report. NOAA Pacific Islands Fisheries Science Center. Special Report (SP-19-001).
- Hernández-Morcillo M, Plieninger T, Bieling C. 2013. An empirical review of cultural ecosystem service indicators. Ecol Indic. 29:434–444. doi: 10.1016/j.ecolind.2013.01.013.
- Hicks CC, Levine A, Agrawal A, Basurto X, Breslow SJ, Carothers C, Charnley S, Coulthard S, Dolsak N, Donatuto J, et al. 2016. Engage key social concepts for sustainability. Science. 352(6281):38–40. doi: 10.1126/science.aad4977.
- Hornborg S, van Putten I, Novaglio C, Fulton EA, Blanchard JL, Plaganyi E, Bulman C, Sainsbury K. 2019. Ecosystem-based fisheries management requires broader performance indicators for the human dimension. Mar Policy. 108:103639. doi: 10.1016/j.marpol.2019.103639.
- Huynh LTM, Gasparatos A, Su J, Dam Lam R, Grant EI, Fukushi K. 2022. Linking the nonmaterial dimensions of human-nature relations and human well-being through cultural ecosystem services. Sci Adv. 8(31):eabn8042. doi: 10.1126/sciadv.abn8042.
- Ignelzi M. 2000. Meaning-making in the learning and teaching process. New Directions Teach Learn. 2000(82):5–14. doi: 10.1002/tl.8201.
- Ingram RJ, Leong KM, Gove J, Wongbusarakum S. 2020. Including human well-being in resource management with cultural ecosystem services. U.S. Department of Commerce, NOAA. Technical Memorandum NOAA-TM-NMFS-PIFSC-112; p. 94.
- Ingram RJ, Oleson KLL, Gove JM. 2018. Revealing complex social-ecological interactions through participatory modeling to support ecosystem-based management in Hawai‘i. Mar Policy. 94:180–188. doi: 10.1016/j.marpol.2018.05.002.
- Ives CD, Abson DJ, von Wehrden H, Dorninger C, Klaniecki K, Fischer J. 2018. Reconnecting with nature for sustainability. Sustain Sci. 13(5):1389–1397. doi: 10.1007/s11625-018-0542-9.
- King MF, Renó VF, Novo EM. 2014. The concept, dimensions and methods of assessment of human well-being within a socioecological context: a literature review. Soc Indic Res. 116:681–698.
- Klain SC, Satterfield TA, Chan KMA. 2014. What matters and why? Ecosystem services and their bundled qualities. Ecol Econ. 107:310–320. doi: 10.1016/j.ecolecon.2014.09.003.
- Kosanic A, Petzold J. 2020. A systematic review of cultural ecosystem services and human wellbeing. Ecosyst Serv. 45:101168. doi: 10.1016/j.ecoser.2020.101168.
- Lau JD, Hicks CC, Gurney GG, Cinner JE. 2018. Disaggregating ecosystem service values and priorities by wealth, age, and education. Ecosyst Serv. 29:91–98. doi: 10.1016/j.ecoser.2017.12.005.
- Leemans R, de Groot RS. 2003. Millennium ecosystem assessment: ecosystems and human well-being: a framework for assessment. (WA)/Covelo/London: Island Press.
- Leong KM, Wongbusarakum S, Ingram RJ, Mawyer A, Poe M. 2019. Improving representation of human well-being and cultural importance in conceptualizing the West Hawai‘i ecosystem. Front Mar Sci. 6:231. doi: 10.3389/fmars.2019.00231.
- Martín-López B, Iniesta-Arandia I, García-Llorente M, Palomo I, Casado-Arzuaga I, García Del Amo D, Gómez-Baggethun E, Oteros-Rozas E, Palacios-Agundez I, Willaarts B, et al. 2012. Uncovering ecosystem service bundles through social preferences. PLOS ONE. 7(6):e38970. doi: 10.1371/journal.pone.0038970.
- Meacham M, Norström AV, Peterson GD, Andersson E, Bennett EM, Biggs R(, Crouzat E, Cord AF, Enfors E, Felipe-Lucia MR, et al. 2022. Advancing research on ecosystem service bundles for comparative assessments and synthesis. Ecosyst People. 18(1):99–111. doi: 10.1080/26395916.2022.2032356.
- Michalos AC, Smale B, Muharjarine RLN, Scott K, Moore K, Swystun L, Holden B, Bernardin H, Dunning B. 2011. The Canadian index of wellbeing: technical report 1.0. Waterloo (ON): Canadian Index of Wellbeing and University of Waterloo.
- Milcu AI, Hanspach J, Abson D, Fischer J. 2013. Cultural ecosystem services: a literature review and prospects for future research. E&S. 18(3). doi: 10.5751/ES-05790-180344.
- Millennium Ecosystem Assessment. 2005. Ecosystems and their services. Washington (DC): Island Press.
- Millennium Ecosystem Assessment Board. 2005. Ecosystems and human well-being: a framework for assessment. Washington (DC): Island Press.
- O’Higgins TG, Lago M, DeWitt TH. 2020. Ecosystem-based management, ecosystem services and aquatic biodiversity: theory, tools and applications. Cham, Switzerland: Springer Nature.
- Olander LP, Johnston RJ, Tallis H, Kagan J, Maguire LA, Polasky S, Urban D, Boyd J, Wainger L, Palmer M. 2018. Benefit relevant indicators: ecosystem services measures that link ecological and social outcomes. Ecol Indic. 85:1262–1272. doi: 10.1016/j.ecolind.2017.12.001.
- Palinkas LA, Horwitz SM, Green CA, Wisdom JP, Duan N, Hoagwood K. 2015. Purposeful sampling for qualitative data collection and analysis in mixed method implementation research. Adm Policy Ment Health Ment Health Serv Res. 42(5):533–544. doi: 10.1007/s10488-013-0528-y.
- Pascua P, McMillen H, Ticktin T, Vaughan M, Winter KB. 2017. Beyond services: a process and framework to incorporate cultural, genealogical, place-based, and indigenous relationships in ecosystem service assessments. Ecosyst Serv. 26:465–475. doi: 10.1016/j.ecoser.2017.03.012.
- Patton MQ. 1990. Qualitative evaluation and research methods, 2nd ed. Thousand Oaks (CA), US: Sage Publications, Inc.
- Piet G, Delacámara G, Kraan M, Röckmann C, Lago M. 2020. Advancing aquatic ecosystem-based management with full consideration of the social-ecological system. In: O’Higgins TG, Lago M, DeWitt TH, editors. Ecosystem-based management, ecosystem services and aquatic biodiversity. Cham: Springer; p. 17–37.
- Qiang H, Silliman BR. 2019. Climate change, human impacts, and coastal ecosystems in the anthropocene. Curr Biol. 29(19):R1021–35. doi: 10.1016/j.cub.2019.08.042.
- Rice JC, Rochet MJ. 2005. A framework for selecting a suite of indicators for fisheries management. Ices J Mar Sci. 62(3):516–527. doi: 10.1016/j.icesjms.2005.01.003.
- Rodrigues JG, Conides AJ, Rivero Rodriguez S, Raicevich S, Pita P, Kleisner KM, Pita C, Lopes PF, Alonso Roldáni V, Ramos SS. 2017. Marine and coastal cultural ecosystem services: knowledge gaps and research priorities. One Ecosyst. 2(2017):e12290. doi: 10.3897/oneeco.2.e12290.
- Saldaña J. 2021. The coding manual for qualitative researchers. Coding Man Qual Res. 1–440.
- Seidman I. 2006. Interviewing as qualitative research: a guide for researchers in education and the social sciences. UK: Teachers College Press.
- Shackeroff JM. 2008. The historical ecology and social-ecological systems of Kona coast coral reefs: towards ‘peopled’ approaches to marine science and management [ Doctoral dissertation]. Duke University.
- Smith CL, Clay PM. 2010. Measuring subjective and objective well-being: analyses from five Marine commercial fisheries. Hum Organ. 69(2):158–168. doi: 10.17730/humo.69.2.b83x6t44878u4782.
- Smith LM, Case JL, Smith HM, Harwell LC, Summers JK. 2013. Relating ecosystem services to domains of human well-being: foundation for a US index. Ecol Indic. 28:79–90. doi: 10.1016/j.ecolind.2012.02.032.
- Sterling E, Ticktin T, Morgan TKK, Cullman G, Alvira D, Andrade P, Bergamini N, Betley E, Burrows K, Caillon S, et al. 2017. Culturally grounded indicators of resilience in social-ecological systems. Environ Soc Adv Res. 8(1):63–95. doi: 10.3167/ares.2017.080104.
- Vaughan MB. 2018. Kaiaulu: gathering tides. Corvallis, Oregon: Oregon State University Press.
- Willis C, Papathanasopoulou E, Russel D, Artioli Y. 2018. Harmful algal blooms: the impacts on cultural ecosystem services and human well-being in a case study setting, Cornwall, UK. Mar Policy. 97:232–238. doi: 10.1016/j.marpol.2018.06.002.
- Wongbusarakum S, Myers Madeira E, Hartanto H. 2014. Strengthening the social impacts of sustainable landscapes programs: a practitioner’s guidebook to strengthen and monitor human well-being outcomes. Arlington (VA): The Nature Conservancy; p. 4.
- Yin RK. 2009. Case study research: design and methods. Vol. 5. Thousand Oaks (CA): Sage.