
ABSTRACT
This study investigated the influence of sludge retention time (SRT) in three hybrid membrane bioreactors to treat domestic wastewater at different SRTs (10, 20, and 40 d) simultaneously, based on extracellular polymeric substances (EPS) analysis. The results showed that significant positive correlation existed between SRT and humic acids quantity in TB-EPS, humic acids quantity in S-EPS, DNA quantity in S-EPS, and total quantity in TB-EPS, with the correlation coefficient 0.9992, 0.9980, 0.9973, 0.9821, respectively. Significant negative correlation existed in SRT and proteins in TB-EPS, proteins quantity in S-EPS, and polysaccharose in S-EPS, with the correlation coefficient 0.9993, 0.9107, 0.8552, respectively. A high logarithmic relationship existed between supernatant turbidity and SVI. The optimal SRT was 20 d and the corresponding operational cycle of the membrane module was 109 d.
1. Introduction
In recent years, membrane bioreactors have been widely employed for sewage and wastewater treatment. These reactors can also help to alleviate water shortages, which have become a global concern. Hybrid submerged membrane bioreactors (HMBRs) have many advantages such as bio-stability, a lower land footprint, and stability effluent quality despite high shock [Citation1–Citation5]. However, problems associated with membrane fouling pose obstacles to the large-scale application of HMBRs in wastewater treatment plants [Citation6–Citation8]. Further, the behavior of HMBR fouling is quite complex compared to that of most other membrane bioreactors because of the unique characteristics of activated sludge [Citation9,Citation10]. Several studies have focused on the membrane fouling process of HMBR. However, there is no clarity regarding its mechanism. Previous studies recognized extracellular polymeric substances (EPS) as the main material leading to membrane fouling, and HMBR, which is composed of a conventional MBR (CMBR) and biofilm technology, exhibits good membrane fouling resistance [Citation7,Citation10–Citation12]. EPS are typically formed by the metabolism and cellular digestion of microorganisms commonly found in the internal and on the external surfaces of activated sludge flocs. The term EPS is typically used as a generic terminology for different types of high molecular substances. The relative molecular mass of EPS is often in excess of 10,000 Dalton. The main components of EPS are polysaccharides, proteins, glucuronic acid, humic acids, nucleic acids, lipids, and so on. Further, the formation and degradation of EPS are closely related to the external environment and the survival state of the microbes. EPS are generally categorized as soluble EPS (S-EPS) and bound EPS (B-EPS), with the latter being subdivided into loosely bound EPS (LB-EPS) and tightly bound EPS (TB-EPS).
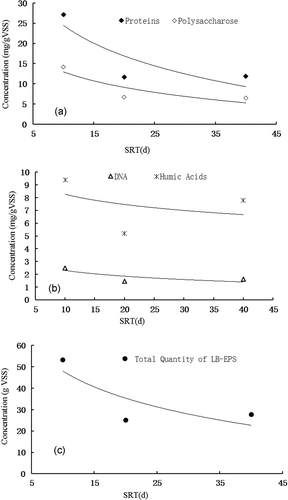
Figure 3. Relationship between SRT and quantities of TB-EPS components. (a) proteins and polysaccharose, (b) humic acids and dna, (c) total quantity of TB-EPS.
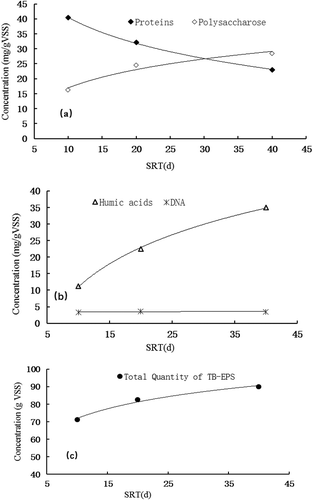
Figure 4. Relationship between SRT and quantities of S-EPS components. (a) proteins and polysaccharose, (b) humic acids and dna, (c) total quantity of S-EPS.
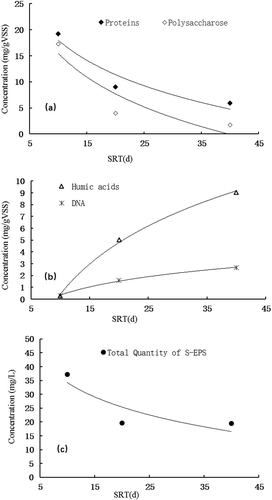
Figure 6. Correlations of supernatant turbidity and SVI under different SRTs.
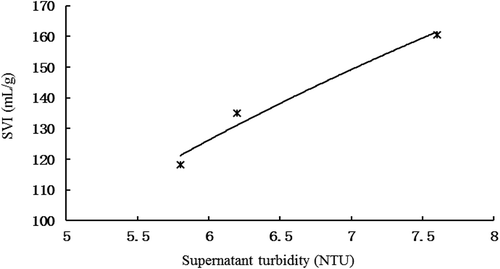
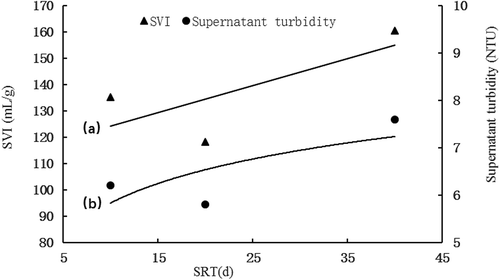
Figure 7. Correlations of (a) SRT and supernatant turbidity, (b) SRT and SVI.
Some scholars have studied the components of EPS using three-dimensional fluorescence excitation-emission spectrometry (EEM) [Citation13–Citation16]. Most studies have investigated its proteins and carbohydrates, but few have analyzed the remaining components of EPS. Chabalina and Pastor [Citation17] suggested that the major membrane fouling components in B-EPS are proteins. Janus and Paul [Citation18] stated that the major membrane fouling components in S-EPS are proteins. Several researchers have analyzed the components of EPS under different working conditions, and they have also compared different EPS extraction methods [Citation19–Citation27]. Operating parameters, membrane characteristics, activated sludge, and dissolved organic matter (DOM) characteristics have been implicated in the occurrence of membrane fouling [Citation20,Citation21,Citation25,Citation28,Citation29]. Among the factors that influence membrane fouling, solid retention time (SRT) is the most influential operating parameter [Citation10,Citation30] as it can change DOM characteristics inbound EPS, soluble microbial products (S-EPS), sludge supernatants, and the characteristics of effluent discharged by membrane bioreactors (MBRs). Note that the above research results are based on artificial wastewater rather than real wastewater. Thus, reports focusing on real municipal and synthetic sewage are lacking. Therefore, the theoretical understanding for optimum operations of wastewater treatment plants (WWTPs) appears to be lacking with regard to some factors such as seasonal changes and fluctuations in raw wastewater quality [Citation10,Citation31,Citation32].
In this research, the effect of SRT in HMBRs is studied from the perspective of EPS, as this material is known to cause membrane fouling. Section 2 provides information required to repeat the experiments and validate their results, including how the raw feed wastewater was obtained and details on the equipment setup and sample analysis. Section 3 discusses the influence of SRT in three hybrid membrane bioreactors based on the analysis of the EPS. The paper also discusses the development of supernatant turbidity and sludge volume index (SVI).
2. Materials and methods
2.1 Raw feed wastewater
Wastewater samples obtained from the primary settling tank at the municipal WWTP in Xuzhou, Jiangsu Province (China) were used in the investigation. The wastewater samples are representative of typical urban mixed sewage. The characteristics of the raw feed wastewater appear in .
Table 1. Characteristics of the raw feed wastewater.
2.2 Experimental setup
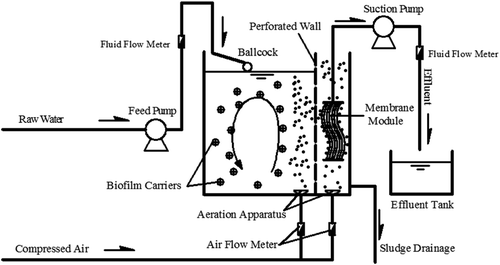
Three identical HMBRs () with an effective volume of 100 L were operated for different SRTs (10, 20, and 40 d) for a period of 12 months under the same hydraulic retention time (HRT) of 10 h. The HMBRs used in this study consisted of a 1-m3 reactor membrane bio-reactor tank with a submerged enhanced polyvinylidene fluoride (PVDF) membrane module. The area was 10 m2 and the effective pore size was 0.1 μm. With an attached feed reservoir, up to 100 L of water could be filtered per hour for the ultrafiltration experiments. Air bubbles were injected from the bottom of the membrane tank at a predetermined flow rate of 2 m3·m−2 membrane area h−1 to scour the membranes and mix the contents of the reactor, and to provide oxygen for biomass suspension. A peristaltic pump at a constant flux of 2.5 L ·m−2 h−1 was used to remove the permeate. Pressure transducers with online data acquisition were used to monitor the transmembrane pressure (TMP) every 5 min. Other operational conditions of the HMBRs are listed in .
Table 2. Operational conditions of HMBR.
Figure 1. Schematic of the HMBR system.
2.3 Sample analysis
Mixed liquor suspended solids (MLSS), mixed liquor volatile suspended solids (MLVSS), chemical oxygen demand (CODCr), total nitrogen (T-N), and total phosphorus (T-P) were measured according to standard methods [Citation33,Citation34]. The methods suggested by previous studies [Citation35–Citation37] for extracting and analyzing S-EPS, LB-EPS, and TB-EPS from the mixed liquor and biofilm were also used in this study. These methods are described below.
2.3.1 Extraction of EPS from the mixed liquor
The S-EPS are obtained by directly filtering 5 mL of mixed liquor through a 0.22-mm-pore size filter. High-speed centrifugation was used to extract LB-EPS from the mixed liquor. First, 5 mL of the mixture was taken in a 7-mL centrifuge tube, and centrifuged at 12,000 rpm for 20 min. Then, it was filtered with using a 0.22-µm microfiltration membrane, and the EPS component of the filtrate was determined. The difference between the EPS component of the filtrate and S-EPS is the LB-EPS. The volume of the mixed liquor reduced after the filtration procedure for extracting the LB-EPS, and thus, 5 mL of pure water was added to the centrifuge tube to replenish the loss. It was mixed well and then heated for 30 min in an 80°C water bath. Next, the sample was centrifuged under 12,000 rpm for 20 min, and the supernatant was filtered through a 0.22 µm microfiltration membrane. The filtrate was used to determine the EPS component.
2.3.2 Extraction of EPS from the mixed biofilm
The biofilm attached to the filter was removed by washing, and then enriched using filter paper. The enriched biofilm was collected in a test tube and mixed with water to form a mixture of a certain concentration, so as to test the quantity of the EPS (including LB-EPS and TB-EPS). Because no S-EPS existed in the biofilm, only LB-EPS and TB-EPS needed to be tested. The extraction method for LB-EPS and TB-EPS was the same as that for the mixed liquid.
2.3.3 Detection of EPS
The concentration of EPS is usually expressed as milligram per unit mass VSS, and are characterized by total organic carbon (TOC) content. The components of EPS include polysaccharides, proteins, humic acids, DNA, and so on. Sugar was detected by anthrone colorimetry, using glucose as the standard reference. Protein and humic acid concentrations were determined by the improved Lowry method, using bovine serum albumin as the standard reference. The detection method for the S-EPS is the same as that for the EPS. A detailed description of the detection methods for polysaccharides, proteins, and DNA appears in Yu et al. [Citation37].
3. Results and discussion
3.1. MBR performance
The general performance of the HMBRs over 12 months of operation under different SRTs (R1: 10 d, R2: 20 d, and R3: 40 d) is shown in , in terms of MLSS, MLVSS, COD, T-N, and T-P.
Table 3. Performance of the HMBRs under different SRTs.
indicates that the HMBRs could effectively remove organic substances, with an average COD removal efficiency of up to 91%. Further, the COD removal efficiency increased as SRT increased. The HMBRs were operated under oxic conditions, resulting in nitrification. They removed nutrients effectively, with average T-N and T-P removals at 62.0% and 96%, respectively, which did not increase with an increase in SRT. Higher T-P removals were achieved for R2 (96.4%), followed by R1 (96%) and R3 (95.8%), and the T-P removal was correlated with the amount of excess sludge under different SRTs. Biological denitrification and biological phosphorus removal require two processes: nitrification under aerobic conditions and denitrification under anoxic conditions, and the release of phosphorus under anaerobic conditions and the phosphorus uptake reaction under aerobic conditions, respectively. The traditional theory of biological nitrogen and phosphorus removal considers that different reactions must occur in different structures owing to the different conditions required for the reactions [Citation38,Citation39]. The results showed that both the anoxic and anaerobic zones may exist in the interior of the activated sludge, with a certain biofilm thickness, under low dissolved oxygen (DO) concentration, and this can be attributed to influence of the oxygen mass transfer resistance [Citation40]. Thus, the anoxic condition (to drive the denitrification reaction) as well as the anaerobic condition (to drive the phosphorus release reaction) co-exist. DO was controlled at about 1 mg·L−1 in this experiment, and the reactors clearly influence both nitrogen and phosphorus removals.
MLSS and MLVSS concentrations increased with the extension of the SRT from 10 d (R1) to 40 d (R3). The ratio of MLVSS/MLSS decreased with increasing SRTs, ranging from 0.72 (R1) to 0.54 (R3) in the HMBRs. The lowest MLVSS/MLSS ratio was observed in R3, indicating the low viability of biomass from bio-decay effects and/or the accumulation of inert substances in the HMBRs after a long SRT.
The variation of S-EPS with SRT was the same as that of COD. When SRT was 10 d, the average concentration of S-EPS was 37.0 mg·g−1. The average concentration of S-EPS decreased gradually with an increase in SRT, and the average concentration of S-EPS decreased to 18.0 mg·g−1 when the SRT was 40 d.
3.2. Effect of SRT on the total quantity and components of EPS
Ali [Citation41] found that a low food-to-microorganisms (F/M) ratio (substrate-limiting conditions) and long SRT influence the microbial activity of biomass in MBRs; they suggested that the microbial activity of the biomass increased as SRT decreased. show the average concentrations of bound EPS (mg TOC·g−1 VSS) obtained from R1, R2, and R3. It can be seen that LB-EPS concentrations decreased with the extension of SRT from 10 d (R1) to 20 d (R2). However, they remained stable as SRT was prolonged. On the other hand, TB-EPS concentrations increased with the extension of SRT. The average concentrations of S-EPS in the sludge supernatants were 37.1, 19.59, and 19.44 mg·L−1 for R1, R2, and R3, respectively. Both S-EPS and LB-EPS increased with decreasing SRT, indicating that more utilization-associated products may be present in S-EPS under short SRTs (high F/M ratio).
Figure 2. Relationship between SRT and quantities of LB-EPS components. (a) proteins and polysaccharose, (b) humic acids and DNA, (c) total quantity of LB-EPS.
In LB-EPS, proteins and polysaccharose decreased rapidly with an increase in SRT and stabilized thereafter; the concentrations of humic acid and DNA first reduced and then increased as SRT increased. With regard to TB-EPS, a continued decline was noticed for proteins. Otherwise, both polysaccharose and humic acids showed a continued rise as SRT increased. Humic acids and DNA ranged widely in S-EPS compared to LB-EPS and LB-EPS.
showed that no significant correlation was found between SRT and humic acids quantity in LB-EPS, DNA quantity in TB-EPS (). Significant positive correlation existed successively between humic acids quantity in TB-EPS (, 0.9992), SRT and humic acids quantity in S-EPS (, 0.9980), DNA quantity in S-EPS (, 0.9973), and total quantity in TB-EPS (, 0.9821). Furthermore, some components did not exhibit any positive correlation with the SRT, but significant negative correlation existed, such as proteins quantity in TB-EPS (, 0.9993), proteins quantity in S-EPS (, 0.9107), and polysaccharose in S-EPS (, 0.8552). Among these components, humic acids affect the flocculation capacity of the sludge, which is not conducive to the granulation of the sludge. Because they are mainly aliphatic and aromatic high polymers and their hydrogen ions can be dissociated and exchanged with cations in solution as they contain functional groups such as carboxyl groups and phenolic groups. Therefore, the content of proteins and humic acids should be controlled by adjusting the SRT to improve sludge flocculation capacity. This implied that the proteins and humic acids could be employed as a universal indicator of membrane fouling potential for HMNRs at different SRTs. This is an important finding that has not been reported before.
Table 4. Relationship between SRT and quantities of LB-EPS components.
Table 5. Relationship between SRT and quantities of TB-EPS components.
Table 6. Relationship between SRT and quantities of S-EPS components.
3.3. Development of trans-membrane pressure
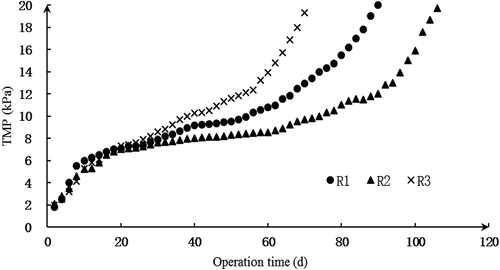
The membrane hydraulic resistance was calculated via online data acquisition every 5 min. Changes in the TMP of R1, R2, and R3 are shown in , and the increasing rate of TMP per unit time indicates a high fouling rate in HMBRs. Liu et al. [Citation7] found that HMBRs show better membrane fouling control than CMBRs. When the transmembrane pressure reached 20 kPa, the HMBRs were operated for 143 d while the CMBRs were operated for only 57 d [Citation38]. also shows that the relationship between the rate of increase and SRT is not linear; the point of inflection occurs when SRT is 40 d. Reactor dynamics under an SRT of 30 d should be studied to determine the inflection point accurately. This inflection point exists for LB-EPS and S-EPS too. Kornboonraksa and Lee [Citation42] reported MLSS to be the dominant factor influencing membrane filtration ability (with a negative correlation) for piggery wastewater treatment, while sludge viscosity, bound EPS, and S-EPS were considered as sub-factors for membrane fouling. However, researchers are still debating the correlation between MLSS concentration and membrane performance in MBR systems [Citation43]. In this study, LB-EPS and S-EPS were considered as major factors in membrane fouling, and lower MLSS concentration leads to better MBR operation, resulting in fewer fouling problems. The operation time was prolonged as SRT changed from 10 d to 20 d, but thereafter, it decreased rapidly when SRT increased.
Figure 5. TMP variations over time for R1, R2, and R3.
3.4 Development of supernatant turbidity and SVI
The SVI (units: mL·g−1) is defined as the ratio of the volume to dry weight of the sludge mixture after sedimentation for 30 min in a 1-L measuring cylinder. SVI is an important index as it serves as an indicator of various problems. A low SVI value indicates that the particle size is small and dense, but the proportion of inorganics is large. A high value indicates that the sludge settling performance is not good, and sludge bulking will occur or may have already occurred. The SVI of treated municipal sewage typically ranges from 50 to 150 mL·g−1, and 150 mL·g−1 is often regarded as the limit for sludge expansion.
and showed that SVI presented the same change tendency as supernatant turbidity and a high logarithmic relationship existed between these two parameters. Otherwise, different correlations were found between these two parameters and SRTs, a linear relationship between SVI and SRT, and logarithmic relationship between supernatant turbidity and SRT (as shown in , ). These two aspects indicated that the best operating condition appeared under an SRT of 20 d, and the quality of supernatant deteriorated when SRT was prolonged, as SVI exceeded 150 mL·g−1. This indicated that supernatant turbidity could be employed as a substitute indicator of SVI to investigate the sedimentation performance of sludge.
Table 7. Changes of supernatant turbidity and SVI under different SRTs.
Table 8. Correlations of supernatant turbidity and SVI under different SRTs.
4. Conclusions
Three identical HMBRs treated with domestic wastewater under different SRTs (10, 20 and 40 d) were studied using EPS analysis. The results showed that HMBRs can remove organic substances effectively, with an average COD removal efficiency of up to 91%, TN removal of 62.0%, and TP removal of 96%. The COD removal efficiency increased as SRT increased, whereas TN and TP presented different trends. The HMBRs can provide anoxic and anaerobic conditions to improve the denitrification reaction and phosphorus release reaction, respectively. Based on observations of the TMP over 12 months, membrane fouling worsened as SRT was prolonged beyond 20 d, suggesting that an optimized SRT, of between 20 d and 40 d, likely exists. When the SRT was prolonged from 10 d to 20 d, the operational period of the membrane module increased by 22.1%, and thereafter, the operational period declined rapidly. Consequently, the optimal SRT is 20 d and the corresponding operational cycle of the membrane module is 109 d. The MLVSS/MLSS ratio decreased with increasing SRTs, indicating that the low viability of biomass from bio-decay effects and/or inert substances accumulated in the HMBRs after long SRTs. Analysis of EPS components showed that different trends appeared with the change of SRT. Significant positive correlation existed between humic acids quantity in TB-EPS, SRT and humic acids quantity in S-EPS, DNA quantity in S-EPS, and total quantity in TB-EPS. Significant negative correlation existed in TB-EPS, proteins quantity in S-EPS, and polysaccharose in S-EPS. The decrease in LB-EPS could improve sludge flocculation and sedimentation, resulting in an increase in operating time. A high logarithmic relationship existed between supernatant turbidity and SVI., indicating that supernatant turbidity could be employed as a substitute indicator of SVI to investigate the sedimentation performance of sludge.
The specific cake resistance of the cake layer accumulated on the membrane surface was not determined in this study. Thus, the relationship between the cake layer and components of EPS under different SRTs should be verified in future studies.
Acknowledgments
This work was supported by the Jiangsu Ministry of Housing and Urban and Rural Construction Project (No. 00730091), the Jiangsu Natural Science Foundation (No. BK20151161), major projects of Natural Science Research in Jiangsu higher education institutions (No. 17KJA610004), Qinglan Project in Jiangsu Province, A Project Funded by the Priority Academic Program Development of Jiangsu Higher Education Institutions (PAPD), Scientific Research Projects of Xuzhou Institute of Engineering (No.XKY2013106, XKY2018245) and Xuzhou Science and Technology Project (No. KC16SQ192).
Disclosure statement
No potential conflict of interest was reported by the authors.
Additional information
Funding
Related Research Data
References
- Park D, Yun Y-M, Kim H, et al. Mechanism of biofouling mitigation on nanofiltration membrane by non-oxidizing biocide. Desalin Water Treat. 2017;99:102–106.
- Chong TH, Fane AG. Implications of critical flux and cake enhanced osmotic pressure (CEOP) on colloidal fouling in reverse osmosis: modeling approach. Desalin Water Treat. 2009;8:68–90.
- Aslam M, Charfi A, Lesage G, et al. Membrane bioreactors for wastewater treatment: a review of of mechanical cleaning by scouring agents to control membrane fouling. Chem Eng J. 2017;307:897—913.
- Fu C, Yue X, Shi X, et al. Membrane fouling between a membrane bioreactor and a moving bed membrane bioreactor: effects of solid retention time. Chem Eng J. 2017;309:397—408.
- Tijing LD, Woo YC, Choi JS, et al. Fouling and its control in membrane distillation: a review. J Membr Sci. 2015;475:215–244.
- Liu Q, Wang XC, Liu Y, et al. Performance of a hybrid membrane bioreactor in municipal wastewater treatment. Desalination. 2010;258(1/3):143—147.
- Liu Q, Wang XC. Membrane fouling control mechanism of a hybrid membrane bioreactor. Environ Sci Technol. 2012;35(7):12–15.
- Pearce GK. Fouling behaviour for different module formats in membrane filtration applications for surface water treatment. Desalin Water Treat. 2009;8:48–53.
- Chang I-S, Field R, Cui Z. Limitations of resistance-in-series model for fouling analysis in membrane bioreactors: a cautionary note. Desalin Water Treat. 2009;8:31–36.
- Liu Q, Yan JW, Xu DL, et al. Effect and mechanism of sludge retention time on menbrane fouling in a hybrid membrane bioreactor on the basis of extracellular polymeric substances analysis. Environ Eng. 2018;36(1):32–36.
- Liu Q, Fu S, Du YJ. Study on pollutants removal performance of an innovative submerged hybrid membrane bioreactor for municipal wastewater treatment. China Water Wastewater. 2007;23(5):10–13.
- Liu Q, Wang XC. Effect of bond extracellular polymeric substances on membrane fouling control property of a HMBR. Chin J Environ Eng. 2012;6(12):4395–4398.
- de la Torre T, Harff M, Lesjean B, et al. Characterisation of polysaccharide fouling of an ultrafiltration membrane using model solutions. Desalin Water Treat. 2009;8:17–23.
- Wang ZW, Tang SJ, Zhu YF, et al. Fluorescent dissolved organic matter variations in a submerged membrane bioreactor under different sludge retention times, J. Membr Sci. 2010;355:151–157.
- Liang S, Zhao Y, Liu C, et al. Effect of solution chemistry on the fouling potential of dissolved organic matter in membrane bioreactor systems, J. Membr Sci. 2008;310:503—511.
- Kimura K, Naruse T, Watanabe Y. Changes in characteristics of soluble microbial products in membrane bioreactors associated with different solid retention times: relationto membrane fouling, J. Water Res. 2009;43:1033—1039.
- Chabalina LD, Pastor MR, Rico DP. Characterization of soluble and bound EPS obtained from 2 submerged membrane bioreactor by 3D-EEM and HPSEC. Talanta. 2013;115:706–712.
- Janus T, Paul P, Ulanicki B. Modelling and simulation of short and long term membrane filtration experiments. Desalin Water Treat. 2009;8:37–47.
- Patil DS, Kennedy Oubagaranadi JU, Chavan SM. Studies on the removal of manganese from synthetic wastewaters by nanofiltration—a parametric and modeling study. Desalin Water Treat. 2017;88:93–105.
- Metzger U, Le-Clech P, Stuetz RM, et al. Characterisation of polymeric fouling in membrane bioreactors and the effect of different filtration modes, J. Membr Sci. 2007;301:180–189.
- Hwang BK, Lee WN, Park PK, et al. Effect of membrane fouling reducer on cake structure and membrane permeability in membrane bioreactor. J Membr Sci. 2007;288:149–156.
- Liang S, Liu C, Song L. Soluble microbial products in membrane bioreactor operation: behaviors, characteristics, and fouling potential. Water Res. 2007;41:95–101.
- Long TR, Luo TZ, Long XY, et al. Research on extraction of extra cellular polymeric substances from activated sludge by ultra sonic and cation resin. Water Wastewater Eng. 2008;34(5):34–37.
- Chang D, Tong PR, Gao ZY. Comparative study on sludge extracellular polymer and microorganism hydrophobic nature by A/O process. Ind Water Treat. 2014;34(2):62–64.
- Wu Q, Zhang Y, Zheng B, et al. Research on infiuence factors of membrane fouling in the A/O-MBR. J Anhui AgricSci. 2011;39(28):l7491—17493.
- Wang Y, Liu Yon J, Liu Z, et al. Influence of poly aluminium chloride dosing time on formation and EPS of aerobic granular sludge. Chem Ind Eng Prog. 2015;1(34):278–284.
- Wang JC, Sun BS. Relationship between extracellular polymeric substance and soluble microbial products. Environ Sci Technol. 2008;31(11):18–20.
- Gao ZY, Tong PR, Xu TT. Comparative study on extracellular polymeric substances of sludge under two working conditions in the A/O process. J Xi’an Polytech Univ. 2014;28(4):464–468.
- Iatspidou CS, Rittmann BE. Non-steady state modeling of extracellular polymeric substances,soluble microbial products, and active and inert biomass. Water Res. 2004;38(1):255–266.
- Wang QZ, Fang ZD, Long XY. Effects of SRT and DO on composition and distribution of microbial metabolites. Urban Environ Urban Ecol. 2012;25(6):1–4.
- Kimura K, Yamato N, Yamamura H, et al. Membrane fouling in pilot-scale membrane bioreactors (MBRs) treating municipal wastewater. Environ Sci Technol. 2005;39(16):6293–6299.
- Tian J, Mathias EC, Cuia F, et al. Correlations of relevant membrane foulants with UF membrane fouling in different waters. Water Res. 2013;47:1218–1228.
- Wei FS, Bi T, Qi W Q, et al. Method for monitoring and analyzing water and wastewater. Beijing (China): China Environmental Science Press; 2002.
- Lenore SC, Arnold EG, Andrew DE, et al. Standard methods for the examination of water and wastewater: including bottom sediments and sludges. New York: American Public Health Association; 1995.
- Murthy SN, Novak JT. Effects of potassium ion on sludge settling, dewatering and effluent properties. Water Sci Technol. 1998;37(425):317–324.
- Wang XM, Liu Y, Hua ZH, et al. Effect of extracellular polymeric substances in SMBR on membrane filtration. Acta Sci Circumstantiae. 2005;25(12):1602–1607.
- Yu JY, Jiang Y, Wang SL. Biochemical experiment technology. Beijing (China): Chemical Industry Press; 2005. p. 137—138, 175—177, 243—244.
- Liu Q, Wang XC. Membrane fouling control mechanism of a hybrid membrane bioreactor. Environ Sci Technol. 2012;35(7):12–15.
- Helmer C, Kunst S, Juretschko S, et al. Nitrogen loss in a nitrifying biofilm system. Water Sci Technol. 1999;39(7):13–21.
- Pochanna K, Kella J, Lant P. Model development for simultaneous nitrification and denitrification. Water Sci Technol. 1999;39(1):235–243.
- Ali A, Khan SJ, Pillay L, et al. Optimization of filtration to relaxation mode using woven fiber microfiltration system for water and wastewater treatment. Desalin Water Treat. 2017;96:69–75.
- Kornboonraksa T, Lee SH. Factors affecting the performance of membrane bioreactor for piggery wastewater treatment. Bioresour Technol. 2009;100:2926–2932.
- Germain E, Stephenson T. Biomass characteristics, aeration and oxygen transfer in membrane bioreactors: their interrelations explained by a review of aerobic biological process. Rev Environ Sci Biotechnol. 4:223–233.