
 ?Mathematical formulae have been encoded as MathML and are displayed in this HTML version using MathJax in order to improve their display. Uncheck the box to turn MathJax off. This feature requires Javascript. Click on a formula to zoom.
ABSTRACT
Plant functional traits reflect the responses and adaptations of plants to their immediate environment. In this study, 10 different sources of the Houttuynia cordata population in Anhui Province, China, were examined in terms of their leaf responses and adaptive mechanisms towards soil characteristics. Our study observed the leaf weight ratio depicted a significant negative correlation with leaf potassium content (r=-0.652, P < 0.05) and an extremely significant negative correlation with leaf saturated water content (r=-0.720, P < 0.01) in different H. cordata populations. The leaf mass per area, leaf weight ratio, leaf nitrogen content, leaf potassium content, and leaf saturated water content in H. cordatas showed a significant correlation with soil available phosphorus, available potassium, soil total porosity, soil volume weight, and pH. Lastly, a significant relationship between leaf potassium content in plants and soil volume weight was observed (R2=0.448, P < 0.01).
Plants have an intimate relationship with their habitat and environmental changes greatly affect plant functional traits, geographical distribution, community composition, and even ecosystem functions. During plant–environment interactions, changes in plant internal structure and external morphology results in co-evolution of different functions. This results in responses to external environmental changes and a generation of a series of plant traits that act on the ecosystem [Citation1,Citation2]. These traits are known as plant functional traits and are typically measurable. These traits are intimately associated with plant life processes such as growth, reproduction, and death [Citation3]. These traits can reflect the capabilities of plants in resource acquisition, utilization, and storage, and can strongly affect ecosystem processes [Citation4]. Hence, these traits are indicators of the mutual relationship between plants and the environment. For a long time, plant response and adaptive strategies towards the environment have been a focus of ecological research. Through self-adaptation, regulation and changing certain functional traits in response to environmental changes, plants form different growth, reproduction, defense, and other survival strategies. Therefore, studying the relationship between plant functional traits and the environment can better reveal their response characteristics and adaptation patterns towards the environment, the intrinsic relationship between plant traits and spatial heterogeneity towards the environment, and the results of adaptive evolution towards environmental changes [Citation5]. Among plant functional traits, leaf functional traits are most intimately associated with plant growth and reproduction [Citation6]. These traits can reflect the growth, metabolism, and development of plants, as well as reveal plant adaptive strategies in response to environmental changes [Citation7,Citation8]. Leaf area can be used to characterize the photosynthetic capacity of leaves, whereas leaf nitrogen levels directly determine the magnitude of plant photosynthetic capacity [Citation9]. The size of leaf surface stomata and stomatal density control evapotranspiration and gaseous exchange between plants and the environment, and directly affect photosynthesis and transpiration in plants [Citation10].
Ecologists have always been enthusiastic in studying the responses of plant functional traits to environmental changes. Examples include an increase in leaf area, leaf nitrogen, and phosphorus content with greater precipitation and a decrease in these traits with increasing air temperature [Citation11,Citation12]. Spatial heterogeneity due to varying terrain results in the redistribution of temperature and precipitation, which in turn affect soil temperature and soil moisture content, thereby changing plant functional traits [Citation13]. Altitude and concavity are key terrain factors that affect plant functional traits in subtropical evergreen broad-leaf forests, and soil moisture content and nitrogen content are major soil factors that influence spatial variability in plant functional traits. Theoretically, soil moisture content is mainly determined by the canopy area, transmittance, litter quantity, and soil porosity [Citation14,Citation15]. However, research studies on the responses of plant functional traits to changes in soil characteristics are limited. In an ecosystem, reports on the plant functional trait responses of a population to adapt to soil characteristics are scarce.
Houttuynia cordata, also known as fish mint, is an herbaceous perennial plant belonging to the genus Houttuynia and family Saururaceae. The entire herb can be used as a medicine, and its young leaves and rhizomes can be used as vegetables. This plant prefers moist and dark environments and is located on ubac slopes, field ridges, ditches, beside streams, wetland bushes, and forests. In China, H. cordata communities are located in the Yangtze River basin, Huai River basin, northwest China, northern China, and Tibet [Citation16]. These plants reproduce and use their developed rhizomes to expand their territory and change their internal physiological levels to adapt to various environments [Citation17–Citation20]. In this study, we studied leaf functional traits and changes in soil physical and chemical properties of different H. cordatas populations in Anhui Province to examine the relationship between leaf functional traits of H. cordatas and soil characteristics. Understanding the response mechanisms of leaf functional traits to changes in soil characteristics has ecological significance.
1. Materials and methods
1.1. Overview of the study area
We chose Yaoluoping National Nature Reserve and Hongwu Village as the sampling sites. These two areas represent two kinds of topographic conditions in Anqing area of Anhui Province (Dabie Mountain area and the plain hilly area along the Yangtze River), which are representative topography of Anhui Province. And the Houttuynia cordata is widely distributed in these two areas.
The Yaoluoping National Nature Reserve is located in northwest Yuexi County of Anhui Province (N30°40′–31°06′, E116°03′–116°33′). The main peak, Duozhijian, has the highest elevation (1,721.5 m asl), while Liyuwei has the lowest altitude (500 m asl). The climate of this nature reserve is considered subtropical monsoon. The region has zonal soil types: hilly yellow brown soil at altitudes below 800 m and hilly yellow brown soil and hilly meadow soil at altitudes above 800 m. The plants in the Yaoluoping Nature Reserve have an ancient origin with many endemic species and rich plant biodiversity. The zonal vegetation consists of mixed deciduous and evergreen broad-leaf forests. The Hongwu Village, Mamiao Town, Huaining County, Anhui Province, lies at the intersection of three county-level cities (Tongcheng, Huaining, and Qianshan). This village is located on the plains and low hills at the lower and middle reaches of the Yangtze River. The terrain is steep on the southwest and relatively flat to the northeast. The climate is subtropical humid monsoon; therefore, it is mild, has distinct seasons, and rainfall and high temperatures often occur simultaneously, with moderate precipitation and abundant sunshine. The soil consists mainly of red soil with high leaching characteristics. The soil parent material consists mainly of granite, syenite, shale, and quaternary-red clay.
1.2. Field survey and sampling
In June 2017, field survey and soil sampling were conducted at the H. cordatas habitats in Yaoluoping Nature Reserve (sample plots 1–6) in Anhui Province and Hongwu Village, Mamiao Town, Huaining County (sample plots 7–10). Three 1 m × 1 m quadrats were randomly selected in each of the 10 sample plots and were divided into 20 cm × 20 cm small quadrats. shows the environmental information for the study site.
Table 1. Environmental information of the study site.
1.3. Soil survey and sample analysis
Sampling was conducted in standard sample plots. Three sampling points were randomly selected within each quadrat, and 100 cm3 cutting rings were used to collect samples at the 0–10 and 10–20 cm soil layers. These samples were used to measure soil porosity (STP), soil volume weight (SVW), and soil moisture content (SMC). At the same time, five soil samples were collected in an ‘S’ shape. Subsequently, 1 kg of mixed soil samples was collected, and plant roots and rocks were removed. The soil samples were transported back to the laboratory, air-dried, and crushed. After passing through 1-mm and 0.25-mm sieves, the chemical characteristics of the soil samples were measured.
The cutting ring method was used to measure SVW, and total porosity was obtained by calculating the SVW and soil specific gravity (SSG). The soil specific gravity (SSG) was determined by specific gravity bottle method. Briefly, the following equations were also used: , g means the weight of dried soil; g1 means the weight of specific gravity bottle and water at t℃; g2 represents the weight of specific gravity bottle, water and soil sample at t℃; and dwt represents the specific gravity of distilled water at t ℃ [Citation21]. Soil organic carbon (SOC) was measured using the potassium dichromate solution heating method, available nitrogen (SNC) was measured using the Kjeldahl method, available phosphorus (SPC) was measured using molybdenum-antimony colorimetry, and soil available potassium (SKC) was measured using flame photometry [Citation21,Citation22].
1.4. Plants sampling and analysis
Three 1 m × 1 m quadrats were selected in each sample plot, and the adjacent lattice method was employed. The species name and the quantity of plants were recorded, and entire H. cordatas were harvested. The fresh mass of the entire plant and leaves was measured. A Jindongmei scanner (grayscale mode, resolution: 300 dpi) was used to measure and calculate leaf area (LA). The ratio of the total leaf area of the H. cordatas and the number of leaves in a sample plot is the mean LA (cm2). Four to five leaves were randomly selected from each sample, and a Vernier caliper (accuracy: 0.01 mm) was used for measurement. Five leaves were measured each time in triplicate. The mean value is the mean leaf thickness (LT).
Four epidermis tissues (4–10 mm2) were selected from each leaf and fixed with fixation solution. The leaves were transported back to the laboratory for sectioning and observed using an Olympus CX22 (400×) optical microscope. A digital microscope interactive platform was used to acquire images (image processing software: MIE2.0), and the number of stomata was calculated. This was divided by the area of the selected region to obtain the mean stomatal density (number/mm2). Stomatal density (SD, num/mm2) was computed as follows: SD = number of stomata/area in field (A). The samples were transported back to the laboratory and fixed at 105°C for 10 min and then dried to a constant weight at 50°C. The dry weights of the entire plant and leaves were obtained.
An electronic balance (accuracy: 0.0001 g) was used to measure the leaf water-saturated fresh mass (g) of the samples. After drying at 60°C to a constant weight, the leaf dry weight (g) was measured and used to calculate saturated water content (LWC). The following equations were also used:
Dried leaf samples were crushed and passed through a 100-micron sieve before use. Leaf nitrogen, potassium, and phosphorus content (LNC, LPC, and LKC, respectively) were measured using the same methods employed for soil measurements [Citation21,Citation22].
1.5. Statistical analyses
Excel 2003, SPSS 19.0, and R 2.13.1 were used for statistical analysis of the data. One-way ANOVA and LSD multiple comparison were used for the analysis of soil markers and leaf functional traits in different sample plots. Pearson correlation analysis, principal component analysis (PCA), and stepwise regression analysis were used to analyze the correlation between soil factors and leaf functional traits, and PCA sorting of soil factors and leaf functional traits was performed. The data in the figures and tables were presented as the mean ± standard error.
2. Results and analysis
2.1. Soil physical characteristics of Houttuynia cordata habitats
shows that there are significant differences in soil moisture content among different H. cordatas habitats (P < 0.05). Among these habitats, soil moisture content was the lowest for Maoerlong sample plot 2 and the highest for Hongwu sample plot 8. SVW intuitively reveals the degree of soil compaction and reflects the resistance of moisture, air, heat, and root extension. SVW affects SSG and STP. There were significant differences in the SVWs of different H. cordatas habitats (P < 0.05), of which the SVWs of sample plots 2, 3, and 7 were moderate (1.0–1.25 g/cm3) and demonstrate typical SVW characteristics. Overall, the SVW of the H. cordatas habitats in Hongwu was large. An example is sample plot 8, which had the highest SVW with the least variation (1.45–1.55 g/cm3). Sample plots 9 and 10 also exhibited little variation (1.25–1.35 g/cm3). On the other hand, the SVW of H. cordatas habitats in Yaoluoping were generally lower. Among these sample plots, the SVWs of sample plots 1, 4, 5, and 6 were less compact (<1.0 g/cm3). This shows that the understory environment is good and the degree of soil arability is high.
Figure 1. Differences in soil physical characteristics in different Houttuynia cordata populations.
SSG refers to the mass of solid particles per unit volume of soil and is mainly determined by the mineral composition and the relative organic matter content of the soil. The SSGs of different H. cordatas habitats were relatively higher (2.51–2.84 g/cm3). Among these sample plots, 2, 7, 8, and 9 have relatively higher SSGs and were significantly different from the other sample plots. This suggests that the degree of rainwater leaching in these sample plots is greater. Soil pores are channels formed when gaseous and liquid substances in soil migrate. The size, quantity, and spatial structure of soil pores determine the form and rate of material migration in soil, and STP is one of the important factors that are used to assess soil characteristics, such as soil water and air storage, and is one of the basic characteristics for assessing soil fertility. There were significant differences in STP between various H. cordatas habitats (P < 0.05). Among these sample plots, the STPs of sample plots 1, 2, 4, 5, 6, and 7 were higher than 60%, suggesting abundant soil water and air storage. The STP of sample plots 3 and 9 were 50–60%, whereas the STP of sample plots 8 and 10 were slight lower (45–50%). Overall, the STP of various Hongwu H. cordatas habitats was generally lower, of which sample plot 8 was the lowest. This shows that there is intense soil nutrient leaching and human interference.
2.2. Soil chemical characteristics of H. cordata habitats
shows that the soil pH levels of different H. cordata habitats were all lower than 6.5 and are therefore generally acidic. In addition, there are significant differences among sample plots (P < 0.05). Among these sample plots, sample plots 1, 2, 3, 6, 7, and 9 have slightly acidic soils (pH 5.5–6.5), and the soils of sample plots 4, 5, and 8 were acidic (pH 4.5–5.5). There were significant differences in the SKC among different sample plots (P < 0.05), which were all higher than 80 mg/kg. Soil in these plots was considered nutrient-rich, reaching levels of superior farmland (80–150 mg/kg, Grade 2) and above. Among these sample plots, the SKC of sample plots 5, 6, 8, and 10 were higher than 200 mg/kg (Grade 1), which belongs to the soil type with the highest potassium content. There were significant differences in SNC among different sample plots (P < 0.05) and SNCs showed variability. The SNC of sample plots 4, 5, and 6 were extremely high (>150 mg/kg), that of sample plots 1, 7, 8, and 10 were high (90–100 mg/kg), sample plot 9 was moderate (60–90 mg/kg), and soil in sample plots 2 and 3 were extremely low (<45 mg/kg). There were significant differences in SPC among different sample plots (P < 0.05), which were generally low. The SPC of sample plots 3, 4, and 6 was moderate (30–60 mg/kg), that of sample plots 1, 2, 5, 8, and 9 was lower (15–30 mg/kg), and sample plot 10 approached the lowest threshold for low soil grade. The SPC of sample plot 7 was extremely low (<15 mg/kg), a PSC value of only 5.662 mg/kg, which resulted in the highest nitrogen/phosphorus ratio (17.154). The SOC of different H. cordata habitats was generally higher, and the differences were significant (P < 0.05). Among all sample plots, sample plots 1, 7, and 10 had high SOC (3–4%), and sample plots 2, 3, 4, and 5 had moderate SOC (1–2%) levels. There were significant differences in the nitrogen/phosphorus ratios of different sample plots, and the differences were large.
Figure 2. Differences in soil chemical characteristics in different Houttuynia cordata populations.
2.3. Correlation analysis and principal component analysis of different soil factors in H. cordata habitats
shows that the SPC in H. cordata habitats exhibits a significant negative correlation with SOC and the nitrogen/phosphorus ratio (<0.05). SVW shows an extremely significant positive correlation with SSG (P < 0.01), but has an extremely significant negative correlation with STP (P < 0.01). SSG shows a significant negative correlation with STP (P < 0.05). In addition, SKC is negatively correlated with SPC and STP but positively correlated with SNC, SOC, the nitrogen/phosphorus ratio, SMC, and SVW. SNC is positively correlated with the nitrogen/phosphorus ratio and STP but negatively correlated with SSG and SVW. SPC is negatively correlated with SVW. SOC is positively correlated with the nitrogen/phosphorus ratio and SMC. SMC is positively correlated with SSG and SVW, but negatively correlated with STP, although this was not significant (P < 0.05).
Table 2. Pearson correlation coefficient matrix among leaf functional traits of Houttuynia cordata populations.
shows that the communality of SVW was the highest for all soil physical characteristics in Houttuynia cordata habitats, followed by STP and SSG. Comparatively, SMC was the lowest at 0.36. Based on the principle of eigenvalue >1, one principal component (eigenvalue = 0.295) was extracted. The contribution of this principal component was 73.8%.
Table 3. Soil physical characteristic initial factor loading matrix and principal component contribution.
The principal component formula was y = 0.35Zx1 + 0.57Zx2 + 0.5Zx3 − 0.55Zx4, of which y represents the principal component and Zx represents the standardized variable.
This shows that this principal component is the main cause of changes in soil physical characteristics. The initial factor loading matrix of the principal component () shows that SSG has a significant positive correlation with the principal component, whereas STP shows significant negative correlation with the principal component. Therefore, in addition to the principal component of SVW, SSG and STP can be used as major markers of soil physical characteristics.
shows that the commonality of SPC was the highest for the soil chemical characteristics of H. cordata habitats, reaching 0.92, followed by the nitrogen/phosphorus ratio. However, the commonality of SOC, SKC, and soil pH was low, at approximately 0.64, 0.65, and 0.70, respectively. Based on the principle of eigenvalue >1, two principal components (eigenvalues of 2.74 and 1.79) were extracted. The contributions of these principal components were 45.7% and 29.9%.
Table 4. Soil chemical characteristic initial factor loading matrix and principal component contribution, commonality, and eigenvectors.
The formula for the principal components was:
. In the equation, y1 represents principal component 1, y2 indicates principal component 2, and Zx is the standardized variable.
This shows that these two principal components are the main causes of changes in soil chemical characteristics. The initial factor loading matrix of the principal components () shows that SPC has a significant negative correlation with the first principal component, and the nitrogen/phosphorus ratio shows a significant positive correlation with the first principal component. SNC shows a significant positive correlation with the first principal component, while soil pH shows a significant negative correlation with the first principal component. PCA indicates that markers that show significant positive or negative correlations with the first principal component (i.e. SPC and nitrogen/phosphorus ratio) can be used as major markers for soil chemical characteristics, followed by SOC and SKC.
2.4. Leaf functional traits of different H. cordata populations and correlation analysis
shows that there are significant differences in LMA among H. cordata populations, with the LMA of H. cordata populations in Yaoluoping being higher than Hongwu. Sample plot 4 has the highest LMA, followed by sample plot 6, while sample plots 7, 9, and 10 have the lowest LMA. There were significant differences in LWR among different H. cordata populations, and the LWR of Yaoluoping H. cordata populations is also higher than the Hongwu populations. Sample plots 4–6 have the highest LWR, followed by sample plots 1 and 3, whereas sample plot 10 has the lowest LWR. There were significant differences in SD among different H.cordata populations; sample plots 4 and 6 have the highest SD, followed by sample plots 3 and 10, whereas sample plots 1 and 5 have the lowest SD. There were no significant differences in LNC between sample plots 1–3 and 6–10, but these were significantly higher than sample plot 5 that had the lowest LNC. There were significant differences in LPC among different H. cordata populations, with sample plot 9 having the highest LPC and sample plots 2 and 4 having the lowest LPC. There were no significant differences among sample plots. There were significant differences in LKC among different H. cordata populations, with sample plot 9 having the highest LKC and sample plot 5 having the lowest LKC. There were no significant differences in LKC among sample plots 1, 4, and 7–10. There were significant differences in leaf-saturated water content among the different H. cordata populations, with sample plots 5 and 7 showing the highest leaf-saturated water content, followed by sample plots 1, 2, 8, and 9, whereas sample plots 3, 4, and 6 had the lowest leaf-saturated water content. There were significant differences in LA among different H. cordata populations; sample plot 1 had the highest LA, which was significantly higher than sample plots 2–4, 6, and 10, and there was no significant difference with the other sample plots. There were significant differences in leaf thickness among the different H. cordata populations; sample plot 7 had the greatest leaf thickness and sample plot 2 had a slightly thinner leaf thickness. A significant decrease was observed in leaf thickness for sample plots 3 and 6, and another significant decrease was observed in sample plots 4, 8, and 9; however, these plots were significantly thicker than sample plots 1 and 5, and sample plot 10 had the thinnest leaves.
Figure 3. Differences in leaf functional traits in different Houttuynia cordata populations. Different letters mean significant differences at the 0.05 level.
shows that among different H. cordata populations, LMW has a significant positive correlation with LWR and SD, a significant negative correlation with LPC and LA, and an extremely significant negative correlation with leaf-saturated water content. LWR shows a significant negative correlation with LKC and an extremely significant negative correlation with leaf-saturated water content. SD has an extremely significant negative correlation with LA. LNC shows a significant positive correlation with LPC and LKC. LPC content has a significant positive correlation with LA.
Table 5. Pearson correlation coefficient matrix among leaf functional traits of Houttuynia cordata populations.
2.5. Correlation analysis of leaf functional traits and soil characteristics among different H. cordata populations
A correlation analysis of leaf functional diversity index and soil physiochemical characteristics was performed (). The results showed that the first axis explained 99.99% of the H. cordata leaf functional trait-soil characteristics relationship. SPC, SVW, STP, SKC, and SMC have a greater correlation with H. cordata leaf functional traits, followed by the correlations of SSG, soil pH, and SNC. SVW, SNC, SPC, and SKC were all positively correlated with the first axis, of which SNC has a close relationship with the first axis, while SMC, STP, and SSG were negatively correlated with the first axis. This shows that SNC is an important fertility marker for the functional trait of leaf growth in H. cordatas, whereas SPC is a key factor that affects the growth of leaf functional traits in H. cordatas. STP imparts a negative effect, suggesting that loose soil aids in the functional trait of leaf growth in H. cordatas. STP, SNC, and SPC were positively correlated with the second axis, whereas SOC, SMC, SVW, SSG, and SKC were negatively correlated with the second axis. Stepwise regression analysis of H. cordata leaf functional traits and soil factors indicated that there is an extremely significant positive correlation between LMA, SPC and SKC, and between STP and LWR. Moreover, an extremely significant negative correlation exists between SPC and leaf saturated water content in H. cordatas, and a significant negative correlation exists between SVW and LKC and between soil pH and LNC. Leaf functional traits, such as LWA, LWR, LNC, LKC, and leaf saturated water content have a significant correlation relationship with SPC, SKC, STP, SVW, and pH. Finally, there is a significant positive correlation between soil pH and LPC ().
Figure 4. RDA sequence for influencing factors of soil characteristics in different Houttuynia cordata populations.
(Note: SMC: soil moisture content; STP: soil total porosity; SVW: soil volume weight; SSG: soil specific gravity; SOC: soil organic carbon; SNC: soil available nitrogen; SPC: soil available phosphorus; SKC: soil available potassium).
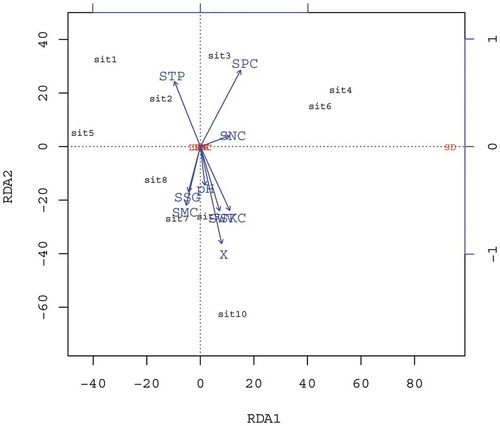
Table 6. Stepwise regression analysis on soil factors and leaf functional traits of Houttuynia cordata among different population.
3. Discussion
Plants and soil are environmental factors, and the succession of plant communities involves mutual interactions among plants, climate, and soil [Citation23]. The growth and development status of plants is determined by the plant’s own physiological characteristics, as well as various environmental factors. Environmental factors have indirect effects on plant growth because terrain properties affect plants through other ecological factors. In this study, we analyzed samples that significantly varied in SVW, STP, SMC, pH, and soil nutrients. The survey targets were mainly located in six regions: the understory with poor transmittance (1, 4), the understory with high transmittance (7, 8, 9, and 10), the edge of the forest (2), next to a cultivated field (3), adjacent to a water body (5), and at an adret slope (6). Sample plot 1 had the lowest transmittance, and sample plot 3 had the highest transmittance. The results of the study showed that SVW, SSG, SMC, and SOC were higher in the understory soil with high transmittance, whereas STP and SNC were lower. In this study, the Yaoluoping National Nature Reserve and Hongwu Village were chosen as the sampling sites. These two sites have a similar climate. Across all the samples, the change trends of soil volume weight (SVW), soil specific gravity (SSG) and soil moisture content (SMC) are generally similar in the two sites. Overall, the Hongwu H. cordata habitats in Mamiao Town, Anqing City, are located in transitional regions between low hills and plains, and the terrain is relatively flat. The soil contains more clay, has a strong water storage capacity, and therefore soil volume weight (SVW) and soil moisture content (SMC) are generally higher. However, the sample plots in Yaoluoping are located at high elevations, on steep gradients, and in regions with hilly yellow-brown soil that mainly consists of sand. The parent material mainly consists of granite and monzogranite. Therefore, SMC is generally lower. However, the measure soil porosity (STP) and available phosphorus (SPC) are higher in the Yaoluoping site. It indicates that there are significantly chemical difference between the hilly clay and sand soil, which further affect the distribution of plants. Despite the differences in soil nutrient content among locations, different plants maintain nutrient homeostasis in leaves through their own absorption and regulation mechanisms, which is a result of their adaptation to the environment [Citation24].
In recent years, changes in plant traits and their relationship with the environment have become one of the primary research topics in plant ecology. During the long evolutionary and developmental process, plants interact with the environment and gradually form morphological and physiological structures that adapt to changes in the external environment. These structures are mainly manifested as differences in leaves, root systems, seeds, and other plant traits. Plant traits that can respond to environmental changes are known as plant functional traits [Citation2,Citation25]. Leaf functional traits are one of the most important characteristics of plants and are widely used in plant functional trait research [Citation26]. Leaf functional traits are intimately associated with plant growth strategies and resource utilization abilities, and demonstrate the survival strategy of plants to obtain a maximum carbon harvest. LA is associated with the relative growth rate, photosynthetic rate, and LNC of plants, and can be used to reflect the carbon acquisition strategies of plants. LA has important effects on the relative growth rate of plants and is the best indicator for the trade-off of physiological processes [Citation27]. Plants with larger LA have a larger area to acquire resources, and therefore have a higher net photosynthetic rate [Citation28]. However, plants with low LA can better adapt to resource-poor and arid environments [Citation29]. In this study, we observed higher specific leaf area in sample plot 1, which had the lowest transmittance, whereas LWR, LNC, LPC, and LKC were maintained at high levels. In sample plots with low transmittance (7, 8, 9, and 10), the specific leaf area, LNC, LPC, LKC, and leaf-saturated water content in H. cordata were relatively high. Studies have shown that leaf functional traits are influenced by environmental heterogeneity [Citation30–Citation33]. Plants adjust their leaf morphology and chemical composition in response to environmental changes [Citation31]. Leaf thickness is an extremely valuable trait and is associated with resource acquisition, water storage and assimilation. In this study, we found that when SMC is low and transmittance is high, such as at the edge of forests (2), the edge of cultivated fields (3), and on adret slopes (6), the leaf thickness and specific leaf area of H. cordata are higher. An increase in leaf thickness or density helps to increase the distance or resistance of dispersion of internal moisture on the leaf surface, thereby decreasing internal moisture loss. However, leaf thickness is negatively correlated with specific leaf area and leaf-saturated water content, which agrees with the findings of Liu et al. [Citation31]. In this study, we also found the leaf nitrogen, potassium, and phosphorus content (LNC, LPC, and LKC, respectively) were higher in Hongwu Village site, the results were consistent with leaf area (LA) and leaf-saturated water content (LSWC). The H. cordata is a typical medicine and edible homologous, which has been used for the treatment of human immunodeficiency virus, influenza virus, herpes simplex virus, and chronic sinusitis and nasal polyps [Citation34]. Our previous study showed the moderate light and enough water could change the physiological property and biomass of H. cordata, which increased the contents of total flavonoids, vitamin C and protein in the leaves, but lowered light and increased water quantity could reduce the content of crude fiber in the leaves [Citation20,Citation35]. The chemical constituent of H. cordata were closely correlated with leaf functional traits. And the correlation analysis between the two factors need to be further studied. Changes in leaf functional traits in H. cordata in different habitats may be due to the plant’s sensitivity to the environment. Plants adjust their leaf morphology and chemical composition in response to environmental changes, resulting in differences in resource utilization efficiency. This also shows that H. cordata have stronger leaf morphology plasticity to respond to changes in the geographical environment.
Soil nutrient content determines the resource utilization strategies of plants and shapes the phenotype of community functional traits that affect plants on different slopes [Citation36]. This can also cause changes in plants by affecting traits within species. In this study, leaf functional traits, such as LWA, LWR, LNC, LKC, and leaf-saturated water content were significantly correlated with SPC, SKC, STP, SVW, and soil pH. Pan et al. [Citation36] studied the leaf functional traits of plants in the Karst hills of Guilin. Their results showed that the specific leaf area of plants on an ubac slope was significantly correlated with SNC. The results of this study showed that SPC and SKC significantly affected the LMA of H. cordata. This may be because available phosphorus and potassium are the most important active states in soil and can be directly absorbed and utilized by plants. At the same time, phosphorus and potassium are activators of many enzymes in plants, and phosphorus and potassium absorbed from soil can promote photosynthesis and protein synthesis in plants, thereby increasing the LMW of plants. Soil pH was found to be positively correlated with LPC. This may be because the form of phosphorus that exists in the soil is greatly affected by pH, which agrees with the conclusion of Chen et al. [Citation37] who studied the interactions between soil pH and phosphorus content. This study also observed a significant relationship between LKC and SVW, showing that plant elemental nutrient absorption is affected by different soil types, resulting in variations in plant functional traits. Therefore, leaf functional traits of the same plant species are controlled by variations in environmental factors in different environments. At the same time, these functional traits adapt to the surrounding habitat.
4. Conclusions
Plant functional traits reflect the responses and adaptations of plants to their immediate environment and environmental factors have indirect effects on plant growth. In this study, we found there were significant differences in LMA, LWR, SD, LPC, LKC, LA, leaf-saturated water content and leaf thickness among different H. cordata populations. The SPC, SVW, STP, SKC, and SMC have a greater correlation with H. cordata leaf functional traits. The STP depicted a significant negative correlation with functional trait of leaf growth in H. cordatas. Meanwhile, our result showed that SNC is an important fertility marker for the functional trait of leaf growth in H. cordatas, whereas SPC was a key factor that affects the growth of leaf functional traits in H. cordatas.
Acknowledgments
We thank Key projects of Natural Science Research in colleges and Universities of Anhui Province for providing the funds [Grant no. KJ2018A0531].
Disclosure statement
No potential conflict of interest was reported by the authors.
Additional information
Funding
References
- Díaz S, Cabido M. Vive la difference: plant functional diversity matters to ecosystem processes. Trends Ecol Evol. 2001;16:646–655.
- Violle C, Navas ML, Vile D, et al. Let the concept of trait be functional. Oikos. 2007;116(5):882–892.
- Meng TT, Ni J, Wang GH. Plant functional traits, environments and ecosystem functioning. J Plant Ecol (Chinese Version). 2007;31(1):150–165.
- Chao L, Zhao GD, Shi ZM, et al. The leaf functional traits and their correlation analysis of three seedlings of magnoliaceae. Acta Agriculturae Universitatis Jiangxiensis. 2016;38(1):19–26.
- Qi DH, Wen ZM, Yang SS, et al. Trait-based responses and adaptation of Artemisia sacrorum to environmental changes. Chin J Appl Ecol. 2015;26(7):1921–1927.
- Bao L, Liu YH. Comparison of leaf functional traits in different forest communities in Mt. Dong Ling of Beijing. Acta Ecologica Sinica. 2009;29(7):3692–3703.
- Chen HJ, Lin H, Hong W, et al. Leaf functional characteristics in different strains of Prunus campanulata. J Trop Subtropical Bot. 2015;23(2):191–196.
- Luo L, Shen GZ, Xie ZQ, et al. Leaf functional traits of four typical forests along the altitudinal gradients in Mt.Shennongjia. Acta Ecologica Sinica. 2011;31(21):6420–6428.
- Ding M, Wen ZM, Zheng Y. Scale change and dependence of plant functional traits in hilly areas of the loess region, Shaanxi Province, China. Acta Ecologica Sinica. 2014;34(9):2308–2315.
- Wang SG, Li ZQ, Jia SS, et al. Relationships of wheat leaf stomatal traits with wheat yield and drought-resistance. Chin J Appl Ecol. 2013;24(6):1609–1614.
- Reich PB, Ellsworth DS, Walters MB, et al. Generality of leaf trait relationships: a test across six biomes. Ecology. 1999;80(6):1955–1969.
- Wright IJ, Reich PB, Westoby M. Strategy shifts in leaf physiology, structure and nutrient content between species of high and low rainfall and high and low nutrient habitats. Funct Ecol. 2001;15(4):423–434.
- Reich PB, Oleksyn J. Global patterns of plant leaf N and P in relation to temperature and latitude. Proc Natl Acad Sci USA. 2004;101(30):11001–11006.
- McIntyre S, Díaz S, Lavorel S, et al. Plant functional types and disturbance dynamics–introduction. J Veg Sci. 1999;10(5):603–608.
- Quested H, Eriksson O, Fortunel C, et al. Plant traits relate to whole‐community litter quality and decomposition following land use change. Funct Ecol. 2007;21(6):1016–1026.
- Wang XP, Ye MR, Zhang XP, et al. Physiological adaptation of Houttuynia cordata to substrate moisture change under shading condition. Wetland Sci. 2016;14(3):446–450.
- Wang XP, Ye MR, Wang AZ, et al. Moistur gradient affect the growth and physiological characters of Houttuynia cordata. Guangxi Plant. 2012;32(1):107–112.
- Wang XP, Ye MR, Wang SH, et al. Effect of moisture gradient on growth and antioxidase activity of Houttuynia cordata. J Northeast For Univ. 2011;39(11):50–52.
- Wang XP, Wang SH, Ye MR, et al. Response of Houttuynia cordata to moisture gradient in shading. Chin J Trop Crops. 2012;33(7):1267–1271.
- Wang XP, Ge YF, Wu DD, et al. a study on the physiological adaptation of Houttuynia cordata to different moisture conditions. J Chuzhou Univ. 2016;18(2):66–69.
- Bao SD. Soil and agricultural chemistry analysis. 2nd ed. Beijing: Agriculture Publication; 2000. p. 25.
- Pansu M, Gautheyrou J. Handbook of soil analysis: mineralogical, organic and inorganic methods. Berlin: Springer; 2006.
- West DC, Herman HS, Botkin DF. Forest succession: concepts and application. Berlin: Springer Science & Business Media; 2012.
- Liu MX, Ma JZ. Responses of plant functional traits and soil factors to slope aspect in alpine meadow of South Gansu, Northwest China. Chin J Appl Ecol. 2012;23(12):3295–3300.
- Cornelissen JHC, Lavorel S, Garnier E, et al. A handbook of protocols for standardised and easy measurement of plant functional traits worldwide. Aust J Bot. 2003;51(4):335–380.
- Taylor SH, Franks PJ, Hulme SP, et al. Photosynthetic pathway and ecological adaptation explain stomatal trait diversity amongst grasses. New Phytol. 2012;193(2):387–396.
- Donovan LA, Maherali H, Caruso CM, et al. The evolution of the worldwide leaf economics spectrum. Trends Ecol Evol. 2011;26(2):88–95.
- Zhang L, Wen ZM, Miao LP. Source of variation of plant functional traits in the Yanhe river watershed: the influence of environment and phylogenetic background. Acta Ecologica Sinica. 2013;33(20):6543–6552.
- Liu JH, Zeng DH, Don KL. Leaf traits and their interrelationships of main plant species in southeast Horqin sandy land. Chin J Ecol. 2006;25(8):921–925.
- Reich PB. The world‐wide ‘fast–slow’plant economics spectrum: a traits manifesto. J Ecol. 2014;102(2):275–301.
- Roa F, Templer PH, Campo J. Effects of precipitation regime and soil nitrogen on leaf traits in seasonally dry tropical forests of the Yucatan Peninsula, Mexico. Oecologia. 2015;179(2):585–597.
- Maire V, Wright IJ, Prentice IC, et al. Global effects of soil and climate on leaf photosynthetic traits and rates. Global Ecol Biogeogr. 2015;24(6):706–717.
- Campo J, Gallardo JF, Hernández G. Leaf and litter nitrogen and phosphorus in three forests with low P supply. Eur J Forest Res. 2014;133(1):121–129.
- Chou SC, Su CR, Ku YC, et al. The constituents and their bioactivities of Houttuynia cordata. Chem Pharm Bull. 2009;57(11):1227–1230.
- Ma CC, Wang XP, Liu W. The effects of illumination, moisture and fertilization on total flavonoids and nutrients in leaves of Houttuynia cordata. J Anhui Sci Technol Univ. 2017;31(4):34–38.
- Pan YF, Chen XB, Jiang Y, et al. Changes in leaf functional traits and soil environmental factors in response to slope gradient in Karst hills of Guilin. Acta Ecologica Sinica. 2018;38(5):1581–1589.
- Chen CF, Qin L, Duan YX, et al. Effects of different management models on leaf functional traits and soil physical and chemical properties of natural secondary forest of Quercus mongolical. Acta Ecologica Sinica. 2018;38(23):8371–8382.