
 ?Mathematical formulae have been encoded as MathML and are displayed in this HTML version using MathJax in order to improve their display. Uncheck the box to turn MathJax off. This feature requires Javascript. Click on a formula to zoom.
ABSTRACT
Surficial sediment samples along the coastal area of the province Thai Binh in Vietnam have been collected and analysed by modified Tessier method for the mercury content. The mercury levels in these samples were found in the range between 0.12–3.79 mg/kg. Elevated concentrations were observed in some locations close to tidal marshes, large aquaculture productions or low-lying areas. The highest level of mercury was detected in a low-lying terrain near large aquaculture productions. The majority of the mercury species in all samples were witnessed in the fraction bound to organic matters. The predominance of this fraction is possibly associated with some misuses of mercurial fungicides by aqua farmers. These mercury species remain quite resistant in the sediments, thus posing a quite low risk for the surrounding ecological environment. Nevertheless, it is necessary to undertake further studies to evaluate the effect of this contamination on the food chain.
Introduction
Mercury is a toxic element which exists naturally in liquid or gas form. The toxicity of mercury is based on its strong affinity with the sulphur atom in the enzyme protein structures of living organisms [Citation1]. It gives rise to the interaction between mercury and enzyme proteins, which causes changes in the conformation of the enzymes [Citation2–4]. These changes result in the loss of the enzyme activity, thereby the cell metabolism is distorted. In human organisms, mercury can accumulate at a high amount in the kidney and brain, causing kidney failures, memory loss, numbness, physical tremors and neurological dysfunction, to name only a few [Citation5–9]. Severe mercury poisoning can lead to damaged motor skills and paralysis, a disease called Minamata [Citation10]. The treatments of mercury poisoning generally employ chelating medicals to extract the mercury from the organisms [Citation11–13].
Mercury can be released into the environment via natural sources such as volcano eruption and natural minerals as well as via anthropogenic sources such as industrial productions of gold, steels, non-ferrous metals and cement [Citation14–16]. In the past, another source of mercury pollution was from mercurial plant protecting products including pesticides, herbicides and fungicides [Citation14]. The use of these chemicals has been banned in many countries in the world. Nevertheless, in Vietnam, there is a rumour that some aqua farmers still employed mercurial fungicides for the sanitation of aqua ponds after each harvesting due to their potent effects compared to other fungicides.
Mercury bearing compounds can accumulate in and release from the sediments. The accumulation is driven by different processes including physicochemical adsorption, biological uptake of mercury species as well as sedimentation and physical attachment of mercury-enriched particles in the sediments. On the other hand, these mercury species are released back to the water body, when there are changes in environmental conditions, for example with regards to pH, redox potential, salinity and hydrology [Citation17–23]. The leach of mercury back to the water body poses a risk for the ecosystem because mercury species can accumulate in the animals of the ecosystem, such as fishes and oysters, which get into the food chain later [Citation24]. This risk is commonly evaluated based on the risk assessment code (RAC) value [Citation25–28]. Sediments are extracted with acid, oxidising and reducing agents sequentially, giving different fractions. The mercury levels in these fractions are quantified. The mercury species in the neutral- and acid-soluble portions have the highest potential to immobilise when there are changes in environmental conditions, accounting to the major risk of the contamination. The percentage of mercury levels in these fractions against the total mercury content of the sample was calculated as RAC value. If this value is less than 1%, the majority of the mercury species tend to stay in the sediments and thus the risk is categorised as safe. On the other hand, if this value is higher than 50%, the majority of the mercury species have high potential to release back to the water body, and the risk is categorised as very high.
In this study, 27 sediment samples of 0–10 cm depth along the coastal area of the province Thai Binh have been collected during April 2017. The samples were taken close to the locations aqua farmers discharged their sludge. This approach is the first part of a plan, which is aimed at scrutinising the impact of pesticide, herbicide and fungicide uses in aquaculture on the environment. The result of the mercury analysis of these samples might indicate possible misuses of mercurial chemicals for the sanitation of aqua ponds. The contamination was evaluated by the comparison with regulations standards, as well as by the method based on the RAC value. The fractionation of these samples was carried out following a modified Tessier procedure [Citation29–32]. Five fraction F1-F5 were obtained (Table S1). Among these fractions, fractions F1 and F2 are regarded as most vulnerable towards changes in environmental conditions, thus being applied for the calculation of the RAC value in the following equation [Citation25–28].
In the given equation, m(Fi) represents the amount of mercury in fraction Fi, while is equal to the total amount of mercury in the sample.
Experimental section
Chemicals and materials
Chemicals and solutions used in this study were obtained from Merck AG. The standard mercury solution has a concentration of 1000 ppm with a BCR-277 R certificate. NH2OH∙HCl, K2Cr2O7, NH4Cl and CH3COOH have a purity higher than 99.0%. (NaPO3)6 has a P2O5 basis content of more than 65%. The concentration of solutions obtained commercially were HF (48%), H2O2 (30%), HClO4 (70%) and HNO3 (65%). These chemicals and solutions were used to prepare corresponding solutions or used directly for the analysis without extra purification.
The digestion of samples was undertaken with a MARS 6TM. Mercury analysis was carried out using the autosampler Agilent G3160B coupled with the ICP-MS instrument Agilent 7900.
Determination of organic matter content and particle size distribution
The determination of organic matter (OM) content in sediments was carried out following the Walkley Black method reported in the literature [Citation33]. The analysis of particle size distribution of the deposits follows the previously reported process [Citation34,Citation35]. Prior to the analysis, 0.5 M sodium hexametaphosphate ((NaPO3)6) was added and treated ultrasonically.
Sample extraction by modified Tessier procedure
Step 1 – Isolation of labile and exchangeable mercury species: 1.0 g of the sample was added to 8.0 ml of 1 M ammonium acetate solution. The pH of the mixture was adjusted to 8.2. The mixture was shaken at room temperature for an hour before being added to the centrifuge. The clear solution F1 was treated with digesting equipment and subjected to ICP-MS analysis to determine the level of labile mercury species. The residue was washed and centrifugated with distilled water five times before being employed in step 2.
Step 2 – Isolation of carbonate mercury species: 8.0 ml of 1 M ammonium acetate solution was added to residue from step 1. The pH of the mixture was adjusted to 5.0 by adding acetic acid. The mixture was shaken for five hours at room temperature before being added to the centrifuge. The clear solution F2 was treated with digesting equipment before being subjected to ICP-MS analysis to determine the content of carbonate mercury species. The residue was washed and centrifugated with distilled water five times before being employed in step 3.
Step 3 – Isolation of mercury species binding to iron and manganese oxides and hydroxides: 2.78 g NH2OH∙HCl was dissolved in 1000 ml 25% CH3COOH solution. Thereafter, 20 ml of this solution was added to residue 2. The mixture was shaken at 95°C for 5 hours before being centrifugated to obtain fraction F3 and residue 3. The clear solution F3 was treated with digesting equipment before being further analysed by ICP-MS to determine the concentration of mercury. The residue was washed and centrifugated with distilled water five times before being employed in step 4.
Step 4 – Isolation of organic and metallic mercury species: 3.0 ml of 0.02 M HNO3 and 5.0 ml H2O2 solutions were mixed with the residue from step 3. Thereafter, the pH of the mixture was further finely adjusted by adding further 0.02 M HNO3 solution before the solution was shaken at 85°C for 3 hours. After that, the solution was allowed to cool down to room temperature before 5.0 ml of NH2OH∙HCl in CH3COOH solution (2.78 g NH2∙HCl being dissolved in 1000 ml 25% CH3COOH solution) was added. The solution was shaken for further 30 mins before being treated with the digesting equipment. After being centrifugate, residue 4 and clear solution F4 were obtained.
Step 5 – Isolation of mercury sulphides: Mixture of 40% HF and 70% HClO4 solutions (1:1) was added to residue 4. Then, the mixture was treated with the digesting equipment for 30 mins. Finally, residue 5 and clear solution F5 were obtained. The clear solution F5 was subjected to ICP-MS analysis to determine the concentration of mercury.
Sample collection
Samples were taken in 0–10 cm depth, being kept cool with dried ice during the transport to analytical laboratories. There, these samples were dried with a Labconco freeze dryer in nitrogen. After that, these were milled before being sieved. Finally, particles with sizes of less than 0.05 mm were retained.
Figure 1. Locations of taken samples
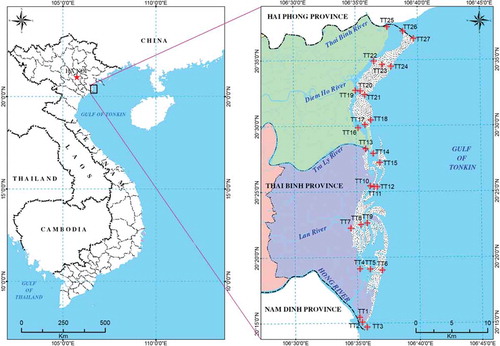
The samples were taken in different locations close to aquaculture productions (). The aquaculture production was highest in the village of TT1-TT3 and TT7-TT9. Detailed information regarding the aquaculture productions close to these locations is given in Table S2.
Result and discussion
Level of total mercury contamination
Figure 2. Level of mercury contamination in sampling locations compared with the Vietnamese maximal recommendation value (orange line)
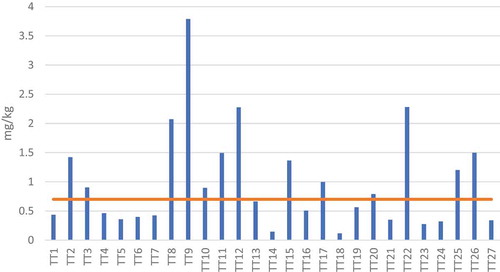
The levels of mercury contamination in sample locations are demonstrated in and given in Table S4. These levels ranged between 0.12 and 3.79 mg/kg with an average at 0.98 mg/kg. The highest level found at TT9 was more than five-fold more elevated than the Vietnamese regulation standard (0.7 mg/kg) [Citation36] and about 27-fold higher than the recommended value from the Canadian government (0.14 mg/kg) [Citation37]. The high level of mercury contamination at TT9 is possibly due to the large aquaculture production in this village (Table S2) where a potentially remarkable amount of mercurial fungicides might have been misused. TT8, another location in this village, also had high mercury contamination level (2.07 mg/kg), but, surprisingly, mercury level at TT7 was remarkably lower (0.42 mg/kg). In this study, we cannot fully explain why the contamination at TT7 was remarkably lower than TT8 and TT9, unfortunately. Still, we might speculate the reason why the level at TT9 was higher than at TT8. The tides and ebbs might have transported the polluted sediments from the higher-lying TT8 to lower-lying TT9 and enriched there [Citation38]. Furthermore, it was also surprising that TT1-TT3 are close to very high aquaculture productions, but the mercury pollutions in this area were remarkably lower than TT7-TT9. Probably, this is because TT7-TT9 are located next to the ocean, and as a result, this aquaculture sludge was directly diluted by the sea during tides and ebbs [Citation39]. Similarly, TT27 is located next to the ocean and has a remarkably lower mercury level than the onshore TT25-TT26. TT19-TT21 are close to the sea and had lower mercury contamination (0.35–0.79 mg/kg). On the other hand, it was observed that the mercury level increased from TT10 (0.90 mg/kg) to TT11 (1.49 mg/kg) and TT12 (2.28 mg/kg). Possibly, this is because the sediment transport of mercury pollution by the tide was stopped and mercury was enriched at TT12 due to the presence of sand dunes [Citation40]. Another factor which can influences the pollution distribution of mercury in the sediments are wetland systems. Wetland systems have been known to be capable of absorbing the mercury pollutants [Citation41–44]. Therefore, TT4-TT6 are close to wetland systems, and the mercury concentrations in TT4-TT6 were low. Mercury concentration in TT22 is notably higher than TT23-TT24 because TT22 is located very close to the disposal area of aquaculture sludge [Citation45]. The mercury level at TT14 was the lowest among all samples. We hypothesie that there is almost no source of mercury pollution at TT14.
The mercury levels in contaminated sites reported in the literature are given in Table S3. For example, the mercury level in the sediments close to the disaster site in Minamata was up to 700 mg/kg [Citation46]. In comparison, the mercury level close to a mercury mining area was found at 450 mg/kg [Citation47], while that level close to a Chlor-alkali plant was up to 350 mg/kg [Citation48]. Overall, the mercury contamination in this study is regarded as slight to moderate in 9 out of 27 sampling locations (TT2, TT8, TT9, TT11, TT12, TT15, TT22, TT25 and TT26). Differences in mercury contamination between several areas might be explained by the high aquaculture production nearby, sediment transport by tides and ebbs as well as absorption of pollutants by wetlands. The overall situation in this study is remarkably less severe than those reported about the contamination from industrial and mining sources.
Risk evaluation using RAC value
Next, the immobility of the mercury pollutants was examined by applying modified Tessier sequential extraction procedure and by calculating corresponding RAC values.
Figure 3. Percentages of five different mercury fractions in collected samples
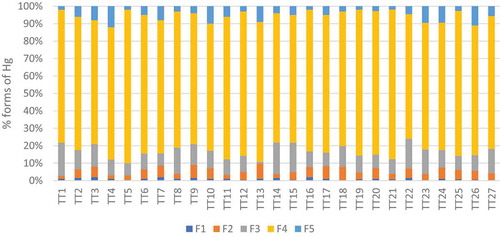
The amounts of mercury species in each fraction in all samples are depicted in and given in Table S4. As can be seen, all samples have similar fractionation profiles, with the highest proportion being organic matter-bound fraction F4. The similarity in the fractionation profiles indicates similar sources of contamination. The relative mean proportions of these fractions are given as follows F4 > F3 > F5 ≈ F2 > F1. The mercury levels in the fractions F1 and F2 are the lowest among F1-F5. The RAC values in all location are regarded as low, indicating that the majority of the mercury species are bound very stably in the sediments.
To get a more profound understanding about the overall risk of the contamination in this study, the relationship between the mercury concentration in these fractions and sediment characteristics were analysed by linear regression ( and Table S5). All fractions F1-F5 show good correlation coefficients between each other (R = 0.66–0.93). The correlation coefficients between F5 and F1-F4 (R = 0.66–0.76) are less than those between F1-F4 themselves (R = 0.84–0.93), possibly because fractions F1-F4 involve mainly anthropogenic mercury species while F5 includes extra geographically originating mercury species.
Table 1. Correlation coefficients of the linear regression between mercury and sediment parameters
An excellent positive correlation was observed between silts and clays (R = 0.94), while both of them perfectly correlated with sand in a negative manner (R = −0.97 and −0.99, respectively). Organic matters showed a relatively good positive correlation with clays and silts (R = 0.79 and 0.75, respectively) and relatively good negative correlation with sand (R = −0.77). There were these differences because clays and silts have a remarkably greater specific surface area, thus offering more binding sites to form coating layers with organic matters compared to sand. Organic matters in the water in the coastal area are generally long-chain molecules found in nature such as humic and fulvic acids, amino acids as well as hydroxycarboxylic acids [Citation49]. They were found to positively correlate with mercury level in other studies, where mercury species formed water-insoluble complexes with organic matters. However, in this study, we observed very little to nearly no correlation between organic matters with F1-F4. Only a slight positive correlation of organic matters was determined with F5 (R = 0.20). F5 also showed a slight positive correlation with clays and silts (R = 0.27 and 0.19, respectively) and a slight negative relationship with sand (R = −0.22). Furthermore, there was nearly no correlation between F1-F4 and clays, silts and sands, while there were slight correlations between F5 and clays, silts and sands (R = 0.27, 0.19 and −0.22, respectively). It confirms the hypothesis mentioned earlier that F5 involves extra mercury from the geographical origin, while F1-F4 are mostly from anthropogenic sources. The mercury species in F5 in this study were possibly protected by the organic matter coating layers from the biological degradation into species in F1-F4, which is the reason for the slight correlation between F5 and organic matters. Moreover, mercury species from anthropogenic sources already formed stable bonds with sediments before they were transported by water to further places. These mercury species did not immobilise to the organic matter layers, sands, clays and silts in the sediments of the new places, which is the reason why there was no correlation between mercury level in F1-F4 and organic matters, sands, clays and silts.
Next, we compared our results with the results from previous studies which are related to the predominant forms of mercury contamination. Organic matter-bound mercury species were dominant in the sediments close to an abandon pesticide plant in Changsha, Hunan, China [Citation50]. We suppose that this plant might have produced mercurial pesticides in the past. On the other hand, the contamination in soils close to mercury mine area was predominant as sulphide form [Citation51]. Meanwhile, the predominance of mercury pollution in the soils close to a coal-fired power plant was elemental form [Citation52,Citation53]. Mercury emitted from the coal-fired power plant is generally in the form of vapour mercury (Hg0), which is later absorbed into the sediments in the surrounding via wet and dry depositions. On the other hand, in a mercury contamination site close to a gold mining area in Mojana, Colombia, the predominant fraction was organic matter-bound mercury, and the mercury level correlated with the organic matters [Citation54].
The behaviour of mercurial fungicides in nature was investigated in previous studies [Citation55]. For instance, the volatile fungicide ethyl mercury acetate can be degraded to mercury in the sediment or can evaporate as undegraded into the air. On the other hand, the non-volatile fungicide phenylmercury acetate can be transformed by microorganism to the stable form diphenyl mercury, which is firmly bound in the sediments [Citation55]. However, the entire process was slow, and therefore most of the fungicides could be extracted back from the sediments.
For this reason, we hypothesie that the majority of mercury contamination in this study was from organomercury fungicides, which were degraded in a very slow process. These organomercury compounds were extracted in fraction F4, which was the dominant fraction among fractions F1-F5. Moreover, these compounds might have been degraded to mercury species in other fractions, which is the reason why a good correlation between it and other portions was observed.
Conclusion
To conclude, mercury contamination in the sediments along the coastal area of the province Thai Binh in Vietnam was preliminary studied. The pollution was possibly a result of some misuses of mercurial fungicides in this region, which were bound quite stable in the sediments. The contamination was further found to depend on the aquaculture production and sediment transport resulted by tides and ebbs, and on the height of the land. Although the risk evaluation in term of mobility possibility is regarded as low, the levels of contamination in several locations were above the Vietnamese regulation standard in 9 out of 27 sites. Therefore, it is necessary to carry out further studies to fully evaluate the risk of this contamination, for example about its effect on the food chain.
Supplemental Material
Download MS Word (29.4 KB)Acknowledgments
The grant from Vietnam Academy of Science and Technology (reference number VAST 06.01/17-18) is gratefully acknowledged. Authors also thank Dr. Judy Libra and M.Sc. Huyen Chau Dang at Leibniz Institute for Agricultural Engineering and Bioeconomy (ATB), Potsdam, Germany, for highly valuable advice and supports.
Disclosure statement
No potential conflict of interest was reported by the authors.
Supplementary material
Supplementary data for this article can be accessed here.
Additional information
Funding
References
- Clarkson TW, Magos L. The toxicology of mercury and its chemical compounds. Crit Rev Toxicol. 2006;36(8):609–662.
- Onyido I, Norris AR, Buncel E. Biomolecule-mercury interactions: modalities of DNA base-mercury binding mechanisms remediation strategies. Chem Rev. 2004;104(12):5911–5930.
- Weed R, Eber J, Rothstein A. Interaction of mercury with human erythrocytes. J Gen Physiol. 1962;45(3):395–410.
- Mata L, Sanchez L, Calvo M. Interaction of mercury with human and bovine milk proteins. Biosci Biotech Biochem. 1997;61(10):1641–1645.
- Zalups RK. Molecular interactions with mercury in the kidney. Pharmacol Rev. 2000;52(1):113–144.
- Cappelletti S, Piacentino D, Fineschi V, Frati P, D’Errico S, Aromatario M. Mercuric chloride poisoning: symptoms, analysis, therapies, and autoptic findings. A review of the literature. A review of the literature. Critical Reviews in Toxicology 2019;49(4): 329–341. doi:10.1080/10408444.2019.1621262
- Jackson AC. Chronic neurological disease due to methylmercury poisoning. Can J Neurol Sci. 2018;45(6):620–623.
- Goodman C. Mercury poisoning a review of present knowledge. Rev Sci Instrum. 1938;9(8):233–236.
- Chang LW. Neurotoxic effects of mercury-A review. Environ Res. 1977;14(3):329–373.
- Harada M. Minamata disease: methylmercury poisoning in Japan caused by environmental pollution. Crit Rev Toxicol. 1995;25(1):1–24.
- Cao Y, Skaug MA, Andersen O, Aaseth J. Chelation therapy in intoxications with mercury, lead and copper. Journal of Trace Elements in Medicine and Biology. 2015;31:188–192. doi:10.1016/j.jtemb.2014.04.010
- Kark RAP, Poskanzer DC, Bullock JD, et al. Mercury poisoning and its treatment with N-Acetyl-D,L-Penicillamine. N Engl J Med. 1971;285(1):10–16. .
- Friedheim E, Corvi C. Meso-dimercaptosuccinic acid, a chelating agent for the treatment of mercury poisoning. J Pharm Pharmacol. 1975;27(8):624–626.
- Li P, Feng XB, Qiu GL, et al. Mercury pollution in Asia: a review of the contaminated sites. J Hazard Mater. 2009;168(2–3):591–601. .
- Walters CR, Somerset VS, Leaner JJ, et al. A review of mercury pollution in South Africa: current status. J Environ Sci Heal A. 2011;46(10):1129–1137. .
- Jackson M, Hancock D, Schulz R, Talbot V, Williams D. Rock phosphate: The source of mercury pollution in a marine ecosystem at Albany, Western Australia. Marine Environmental Research. 1986;18(3):185–202. doi:10.1016/0141-1136(86)90032-2
- O’Connor D, Hou D, Ok YS, et al. Mercury speciation, transformation, and transportation in soils, atmospheric flux, and implications for risk management: A critical review. Environ Int. 2019;126:747–761.
- Kumar R, Rani M, Gupta H, Gupta B. Trace metal fractionation in water and sediments of an urban river stretch. Chemical Speciation & Bioavailability. 2014;26(4):200–209 doi:10.3184/095422914X14142369069568
- Baolin L, Wensi Z, Guanxi C. Distribution and risk assessment of heavy metals in sediment from Bohai Bay, China. Minerals. 2019;9(2):111.
- Mondal P, Schintu M, Marras B, Bettoschi A, Marrucci A, Sarkar SK, Chowdhury R, Jonathan MP, Biswas JK. Geochemical fractionation and risk assessment of trace elements in sediments from tide-dominated Hooghly (Ganges) River Estuary, India. Chemical Geology. 2020;532:119373. doi:10.1016/j.chemgeo.2019.119373
- Gruszecka-Kosowska A, Kicińska A. Long-term metal-content changes in soils on the Olkusz Zn–Pb Ore-Bearing Area, Poland. Int J Environ Res. 2017;11(3):359–376.
- Fitratian RA, Rumhayati B, Kurniawan A. The bioavailability and risk potential of copper and zinc of soil as an indicator heavy metals contamination in the aquatic system in sumber Nyolo, Karangploso, East Java. J Pure Appl Chem. 2019;8(1):13.
- Jiang Z, Xu N, Liu B, et al. Metal concentrations and risk assessment in water, sediment and economic fish species with various habitat preferences and trophic guilds from Lake Caizi, Southeast China. Ecotox Environ Safe. 2018;157:1–8.
- Costa F, Coelho JP, Baptista J, et al. Mercury accumulation in fish species along the Portuguese coast: are there potential risks to human health? Mar. Pollut Bull. 2020;150:110740.
- Wang Q, Liu R, Men C, et al. Spatial-temporal distribution and risk assessment of mercury in different fractions in surface sediments from the Yangtze River estuary. Mar Pollut Bull. 2017;124(1):488–495. .
- Leonard I, Sweet JTZ. Toxicology and Immuniotoxicology of mercury: a comprerative review in fish and humans. J Toxicol Env Heal B. 2001;4(2):161–205.
- Tang W, Shan B, Zhao Y, et al. Comprehensive analysis of mercury pollution in the surface riverine sediments in the Haihe Basin, China. Environ Sci Pollut Res. 2017;24(25):20794–20802. .
- Wei Z, Cao F, Yang L, et al. Distribution, fractionation and risk assessment of mercury in surficial sediments of Nansi Lake, China. Environ Geochem Health. 2018;40:115–125.
- Tessier A, Campbell PGC, Bisson M. Sequential extraction procedure for the speciation of particulate trace metals. Anal Chem. 1979;51(7):844–851.
- Orecchio S, Polizzotto G. Fractionation of mercury in sediments during draining of Augusta (Italy) coastal area by modified Tessier method. Microchem J. 2013;110:452–457.
- Giordano R, Musmeci L, Ciaralli L, et al. Total contents and sequential extractions of mercury, cadmium, and lead in coastal sediments. Marine Pollution Bulletin. 1992;24(7):350–357. .
- Ding ZH, Liu JL, Li LQ, et al. Distribution and speciation of mercury in surficial sediments from main mangrove wetlands in China. Mar Pollut Bull. 2009;58(9):1319–1325. .
- Gelman F, Binstock R, Halicz L. Application of the Walkley–Black titration for the organic carbon quantification in organic rich sedimentary rocks. Fuel. 2012;96:608–610.
- Zhang W, Yu L. Magnetic properties of tidal flat sediments of the Yangtze Estuary and its relationship with particle size. Sci China Earth Sci. 2003;46(9):954–966.
- Poizot E, Méar Y, Biscara L. Sediment trend analysis through the variation of granulometric parameters: A review of theories and applications. Earth-Sci Rev. 2008;86(1–4):15–41.
- Tran TAM, Malarvannan G, Hoang TL, Covaci A, Elskens M. Occurrence of organochlorine pesticides and polychlorinated biphenyls in sediment and fish in Cau Hai lagoon of Central Vietnam: human health risk assessment. Mar Pollut Bull. 2019;141:521–528.
- Gaudet C, Lingard S, Cureton P, Keenleyside K, Smith S, Raju G. Canadian environmental quality guidelines for mercury. Water Air Soil Pollut. 1995;80(1 1-4):1149–1159.. doi:10.1007/BF01189777
- Navarro P, Amouroux D, Thanh ND, et al. Fate and tidal transport of butyltin and mercury compounds in the waters of the tropical Bach Dang Estuary (Haiphong, Vietnam). Mar Pollut Bull. 2012;64(9):1789–1798. .
- Nelson CH, Pierce DE, Leong KW, et al. Mercury distribution in ancient and modern sediment of northeastern Bering Sea. Mar Geol. 1975;18(3):91–104. .
- Nicolai M, Cristian O. Mercury in coastal reclamation fills in southernmost Brazil: historical and environmental facets. J Coast Res. 2006;2006(226):1573–1576.
- García-Mercadoa HD, Fernándezb G, Garzón-Zúñigac MA, et al. Remediation of mercury-polluted soils using artificial wetlands. Int J Phytoremediat. 2017;19(1):3–13. .
- Kaplan DI, Knox AS, Myers J. Mercury Geochemistry in Wetland and its Implications for in situ remediation. J Environ Eng. 2002;128(8):723–732.
- St. Louis VL, Rudd JWM, Kelly CA, et al. Production and loss of methylmercury and loss of total mercury from boreal forest catchments containing different types of wetlands†. Environ Sci Technol. 1996;30(9):2719–2729. .
- St. Louis VL, Rudd JWM, Kelly CA, et al. Importance of wetlands as sources of methyl mercury to boreal forest ecosystems. Can J Fish Aquat Sci. 1994;51(5):1065–1076. .
- Pereira ME, Duarte AC, Millward GE, et al. Tidal export of particulate mercury from the most contaminated area of Aveiro’s Lagoon, Portugal. Sci Total Environ. 1998;213(1):157–163. .
- Fujiki M. The transitional condition of Minamata Bay and the neighbouring sea polluted by factory waste water containing mercury. In: 6th International Conference on Water Pollution Research. 1972.
- Berman M, Bartha R. Control of the methylation process in a mercury-polluted aquatic sediment. Environ Pollut Series B - Chem Phys. 1986;11(1):41–53.
- Skei JM. Serious mercury contamination of sediments in a Norwegian semi-enclosed bay. Mar Pollut Bull. 1978;9(7):191–193.
- Calace N, Cardellicchio N, Petronio B, Pietrantonio M, Pietroletti M, Sedimentary humic substances in the northern Adriatic sea (Mediterranean sea). Marine Environmental Research. 2006;61(1):40–58. doi:10.1016/j.marenvres.2005.05.002
- Dong H, Lin Z, Wan X, et al. Risk assessment for the mercury polluted site near a pesticide plant in Changsha, Hunan, China. Chemosphere. 2017;169:333–341.
- Fernández-Martínez R, Rucandio I. Total mercury, organic mercury and mercury fractionation in soil profiles from the Almadén mercury mine area. Environ Sci Process Impacts. 2014;16(2):333–340.
- Yuan CG, Wang TF, Song YF, Chang AL, Total mercury and sequentially extracted mercury fractions in soil near a coal-fired power plant. Fresenius Environ Bull. 2010; 19(12):2857–2863.
- Yuan C-G, Li Q-P, Feng Y-N, Chang A-L, Fractions and leaching characteristics of mercury in coal. Environ Monit Assess. 2010;167:581–586. 1–4 doi:10.1007/s10661-009-1074-7
- Pinedo-Hernández J, Marrugo-Negrete J, Díez S. Speciation and bioavailability of mercury in sediments impacted by gold mining in Colombia. Chemosphere. 2015;119:1289–1295.
- Kimura Y, Miller V. Fungicide decomposition, degradation of organomercury fungicides in soil. J Agric Food Chem. 1964;12(3):253–257.