
 ?Mathematical formulae have been encoded as MathML and are displayed in this HTML version using MathJax in order to improve their display. Uncheck the box to turn MathJax off. This feature requires Javascript. Click on a formula to zoom.
ABSTRACT
The present study, for the first time, evaluated the seasonal variation of PM10-associated bacterial and fungal concentrations at four locations (CARS premises, Doyel Chattar, Postogola, and Chittagong Road) in Dhaka, Bangladesh. In this study, PM10 samples were collected four times on 20.3 × 25.4 cm irradiated glass fibre filter from November 2018 to August 2019. The concentrations of total airborne bacteria (14,073 ± 8,897 CFU/m3) were found to be significantly higher (one-way ANOVA; p < 0.05) in Chittagong Road, which is known for traffic congestion, than that of the other locations. The total airborne bacterial concentrations occurred in the following descending order: winter>spring>summer>rainy. Bacillus spp. and Staphylococcus spp. were found to be the dominant species present in PM10 particles. Based on Pearson correlation analysis and stepwise multiple-regression analysis, relative humidity was found to be the most important variable controlling the concentrations of total airborne bacteria. Common fungi such as Aspergillus, Penicillium, Cladosporium and Fusarium genera were identified in the PM10 samples. The highest fungal concentration (1,974 ± 1,173 CFU/m3) was found at Chittagong Road. The total fungal spore concentrations occurred in the following descending order: summer>spring>winter>rainy. From correlation analysis and stepwise regression analysis, the temperature was found to be the most important variable influencing the concentrations of fungi in PM10 samples. A dose-rate estimation study revealed that the children were more vulnerable compared to adults with respect to exposure to bacterial and fungal dose rates. The present study has enormous implications considering the health hazards the bacterial and fungal communities pose to humans.
1. Introduction
Over the last two decades, south Asian countries have seen brisk economic growth. The concomitant developmental activities in these countries have given rise to excessive air pollutants that are posing hazardous conditions for the population residing in the region [Citation1,Citation2]. Particulate matters (PMs) have been identified as a major air pollutant in densely populated cities or urban areas [Citation3]. In the recent past, PMs have been given serious attention because of their potential detrimental impacts on public health. In humans, PMs can induce severe sickness or, in the worst case, even death [Citation3]. Depending on their size, different PMs may travel varied distances and affect different parts of the human body. For instance, PM2.5 (<2.5 μm) can remain suspended in the air for several weeks and be transported over great distances. These particles can penetrate and deposit deeper in the tracheobronchial and alveolar regions [Citation4]. Through the respiratory system, PM2.5 may eventually find its way to the blood circulatory system [Citation5]. The coarse fraction (PM2.5–10) is usually comprised of crystal materials and fugitive dust stemming from the resuspension of road dust and construction sites. Because of their larger sizes, they can easily deposit and thus travel for short distances. PM2.5–10 (<10 μm) deposit mainly in the head airways. The still coarser fraction, i.e. total suspended particles (TSP, <100 μm) trigger skin allergies.
Particulate matter is composed of solid particles and liquid droplets containing acids, organic chemicals, metals, soil, or dust [Citation6], and compounds of biological origin known as bioaerosol [Citation7]. In this decade, the occurrence of diseases due to airborne microorganisms or bioaerosols has substantially increased. Microorganisms, particularly bacteria and fungi, are common in soil, plants, and on surface water. They can be easily released into the air from these sources. In addition to bacteria and fungi , bioaerosols contain pollens
, viruses (<0.1 µm), and any fragments of plant and animal origin. Bioaerosol has been found to be linked with adverse health effects, including infectious diseases, acute toxic effects, allergies, and cancers [Citation8–14]. There are ~1.5 million fungi species on earth [Citation15,Citation16]. Only 80 individual genera are documented for their allergenic properties and accompanying respiratory tract disorders. The most observed fungi in ambient air are Cladosporium, Alternaria, Penicillium, Aspergillus, Mucor, Fusarium, Epicoccum, a variety of yeasts, smuts and rusts, and other basidiomycetes. Cladosporium, for example, persists for extended durations in the environment and is directly connected to human respiratory diseases [Citation17,Citation18]. Bacteria are also prevalent in the atmosphere. Common genera observed in outdoor air using culture methods include, e.g. Bacillus, Clavibacter, Corynebacterium, Curtobacterium, Micrococcus, Pseudomonas and Staphylococcus [Citation19–21].
To the best of our knowledge, no study has been conducted here in Bangladesh to assess the seasonal variation in bacterial and fungal concentrations. In the present study, particles with an aerodynamic diameter of less than <10 µm were investigated. Particles >5 µm exhibit significantly higher concentrations of microorganisms compared to the smaller ones [Citation22]. Given the high levels of air pollution in Dhaka, Bangladesh, the current study was aimed at investigating the occurrence of airborne bacteria and fungi attached to PM. The broader goal was to provide baseline information regarding the composition of PM-bound bioaerosols in Dhaka city, Bangladesh. The specific objectives were as follows: (1) to estimate the bacterial and fungal concentrations associated with PM10 particles present in the air at different locations in Dhaka city, Bangladesh, (2) to observe the seasonal variation in bacterial and fungal communities in the selected locations, and (3) to assess the vulnerability of different age-group vis-à-vis exposure to bacterial and fungal dose rates.
2. Materials and methods
2.1 Description of sampling site
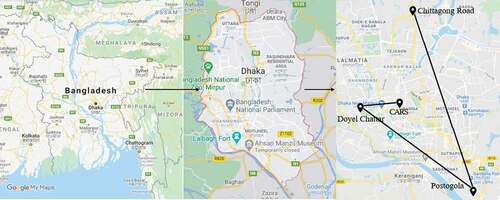
The samples for the present study were all collected from the capital city of Dhaka, Bangladesh. Dhaka is one of the most populated megacities in the world with about 20.2 million people residing within a 300-km2 area. The city is currently facing twofold challenges of high population and uncontrolled vehicular growth. The relentless pressure of urbanization has negatively affected the ambient air quality of Dhaka city. For many years, Dhaka [Citation23] and other cities in Bangladesh have been experiencing some of the highest PM concentrations among the world’s cities [Citation23]. In the present study, four different locations (), including the Center for Advanced Research in Sciences (CARS) premises, Doyel Chattar, Postogola, and Chittagong Road were selected for the measurement of the PM10 concentration. The locations selected include two roadside areas, one industrial area, and one university campus area with some vegetation coverage ( and ).
Table 1. Description of the sampling sites
Figure 1. Map of Dhaka city with the monitoring sites
2.2 Sample collection
Sampling was carried out four times at each monitoring site: winter of 2018 and 2019 (December – January), spring of 2019 (February – March), summer of 2019 (April – June), and the rainy season of 2019 (July – August). The duration of sampling was 24 h. A respirable dust sampler (TEI-RDSBL 108, Thermo Environmental Instruments) was used for the collection of ambient dust samples. The samples were collected at a constant flow rate of 1 m3/min. The concentration of PM10 was determined with the help of embedded cyclone separator technology. PM10 was collected on a 20.3 × 25.4 cm irradiated glass fibre filter. The filter was sterilized and stored in a sterile environment prior to sample collection. The outdoor sampler was kept on the curbside or ~1 m above the ground. The collected PM10 samples were then used for biological characterizations. The outdoor meteorological parameters, namely temperature (T) and relative humidity (RH), were obtained by using a radio-controlled weather station (TFA 35.1099.IT., TFA Dostmann, Wertheim, Germany).
2.3 Identification of airborne microorganisms
2.3.1 Determination of pH
A pH meter (BOECO, BT-600, Germany) was used to determine the pH of the collected particulate matter samples. The dust samples were dissolved in distilled water (1:9) and the pH values were then measured with a calibrated pH meter.
2.3.2 Microbiological analysis
After the samples were collected, the presence of airborne microorganisms was confirmed by various cultural, and biochemical analyses. Approximately 5 g of particles-laden filter paper was taken in a Stomacher® bag and dissolved with 45 mL of distilled water and then put in a stomacher machine (STOMACHER 400 CIRCULATOR). The stomached sample was then surface plated (0.1 mL) on different non-selective and selective microbiological culture media. The following day, the colonies which appeared were counted using a colony counter (BOECO, Germany COLONY COUNTER CC-1)and the number of total airborne bacteria (TAB) and total airborne fungi (TAF) were determined. For isolation and identification of coliforms and other Gram-positive and Gram-negative bacteria, the presumptive colonies were streaked on different media such as Chromocult agar for E. coli (Escherichia coli), Mannitol salt agar (MSA) for Staphylococcus spp., NaCl glycine Kim, and Goepfert (NGKG) agar for Bacillus spp., cetrimide agar for Pseudomonas spp., Xylose Lysine Deoxycholate (XLD) agar for Salmonella spp. The inoculated culture media were then incubated at 25/30/37°C for 18–24 h. Sabouraud Dextrose Agar (SDA) media was used for the maintenance and total counting of fungi.
For the isolation and identification of coliforms and other bacteria, cultural and biochemical properties, especially colony characteristics were investigated. Colony characteristics play a vital role in PM samples. On the basis of presumptive colony characteristics and Gram reaction, the bacterial species were presumptively confirmed. The presumptively identified Bacillus spp. and Staphylococcus spp. bacterial isolates were confirmed by API 50 CHB and API Staph (bioMérieux, USA), respectively (Figures S1 and S2). For the isolation and identification of coliform bacteria, API 20E (bioMérieux, USA) was employed. On the other hand, the identification of fungal spores was performed by examining their microscopic features.
Airborne bacterial and fungal concentrations (C, in CFU/m3) were calculated using EquationEq. (1)(1)
(1) .
where T is the sum of the number of bacterial or fungal colonies at all stages, t (min) is the sampling time, and F (L/min) is the airflow rate.
2.4 Dose rate estimation of airborne microbes
The United States Environmental Protection Agency’s model was used for the estimation of the dose rate of the bacterial and fungal components associated with PM10 (Eq. 2). The model was developed to assess the risks of environmental exposure for susceptible populations [Citation24,Citation25].
where C is the bacterial and fungal aerosol concentration (CFU/m3), InhR is the inhalation rate (m3/day), ET is the exposure time (h/day), and BW is the body weight (kg) (Table S1).
2.5 Statistical analyses
Data was analyzed by Microsoft Excel and Minitab Statistical software (version 19). The raw data were checked for normality and homoscedasticity prior to a parametric test. A one-way ANOVA followed by Tukey’s post-hoc test was performed to determine if there were any significant differences between the locations and seasons in terms of different tested parameters. Pearson correlation coefficients were determined between different parameters of interest. Additionally, stepwise multiple-regression analysis was performed to decipher the combined effects of different parameters. Significance was determined based on whether the p-values are <0.05 or not.
3. Results and discussions
3.1 Environmental parameters
Environmental parameters such as temperature (T) and relative humidity (RH) were recorded during PM10 sampling. The summary of environmental parameters recorded is given in . Significant differences were observed in temperature among the seasons (one-way ANOVA; p < 0.001). The highest temperature was observed in summer followed by rainy, spring, and winter seasons. A statistically higher value was recorded in summer compared to that of other seasons. The lowest temperature was observed in winter which was significantly different than the values of other seasons (p < 0.05). There were no statistically significant differences between the spring and rainy seasons (p > 0.05). The one-way ANOVA indicated that there were significant differences among the values of relative humidity recorded in different seasons (p < 0.001). The highest value was recorded in the rainy season which was significantly different than that of the spring and winter seasons (p < 0.05). On the other hand, the lowest value was recorded in winter.
Table 2. Temperature (T) and relative humidity (RH) in winter, spring, summer, and rainy seasons
3.2 PM10 concentrations
The PM10 concentrations varied among the locations. However, no statistically significant differences were observed among the sampling locations (one-way ANOVA; p > 0.05). The average PM10 concentrations were 266.20 ± 115.74 µg/m3, 248.84 ± 52.85 µg/m3, 341.44 ± 77.51 µg/m3 and 295.14 ± 64.77 µg/m3 for CARS, Doyel Chattar, Postogola, and Chittagong Road, respectively (). In all the sampling sites, the PM10 levels were found to be higher than the limit set by the World Health Organization (WHO) guideline which is 50 μg/m3 for a 24-h period and the Environmental Protection Agency (EPA) limit value which is 150 μg/m3 for a 24-h period. The high particulate concentrations at the studied locations in Dhaka city may be attributed to biomass burning, brick kilns, diesel-powered and gasoline vehicles, industrial fossil fuel burning, and construction activities in and around the city [Citation26,Citation27]. The highest value recorded in Postogola was presumably due to the presence of higher industrial activities in the area which had already been declared as the metal area of Dhaka city. On the other hand, the lowest level of PM10 in Doyel Chattar area may possibly be due to the washout effects of heavy rainfall during the sampling times.
Table 3. Concentrations of PM10 (µg/m3), total airborne bacteria (CFU/m3), and total airborne fungi (CFU/m3) at the sampling sites. pH values of PM10 samples are also included in the table
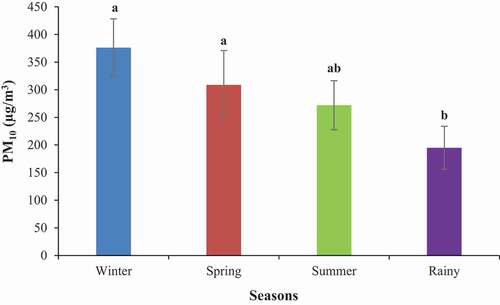
The seasonal variation of PM10 concentrations in the sampling locations of Dhaka city is shown in . The seasonal average concentrations of PM10 were 376.16 ± 52.10 μg/m3 in winter, 308.64 ± 62.37 μg/m3 in spring, 271.99 ± 44.27 μg/m3 in summer, and 194.83 ± 39.03 μg/m3 in rainy seasons. The average PM10 level was found to be significantly higher in the winter season than in the rainy season (one-way ANOVA; p < 0.05). The highest average PM10 concentration observed in the winter season could be ascribed to the temperature inversion phenomenon and the shallow mixing depth, which effects the accumulation of a considerable number of particles in the lower layer of the atmosphere [Citation28–30]. In summer, the PM10 concentrations were relatively lower than in winter, which may be because of the stronger winds and the deeper mixing height in the season leading to better dispersion conditions for the PM10 particles [Citation31]. The minimum PM10 concentrations were recorded in the monsoon season which is characterized by heavy rainfall; heavy rainfall plays an important role in washing out the PM particles from the atmosphere [Citation32]. The results of the present study corroborate the findings of a previous study by Citation29.
Figure 2. Concentrations of PM10 mass in different seasons. A one-way ANOVA followed by Tukey’s HSD post-hoc test was performed to determine if there were any differences among the locations with respect to PM10 concentrations. Different letters above the bars indicate significant differences between seasons at p <0.05
3.3 pH of PM10 samples
pH values of the PM10 samples at different sampling sites are shown in . There is a strong relationship between microbial count and pH. For example, if the sample pH is acidic or alkaline, the microbiological study cannot detect microbial flora. The pH values for all the samples were found to be around 7.0 indicating a conducive condition for most of the bacteria; most bacteria are neutrophiles and grow optimally at pH between 5 and 9 [Citation33].
3.3.1 Concentrations and diversity of bacterial species
After 24 h of sampling, the average concentration of culturable total aerobic bacterial colonies in PM10 was recorded as 7,580 ± 7,510 CFU/m3. The total concentration range of bacterial colonies across the sites varied from 185 CFU/m3 to 23,856 CFU/m3. The mean concentration of culturable bacteria was 1,193 ± 707 CFU/m3 in CARS, 11,312 ± 6,911 CFU/m3 in Doyel Chattar, 3,743 ± 2,407 CFU/m3 in Postogola, and 14,073 ± 8,897 CFU/m3 in Chittagong Road ().
In previous studies, it was found that the bioaerosol concentrations in the clean area are significantly lower than those in the heavily trafficked area or the densely populated area [Citation34]. The findings of the previous studies are corroborated by the findings of the present study. The concentrations of total airborne bacteria were found to be significantly higher in the Chittagong Road and Doyel Chattar areas than those of the other sampling sites. These two sites are considered roadside areas and are highly traffic-congested. There were statistically significant differences among the sampling sites (one-way ANOVA; p < 0.05) with the highest concentration in Chittagong Road and the lowest concentration in CARS.
In the present study, two individual bacterial genera recognized as gram-positive bacteria were identified as dominant species in PM samples. The average concentrations of Bacillus spp. and Staphylococcus spp. were 2,058 ± 1,751 CFU/m3 and 1,466 ± 1,152 CFU/m3, respectively. From a study in North China, which is known for heavy traffic and human activities like Dhaka city, the concentrations of airborne bacteria were found to range from 92 to 3,836 CFU/m3 [Citation22,Citation35], whereas lower concentrations (4 to 911 CFU/m3) were observed in relatively pollution-free Eastern European Cities. Other bacteria, in the present study, included Escherichia coli belonging to total coliforms, and Salmonella spp. and Pseudomonas spp.; their concentrations, however, were found to be below the detection limit. Of all these, Staphylococcus and Bacillus are the dominant bacteria that infect human skin. It is assumed that the major sources of these bacterial aerosols might be contaminated soil, sewage treatment plant, and traffic-congested areas in and around Dhaka city. The dispersion of bioaerosol at the source is driven by climatic conditions and geographical location.
3.3.2 Seasonal variability of bacterial aerosols
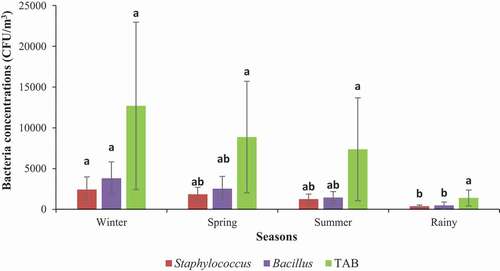
Meteorological parameters such as temperature, relative humidity, rainfall, wind speed, and wind direction mainly control the seasonal variations of the biological aerosols [Citation35,Citation36]. Therefore, depending on the time of the day, weather conditions, season, geographical location, and the presence of sources, the population and genus of bacterial aerosols differ. In this study, it was found that the average concentrations of total airborne bacteria varied with seasons and can be arranged in the following descending order: winter (12,705 ± 10,281 CFUs/m3) > spring (8,870 ± 6,851 CFUs/m3) > summer (7,361 ± 6,320 CFUs/m3) > rainy (1,385 ± 985 CFUs/m3). In the case of Bacillus spp., the average concentrations were 3,806 ± 2,021 in winter, 2,521 ± 1,512 in spring, 1,435 ± 732 in summer, and 469 ± 429 in the rainy season. For Staphylococcus spp., the concentrations were 2,415 ±1,567 in winter, 1,832 ± 868 in spring, 1,245 ± 618 in summer, and 375 ± 134 in rainy seasons. shows the types and concentrations of bacteria associated with PM10 based on seasons. There were no significant variations among the seasons in terms of total airborne bacterial concentrations (one-way ANOVA; p > 0.05). However, the isolates of bacterial species, i.e. Bacillus spp. and Staphylococcus spp. varied significantly across the seasons (p < 0.05). The highest concentrations were found in the winter season and the lowest in the rainy season. The results are in agreement with those obtained by Citation37, in which they observed the highest concentrations of total airborne microbes (1.11 × 10⁶ CFU/m3) in winter and lowest (3.47 ×10⁵ CFU/m3) in summer [Citation37]. In separate studies, Citation22, and Li et al. [2017] reported a similar seasonal trend, where they used culturable methods. Our findings are also in contrast to the findings of some previous studies. For example, Citation19, reported that the highest concentrations of bacteria occur in autumn, whereas Citation24, found the highest concentrations of bacteria in spring [Citation19, Citation24]. In a separate study, Citation38, found the highest concentrations of airborne bacteria in summer [Citation38]. The dissimilarity in findings could have stemmed from the natural differences in geographical regions [Citation39]. In our study, the higher bacterial aerosol concentrations in the months of winter and spring could be ascribed to the higher concentration of dust particles in the air samples during that period (). The higher values in winter could also be attributed to the low wind velocity and the foggy and hazy days in winter [Citation40]. On the other hand, the lower bacterial aerosol concentrations in summer and rainy seasons may presumably be due to the washout effects of rainfall events in those seasons [Citation41]. The high temperature in combination with a harsher atmospheric environment (e.g., strong UV intensity, a higher ozone level, etc.) was also reported to reduce the outdoor bacterial levels [Citation19,Citation24,Citation35,Citation40].
Figure 3. Concentrations of PM10-bound total airborne bacteria (TAB) and Staphylococcus and Bacillus bacteria in different seasons. A one-way ANOVA followed by Tukey’s HSD post-hoc test was performed to determine if there were any differences among the locations with respect to bacterial concentrations. Different letters within the same species indicate significant differences at p <0.05
3.3.3. Correlations between bacterial concentrations and meteorological parameters
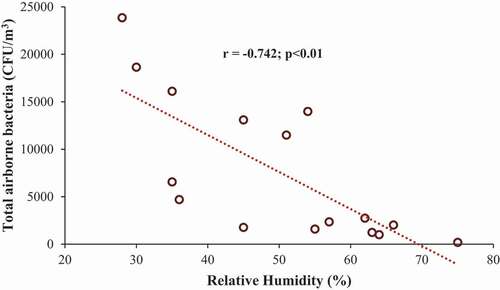
Relationships between the concentration of bacterial bioaerosols and temperature and between the concentration of bacterial bioaerosols and relative humidity (RH) were determined using Pearson correlation analysis. The correlation coefficient values are tabulated in . Significant correlations with r > 0.5 (therefore explaining 25% of total variation) were only considered for further discussion [Citation42]. shows the correlation between bacterial concentration and relative humidity. There are no significant correlations between total airborne bacteria, Staphylococcus spp., Bacillus spp. and temperature. On the other hand, strong significant negative correlations were found between total airborne bacteria, Bacillus spp. and Staphylococcus spp. and relative humidity, meaning the higher the RH, the lower the bacterial count and vice versa. Negative correlations between airborne microbes and RH were observed in some previous studies [Citation43–45]. However, the effects of RH on microbial release are varied. Different microbes exhibit different reactions towards RH and sometimes they show no reaction at all [Citation46].
Table 4. Correlation between different types of bacteria and meteorological parameters
Figure 4. Correlation between relative humidity (%) and total airborne bacteria (CFU/m3)
3.3.4. Stepwise regression analyses to understand the effects of meteorological parameters on bacterial concentrations
From the stepwise regression analyses in , relative humidity (RH), PM10 concentrations, and pH of PM10 particles were found to be important factors controlling the concentrations of bacteria in PM10 particles. Relative humidity and PM10 particles had a negative correlation with the concentrations of total airborne bacteria. On the other hand, pH had a positive correlation with the concentrations of total airborne bacteria. The developed regression model explained about 76% of the variation in bacterial concentration in the studied areas. The temperature was not found to be significant (p > 0.05) for the bacterial concentration and was not included in the developed regression model. Our regression model is in slight disagreement with some of the previous studies. Li et al. (2011) employed a multiple linear regression model and obtained positive correlations between temperature and culturability and the total number of bioaerosol microbes collected from a coastal region. The researchers, however, found negative correlations between relative humidity and culturable and the total number of bioaerosol microbes, which is in line with our findings. Mouli et al. (2005) also developed a regression model, where meteorological factors such as temperature, RH, and wind speed accounted for about 50% variation in the bacterial concentrations. In their study, wind speed was found to be the most important parameter controlling bacterial concentration. In our study, the wind speed parameter was not recorded and consequently not used for the stepwise regression analyses. In the future studies, this parameter should be considered to determine its importance in controlling the concentrations of airborne bacteria and fungi in Dhaka city.
Table 5. Stepwise regression analysis of the concentrations of total airborne bacteria and PM10 concentrations, pH of PM10 particles, temperature (T), and relative humidity (RH). Temperature was not included in the model because of non-significance
3.3.5. Total fungal concentrations and diversity
The culturable airborne fungal concentration was also estimated from the samples that were collected from different parts of Dhaka city. The concentration of airborne fungi was found to vary greatly across the different sampling sites (one-way ANOVA; p <0.05). The range of culturable total fungal concentrations was 174 to 3,588 CFU/m3 with a mean concentration of 967 ± 892 CFU/m3. The mean concentrations of total fungi were 489 ± 378 CFU/m3 in CARS, 594 ± 326 CFU/m3 in Doyel Chattar, 812 ± 690 CFU/m3 in Postogola, and 1,974 ± 1,173 CFU/m3 in Chittagong Road ().
From , the highest fungal concentration was found at Chittagong road, which is a highly trafficked area [Citation34], and the second highest in Postogola, which is a well-known industrial area with a dense population. High heat produced from different industries could be one of the primary reasons for enhanced fungal growth in Postogola.
Fungal colonies identified based on their morphological characteristics exhibited significant variation among the PM samples. In the present study, different types of individual genera and some species of fungi were identified in the PM samples. The genera and species identified include Aspergillus (A. flavus, A. niger, A. fumigatus), Penicillium, Cladosporium, Rhizopus (R. stonifer), Fusarium, Monilia, Syncephalastrum, Bipolaris, Alternaria, Trichoderma, Neurospora, etc. and several non-sporing isolates. Non-Sporing Isolates are those that do not produce spores even after 30 days of incubation. Among all these fungal types, previous researchers identified Aspergillus, Penicillium, Cladosporium and Fusarium as the most common allergens for their high allergic properties [Citation47,Citation48].
3.3.6 Seasonal variability of fungal aerosols
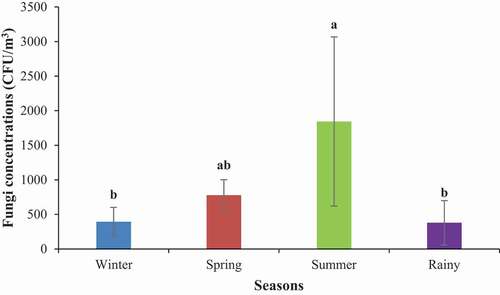
Bioaerosol concentrations may change seasonally due to the variations in local sources and air diffusion conditions. These concentrations are also affected by meteorological factors and the degree of air pollution. Fungal conidia exhibited considerable variability with the change in seasons. The total fungal concentrations were found to be 394 ± 207 CFU/m3, 777 ± 225 CFU/m3, 1843 ± 1224 CFU/m3, and 379 ± 320 CFU/m3 in winter, spring, summer, and rainy seasons, respectively (). Different fungi species found at different locations are presented in .
Table 6. Fungal species/genera obtained from four different locations in winter (W), spring (S), summer (SU) and rainy (R) seasons
Figure 5. Concentrations of PM10-bound total airborne fungi (TAF) in different seasons. A one-way ANOVA followed by Tukey’s HSD post-hoc test was performed to determine if there were any differences among the locations with respect to fungal concentrations. Different letters above the bars indicate significant differences between seasons at p <0.05
Aspergillus spp. was found to be the most prevalent genus of fungi in all the sampling sites, as determined by culture. The genera Penicillium/Fusarium/Monilia was the second most common fungal genera, followed by Rhizopus stolonifer, Syncephalastrum spp., Trichoderma spp., Penicillium spp., Streptomyces spp., Penicillium variabile, and Eurotium stelodami. Alternaria alternata and Cladosporium sphaerospermum were not found in any of the samples at all.
The concentrations of total fungal conidia were the maximum during the summer season, the minimum in winter and rainy seasons, and moderate during spring months. Significant variations between summer and winter and between summer and rainy seasons were observed (one-way ANOVA; p < 0.05). The total fungal conidia concentrations occurred in the following descending order: summer > spring > winter > rainy. In a previous study, Li et al. (2011) observed the lowest concentration of airborne microbes in the winter season, which was attributed to the inhibitory effect of low temperature in the atmosphere. During summer, the high atmospheric temperatures and moistures increase cell membrane fluidity and promote microbial activity that is conducive for the germination, growth, and release of airborne fungi [Citation36]. In another study, Citation48, reported the highest concentrations of fungal conidia in summer, which was attributed to the maximum wind speed in summer; the minimum wind speed resulted in the lowest concentrations in winter and monsoon months. The findings in the present study are inconsistent with the findings of the study carried out by Chakrabarti [Citation47] who found higher fungal concentration in winter than other seasons in Kolkata, India, and ascribed it to the geographic characteristics of the sampling area. For instance, the fungal concentration peak in autumn in Ohio, USA, whereas the concentrations were found to peak in the summer in Cracow, Poland [Citation39].
3.3.7 Correlations between fungal concentrations and meteorological parameters
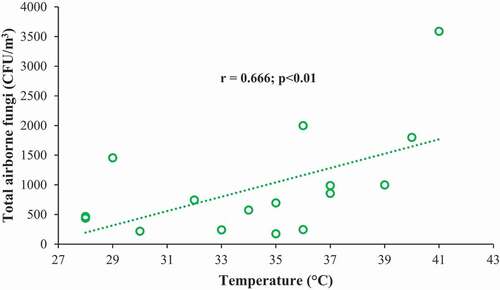
The correlation between temperature and total fungal conidia was statistically significant and positive, i.e. the higher the temperature, the higher the fungal count and vice versa (r = 0.666; p < 0.01). The findings could be substantiated by the findings of earlier researchers, who all reported a positive correlation between temperature and fungal conidia [Citation36,Citation39,Citation49,Citation50]. Warm and rainy seasons favor sporulation which accounts for the higher fungal count in summer [Citation51]. The phenomenon of convective upliftment of surface deposits was also ascribed to the higher fungal count in summer [Citation48]. Wind-assisted transported material might add to the fungal spore fraction of ambient PM load. On the other hand, fungal count did not show any statistically significant correlation with relative humidity (RH) (r = 0.065, p > 0.05). Similar result was reported in a previous study [Citation37]. However, some studies reported positive correlations between the concentrations of culturable bioaerosol and RH (Li et al., 2017). represents correlation between total fungal concentrations and atmospheric temperature.
Figure 6. Correlation between temperature (°C) and total airborne fungi (CFU/m3)
3.3.8. Stepwise regression analyses to understand the effects of meteorological parameters on fungal concentrations
represents the stepwise regression analyses performed for total fungal concentrations and parameters such as PM10 concentrations, pH of PM10 particles, temperature (T), and relative humidity (RH). Fungal concentrations were found to be influenced by ambient temperature and relative humidity. There was a positive correlation between temperature and the concentrations of total airborne fungi present in the PM10 samples. On the other hand, relative humidity exhibited a negative correlation with the concentrations of total airborne fungi. The developed regression model explained about 60% of the variation in fungal concentration in the studied areas. PM10 concentrations and pH of PM10 particles were not found to be significant and consequently not included in the developed regression model. Citation39, studied the relationships between the concentrations of ambient inhalable airborne fungi and different environmental parameters. They found statistically significant positive correlations between total fungi and temperature and between total fungi and ozone. They also obtained significant positive correlations for Aspergillus/Penicillium, Alternaria, and Ascospores with both temperature and ozone. However, from stepwise regression analyses, the temperature was found to be the main governing factor for the concentrations of total airborne fungi and the individual genera or groups of fungi.
Table 7. Stepwise regression analysis of the concentrations of total airborne fungi and PM10 concentrations, pH of PM10 particles, temperature (T), and relative humidity (RH). PM10 concentrations, pH of PM10 particles were not included in the model due to non-significance
3.4 Dose-rate estimation of biological contents
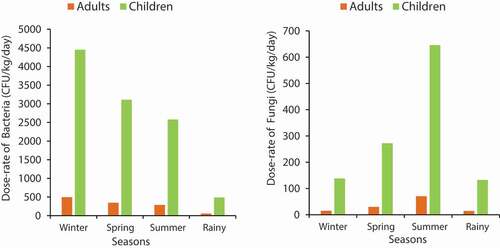
represents the dose rates due to inhalation of bioaerosols such as bacteria and fungi for both children and adults in different seasons. It was observed that children were exposed to worse conditions vis-à-vis the bacterial and fungal dose rates. The average values of all four seasons were calculated and the children were found to be exposed to higher dose rates (2655.6 and 297.2 CFU/kg/day for bacteria and fungi, respectively) compared to the adults (295.1 and 32.4 CFU/kg/day for bacteria and fungi, respectively). Bacterial dose rates were higher for both children and adults than the fungal dose rates because higher concentrations of bacteria were found in the studied areas. In some previous studies, similar results were observed; the fact that children were more exposed to biological pollutants than the adults was attributed to their vulnerability, low weight, higher respiration rates per unit body weight, and high susceptibility [53]. From , it can be observed that in each season the children were exposed to higher dose rates of both bacteria and fungi compared to the adults.
Table 8. Age-specific dose rates (CFU/kg/day) of PM10-bound biological contents
Figure 7. Dose-rate of bacteria and fungi to adults and children
4. Conclusions
Bioaerosols, which account for ~5-10% of the total suspended particulate matter, have not been given due importance and have woefully been neglected in the past. The present study is the first of its kind in Bangladesh where the particulate matter was investigated for its bacterial and fungal concentrations and distributions. The current study assessed the location-wise and seasonal variations in bacterial and fungal concentrations. The stepwise regression model exhibited associations between bacterial concentrations and relative humidity and PM10 concentrations. The regression model also revealed the combined role of temperature and relative humidity on fungal concentrations. Bangladesh is one of the countries in the world, who is at the receiving end of the consequences of the global warming phenomenon. If previous years’ trend is taken into account, Dhaka city is expected to experience spells of the heat wave in the coming decades. Unceasing population growth, urbanization, and industrialization are likely to aggravate the scenario in Dhaka city and other cities, for that matter. As indicated by the study, the increasing temperature could promote the growth of fungi which will, in turn, exacerbate an already bad air pollution condition in Dhaka city. Diseases associated with fungi will pose serious health hazards to children who are the most vulnerable group. The incidence of respiratory allergic diseases will likely increase which will create new vulnerable groups. The findings of the present study will provide a strong basis for the policymakers in Bangladesh to regulate different industrial operations and other activities that are known to enhance the number of viable microorganisms in the air. The study will also pave the way for other scientists to delve into this aspect of air pollution. Further studies on the source apportionment of bioaerosols are warranted.
Supplemental Material
Download MS Word (223.6 KB)Acknowledgments
The authors gratefully thank the Bangladesh Bureau of Educational Information and Statistics (BANBEIS), The World Academy of Science (TWAS), and the Cambridge Programme to Assist Bangladesh in Lifestyle and Environmental risk reduction (CAPABLE) for their financial support for this study. We also express our sincere thanks to the Department of Soil, Water and Environment, University of Dhaka, the Department of Botany, University of Dhaka, and the scientists of the CARS, DU for providing analytical and instrumental facilities, as well as sharing their knowledge regarding the characterization.
Disclosure statement
No potential conflict of interest was reported by the author(s).
Supplementary Material
Supplemental data for this article can be accessed here.
Correction Statement
This article has been republished with minor changes. These changes do not impact the academic content of the article.
Additional information
Funding
References
- Gupta A, Moniruzzaman M, Hande A, et al. Estimation of particulate matter (PM2.5, PM10) concentration and its variation over urban sites in Bangladesh. SN Appl Sci. 2020;2(12). DOI:https://doi.org/10.1007/s42452-020-03829-1.
- Rahman MM, Saidi K, Ben Mbarek M, et al. Economic growth in South Asia: the role of CO2 emissions, population density and trade openness. Heliyon. 2020;6(5). DOI:https://doi.org/10.1016/j.heliyon.2020.e03903.
- Yan D, Zhang T, Su J, et al. Diversity and composition of airborne fungal community associated with particulate matters in Beijing during haze and non-haze days. Front Microbiol. 2016;7. DOI:https://doi.org/10.3389/fmicb.2016.00487.
- Brook RD, Franklin B, Cascio W, et al. Air pollution and cardiovascular disease - A statement for healthcare professionals from the expert panel on population and prevention science of the American heart association. Circulation. 2004;109(21):2655–2671.
- Kioumourtzoglou MA, Schwartz JD, Weisskopf MG, et al. Long-term PM2.5 exposure and neurological hospital admissions in the Northeastern United States. Environ Health Perspect. 2016;124(1):23–29.
- Kumar P, Hama S, Nogueira T, et al. In-car particulate matter exposure across ten global cities. Sci Total Environ. 2021;750:141395.
- Douwes J, Thorne P, Pearce N, et al. Bioaerosol health effects and exposure assessment: progress and prospects. Ann Occupat Hyg. 2003b;47(3):187–200.
- Blais-Lecours P, Perrott P, Duchaine C, et al. Non-culturable bioaerosols in indoor settings: impact on health and molecular approaches for detection. Atmos Environ. 2015;110:45–53.
- Bolashikov ZD, Melikov AK. Methods for air cleaning and protection of building occupants from airborne pathogens. Build Environ. 2009;44(7):1378–1385.
- Douwes J, Thorne P, Pearce N, et al. Bioaerosol health effects and exposure assessment: progress and prospects. Ann Work Expo Health. 2003a;47(3):187.
- Frohlich-Nowoisky J, Kampf CJ, Weber B, et al. Bioaerosols in the earth system: climate, health, and ecosystem interactions. Atmospheric Research. 2016;182:346–376.
- Goldman DL, Huffnagle GB. Potential contribution of fungal infection and colonization to the development of allergy. Med Mycol. 2009;47(5):445–456.
- Smets W, Moretti S, Denys S, et al. Airborne bacteria in the atmosphere: presence, purpose, and potential. Atmos Environ. 2016;139:214–221.
- Walser SM, Gerstner DG, Brenner B, et al. Evaluation of exposure-response relationships for health effects of microbial bioaerosols - A systematic review. Int J Hyg Environ Health. 2015;218(7):577–589.
- Bush RK, Portnoy JM. The role and abatement of fungal allergens in allergic diseases. J Allergy Clin Immunol. 2001;107(3):S430–S442.
- Elbert W, Taylor PE, Andreae MO, et al. Contribution of fungi to primary biogenic aerosols in the atmosphere: wet and dry discharged spores, carbohydrates, and inorganic ions. Atmos Chem Phys. 2007;7(17):4569–4588. .
- Kallawicha K, Tsai Y-J, Chuang Y-C, et al. The spatiotemporal distributions and determinants of ambient fungal spores in the Greater Taipei area. Environ Pollut. 2015;204:173–180.
- Pringle A. Asthma and the diversity of fungal spores in air. PLoS Pathog. 2013;9(6):e1003371–e1003371.
- Fang ZG, Ouyang ZY, Zheng H, et al. Culturable airborne bacteria in outdoor environments in Beijing, China. Microb Ecol. 2007;54(3):487–496.
- Lighthart B. The ecology of bacteria in the alfresco atmosphere. FEMS Microbiol Ecol. 1997;23(4):263–274.
- Shaffer BT, Lighthart B. Survey of culturable airborne bacteria at four diverse locations in Oregon: urban, rural, forest, and coastal. Microb Ecol. 1997;34(3):167–177.
- Haas D, Galler H, Luxner J, et al. The concentrations of culturable microorganisms in relation to particulate matter in urban air. Atmos Environ. 2013;65:215–222.
- Begum BA, Hopke PK. Ambient air quality in Dhaka Bangladesh over two decades: impacts of policy on air quality. Aerosol Air Qual Res. 2018;18(7):1910–1920.
- Bragoszewska E, Mainka A, Pastuszka JS, et al. Concentration and size distribution of culturable bacteria in ambient air during Spring and Winter in Gliwice: a Typical Urban Area. Atmosphere. 2017;8(12). DOI:https://doi.org/10.3390/atmos8120239.
- Mentese S, Rad AY, Münevver A, et al. Seasonal and spatial variations of bioaerosols in indoor Urban environments, Ankara, Turkey. Indoor Built Environ. 2012;21(6):797–810.
- Begum BA, Hopke PK. Identification of sources from Chemical characterization of fine particulate matter and assessment of ambient air quality in Dhaka, Bangladesh. Aerosol Air Qual Res. 2019;19(1):118–128.
- Iqbal A, Afroze S, Rahman MM, et al. Vehicular PM emissions and Urban public health sustainability: a probabilistic analysis for Dhaka City. Sustainability. 2020;12(15). DOI:https://doi.org/10.3390/su12156284.
- Bozkurt Z. Seasonal variation of water-soluble inorganic ions in PM10 in a city of northwestern Turkey. Environ Forensics. 2018;19(1):1–13.
- Chithra VS, Shiva Nagendra SM. Chemical and morphological characteristics of indoor and outdoor particulate matter in an urban environment. Atmos Environ. 2013;77:579–587.
- Lutgens FK, Tarbuck EJ. The atmosphere: an introduction to meteorology. 5th ed ed. Englewood Cliffs, N.J: Prentice-Hall; 1992.
- Mantis J, Chaloulakou A, Samara C, et al. PM10-bound polycyclic aromatic hydrocarbons (PAHs) in the Greater Area of Athens, Greece. Chemosphere. 2005;59(5):593–604.
- Bodor Z, Bodor K, Keresztesi Á, et al. Major air pollutants seasonal variation analysis and long-range transport of PM10 in an urban environment with specific climate condition in Transylvania (Romania). Environ Sci Pollut Res Int. 2020;27(30):38181–38199.
- Jin QS, Kirk MF. pH as a primary control in environmental microbiology: 1. Thermodynamic perspective. Front Environ Sci. 2018;6. DOI:https://doi.org/10.3389/fenvs.2018.00021.
- Xin-Yu C, Pi-Xin R, Kin-Fai H, et al. Concentrations and size distributions of airborne microorganisms in Guangzhou during Summer. Aerosol Air Qual Res. 2012;12(6):1336–1344.
- Wang CC, Fang GC, Kuo CH, et al. Bioaerosols as contributors to poor air quality in Taichung City, Taiwan. Environ Monit Assess. 2010;166(1–4):1–9.
- Garaga RC, Avinash KR, Kota H, et al. Seasonal variation of airborne allergenic fungal spores in ambient PM(10)a study in Guwahati, the largest city of north-east India. Air Qual Atmos Health. 2019;12(1):11–20.
- Dong L, Jianhua Q, Shao C, et al. Concentration and size distribution of total airborne microbes in hazy and foggy weather. Sci Total Environ. 2016;541:1011–1018.
- Bowers RM, Clements N, Emerson JB, et al. Seasonal variability in bacterial and fungal diversity of the near-surface atmosphere. Environ Sci Technol. 2013;47(21):12097–12106.
- Adhikari A, Reponen T, Grinshpun SA, et al. Correlation of ambient inhalable bioaerosols with particulate matter and ozone: a two-year study. Environ Pollut. 2006;140(1):16–28.
- Xie ZS, Li YP, Lu R, et al. Characteristics of total airborne microbes at various air quality levels. J Aerosol Sci. 2018;116:57–65.
- Guo LC, Zhang YH, Lin HL, et al. The washout effects of rainfall on atmospheric particulate pollution in two Chinese cities. Environ Pollut. 2016;215:195–202.
- Hossain ME. Iron Nanoparticles and Biopolymers for Plant Nutrient Fortification (Doctoral Dissertation). Fargo (ND): North Dakota State University; 2016.
- Ianovici N. Atmospheric concentrations of selected allergenic fungal spores in relation to some meteorological factors, in TimiAYoara (Romania). Aerobiologia. 2016;32(1):139–156.
- Sadys M, Strzelczak A, Grinn-Gofron A, et al. Application of redundancy analysis for aerobiological data. Int J Biometeorol. 2015;59(1):25–36.
- Zhen Q, Deng Y, Wang YQ, et al. Meteorological factors had more impact on airborne bacterial communities than air pollutants. SciTotal Environ. 2017;601:703–712.
- Knudsen SM, Gunnarsen L, Madsen AM, et al. Airborne fungal species associated with mouldy and non-mouldy buildings - effects of air change rates, humidity, and air velocity. Build Environ. 2017;122:161–170.
- Chakrabarti HS, Das S, Gupta-Bhattacharya S, et al. Outdoor airborne fungal spora load in a suburb of Kolkata, India: its variation, meteorological determinants and health impact. Int J Environ Health Res. 2012;22(1):37–50.
- Kumar A, Attri AK. Characterization of fungal spores in ambient particulate matter: a study from the Himalayan region. Atmos Environ. 2016;142:182–193.
- Adhikari A, Sen MM, Gupta-Bhattacharya S, et al. Air-borne viable, non-viable, and allergenic fungi in a rural agricultural area of India: a 2-year study at five outdoor sampling stations. SciTotal Environ. 2004;326(1–3):123–141.
- Ho HM, Rao CY, Hsu HH, et al. Characteristics and determinants of ambient fungal spores in Hualien, Taiwan. Atmos Environ. 2005;39(32):5839–5850.
- Aira MJ, Rodriguez-Rajo FJ, Fernandez-Gonzalez M, et al. Spatial and temporal distribution of Alternaria spores in the Iberian Peninsula atmosphere, and meteorological relationships: 1993-2009. Int J Biometeorol. 2013;57(2):265–274.