
 ?Mathematical formulae have been encoded as MathML and are displayed in this HTML version using MathJax in order to improve their display. Uncheck the box to turn MathJax off. This feature requires Javascript. Click on a formula to zoom.
ABSTRACT
Rice is staple food of Asian countries including Pakistan. Contamination of paddyfields with marble waste containing toxic metals has emerged as a key public health concern. Current study aimed to analyze heavy metal concentrations in marble powder, paddy soil and rice crop to estimate probable human health risks in District Malakand of Pakistan. Triplicate dry samples were analyzed through Energy Dispersive X-ray Fluorescence spectroscopy (ED-XRF). The marble waste increased the concentration of metals in paddy soil, subsequent increase in metals accumulation was found in rice grains. In grains the maximum concentration (mg/kg) of Fe (50.70), Cu (17.60), Mn (7.49) and Al (6.80) exceeded the permissible limits of FAO/WHO. The cumulative hazard index (HI) value from heavy metals through consumption of rice was greater than unity (HI > 1) indicating potential health risks. The results of Pearson correlation, Principal component analysis (PCA), and cluster analysis (CA) for metals were consistent.
Introduction
Urbanization and rapid growth of the industrial sector introduce a mass of contaminants into the environment that causes severe heavy metal (HM) pollution in soil, disruption in the geochemical cycle of ecosystem, and adversely affect human health [Citation1,Citation2]. Globally, millions of tons of marble waste are produced daily in marble quarrying and processing units comprise of fine powder and fragmented rocks which is dumped in roads, riverbeds, empty pits, agriculture land that causes a wide range of environmental pollution [Citation3,Citation4]. Dispersion of particulate matter from marble quarries and processing units causes widespread accumulation of Magnesium and Calcium compounds in different media of the earth systems significantly affects the quality of water, air, soil and biodiversity [Citation5,Citation6].
Heavy metals contamination of water, soil and food crops emerged as a critical global concern having detrimental influences on plant growth, food safety and water purification [Citation7]. Heavy metals accumulate in food chain through the application of agrochemicals, organic and inorganic manures, sewage, and industrial wastewater are used for higher agricultural yield [Citation8]. Metals like zinc (Zn) and copper (Cu) are essential for enzymatic activities and have DNA binding domains [Citation9]. However, the majority of heavy metals enter the food chain, bioaccumulate, and induces cancers and various diseases by the mechanism of production of reactive oxygen species led to oxidative stress, endocrine disruption, carcinogenicity, neurotoxicity, genomic instability, impaired psycho-social behavior, and immunological problems [Citation10–12]. Heavy metals are detrimental for their high bioaccumulation potential, long half-lives, and non-biodegradable nature [Citation13]. Heavy metal (HM) contamination in rice has mostly come from the soil in which it is cultivated [Citation14]. Unfortunately, the industrial sector in Pakistan produces about 1.309 × 10⁹m3 wastewater annually and discharge into freshwater resources or agricultural land that cause contamination of the water bodies [Citation15,Citation16]. Hence, the farmers in the country are reluctant to use contaminated water to meet the water requirement of the crops [Citation17]. So, it is essential to know the possible risks to human health by studying heavy metals buildup in soil-rice systems [Citation18].
Energy-dispersive X-ray fluorescence spectroscopy (ED-XRF) is a rapid, non-destructive, and easy handling analytical technique widely used for fast mineral analysis in the cement industry, archeology, mining, geology, forensic and food sciences [Citation19–21]. ED-XRF has a specific, multi-elemental detection capacity that involves no sample pre-treatment. It is an alternative to the traditional atomic spectroscopic methods being time-consuming that requires highly skilled staff for digestion of the sample with toxic reagents and daily calibration of the instrument using a standard solution for routine analysis. Moreover, EDXRF is a powerful green technology that quickly results and makes data analysis effectively [Citation19,Citation22–25]. The instrumental analysis worked on the principle that each element emits secondary ‘fluorescent’ X-rays of typical energy when exposed to X-rays of appropriately high quanta from an X-ray tube. The energy with the intensity of these emitted X-rays is measured and used for the determination of elemental composition and its concentration in the sample through the detection system [Citation26,Citation27]. Generally, elements with higher atomic weight required higher energy for fluorescence emission and subsequently higher energy of fluorescence easily detects fluorescence. The elemental concentration in the analytical sample is estimated by calibration standards that are used to correlate the intensity of emitted X-ray for each element with its previously known concentration already detected via ICP-OES [Citation21,Citation28]. The current study aimed (i) to analyze essential and toxic elements of marble waste powder, and their subsequent accumulation in paddy soil and rice plants (ii) to determine the potential sources of elements in paddy soil, and rice plants through multivariate statistical techniques (iii) and to assess the potential human health-related risks for the local population via the dietary intake of rice grains.
Materials and methods
Study area
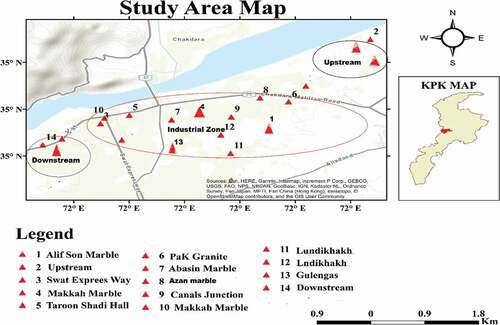
Malakand is the gateway to District Swat, Dir, Chitral, and ex-federally administered tribal areas (Bajaur, Mohmand) which are most famous for tourist spots. District Malakand occupies a total of 952 Km2 area with a population density of 475 people/Km2 [Citation29]. Precious mineral reserves such as Malakand granite, Dargai chromite, marble, mica, quartz, and other valuable mineral resources have been reported in various geographical points at District Malakand [Citation30]. Malakand is a major rice-producing district in Khyber Pakhtunkhwa ranked 4th in terms of rice production. The total irrigated paddy land in district Malakand in 2016–17 was 4991 hectares and produced 10,773 tons during the same year [Citation31,Citation32]. The current research study was conducted near the marble industrial area located between Batkhela and Thana village of district Malakand as presented in (). The marble industrial effluents contain harmful compounds, toxic metals, and suspended solids, which are non-biodegradable in nature [Citation33]. Discharge of these untreated marble industry effluents to water bodies and agricultural land causes water and soil pollution [Citation16].
Figure 1. Pictorial representation of sampling sites of the study area of District Malakand, Pakistan
Sampling of marble industry powder
The sampling of marble powder, paddy soil, and rice crop were carried out during Aug-Dec 2019. The dried marble powder was collected in triplicate (each with 0.25 kg) from nine marble/granite processing plants adjacent to paddy fields, and kept in labeled, clean polythene bags, and were brought to the laboratory of Botany Department Islamia College Peshawar for further analysis. The collected powder sample from at least three marble industry was then combined, thoroughly mixed, sieved with 2 mm mesh to obtain a composite sample of each with 2.2 kg [Citation34]. For analysis of multi-elements in marble powder through (EDXRF-7000), a total of nine (09) samples were prepared and stored in labeled clean polythene bags.
Rice and paddy soil sampling
Rice plants at the reproductive stage were uprooted in triplicate along with soil (0.5 kg) at a depth of 0–20 Cm using steel shovel from the three sites (i) Upstream sites: unpolluted, located 400 meters away from the marble industry taken as control (ii) industrial sites: where marble dust and effluents were directly discharged into paddy fields (iii) Downstream site: located 400 meters behind of marble factories where effluents of all marble factories were collected and used directly for irrigation of the paddy crop [Citation35].The soil particles were removed on the spot from the roots of rice plants. The collected samples of both soil and rice plants were kept in separate, labeled, clean polythene bags and brought to the laboratory of Botany Department Islamia College Peshawar.
Preparation of soil and rice plant samples
The soil samples were mechanically grounded, air-dried, and passed through a sieve up to 2 mm, and stored in labeled polythene bags at ambient temperature for further analysis [Citation36]. The rice plants were washed three times with tap water and rinsed with distilled water to remove soil and airborne pollutants. The surface water was absorbed through Whatman filter paper no. 42. The rice plant tissues such as roots, straws, leaves, and panicles were separated and oven-dried at 70°C for 24 hours to remove moisture content [Citation37]. Each rice grain from its outer shell was separated manually. Through an electric grinder, the rice plant tissues such as root, straw, leaves, and grains were ground into a fine powder. A composite sample of the root, straw and leaves powder were prepared. All the samples including rice grains were stored in labelled clean polythene bags for multi-elemental analysis.
Energy dispersive X-ray fluorescence analysis
Prepared samples of marble powder, soil, and rice plant tissues were transported to the Centralized Resource Laboratory (CRL), University of Peshawar. The samples were quantified using energy dispersive X-ray fluorescence spectrometer (EDX-7000, Na-U, Shimadzu, Japan) with loose powder method, calibration with Al-Cu standard [Citation38–40]. One-gram powder from the samples of marble, paddy soil, and rice plant in replication of three were placed over a thin film lined a 10 mL Polypropylene cup and then mounted inside the EDX-7000 spectrometer [Citation41]. The instrument is equipped with an X-ray tube using Rhodium (Rh) target and a high-performance silicon drift detector (SDD), operated with a maximum of 50 kV and 1000 μA and a PCEDX-Navi software. The elemental composition of all samples was detected under an air-based atmosphere. The analytes were then assessed with a collimator of 10 mm in diameter with a live acquisition time of the 60s [Citation40,Citation42].
Health risks assessment
Estimated daily intake (EDI) of Heavy metals through consumption of rice
The potential health risks via consumption of contaminated rice grains with heavy metals were assessed by using the following equation adopted by [Citation43,Citation44].
Where EDI is the estimated daily dose (mg/kg/person/day)
Cmetal is the concentration of metal in rice grains (mg/kg dry mass)
IR is the daily ingestion rate of rice which is 0.120 kg/person/day [Citation45]
BW is the average body weight which is 73.3 Kg [Citation46]
Hazard quotient (HQ)
The hazard quotient is a ratio of the estimated daily intake (EDI) and reference dose (RfD). HQ value less than one indicates no health risk whereas an HQ > one demonstrates detrimental health risk and can be calculated by following [Citation44].
The oral reference doses (RfD) value for Al, Cr, Cu, Fe, Mn, Ni, and Zn are 1.00, 0.003, 0.04, 0.7, 0.14,0.02, and 0.3 mg/ kg/day respectively [Citation47–49].
Hazard index (HI)
Hazard index (HI) was used for the estimation of overall non-carcinogenic human health risks via the consumption of multiple elements in food crops [Citation50]. The hazard index (HI) is the sum of the hazard quotients and can be calculated as follows
Whereas HI less <1.0, indicate negligible noncarcinogenic adverse effect due to the exposure pathway.
Statistical analysis
Descriptive statistics such as mean, standard deviation, standard error of mean, minimum, and maximum were calculated for the elements present in marble powder, paddy soil, and rice plant using Excel software 2016. For finding an association between metals and their potential sources in marble powder, soil, and rice plant, Pearson correlation, Principal component analysis (PCA), and Cluster analysis (CA) were carried using a statistical software package, SPSS Version 25. Pearson correlation, a bivariate correlation used to calculate pairwise relationships for a set of variables and is helpful for the determination of the strength and direction of the relationship between two variables [Citation51]. The principal component analysis is designed for the transformation of the original variables into new (uncorrelated) variables called principal component. In the PCA the principal component that is eigenvalue (>1) was extracted whereas factor analysis was performed with varimax rotation with Kaiser normalization method [Citation42,Citation52]. Cluster analysis (CA) is adopted for the classification of metals into groups on a similarity basis so that similar metals come together in the same class for variable space [Citation53]. Before the execution of cluster analysis, the raw data was standardized with the Z score. The cluster analysis (CA) was performed with dendrogram using Wards algorithmic method [Citation52].
Results and discussions
Quantification of heavy metals in marble industry powder, paddy soil and rice plants
A total of sixteen elements were quantified for marble powder and paddy soil including eleven elements for rice plants and its grains through the energy-dispersive x-ray fluorescence (ED-XRF) analysis ().
Table 1. Heavy metal concentrations (mg/kg) of the various marble processing units (a) and paddy soil (b) of District Malakand (n = 09)
Table 2. Heavy Metals concentrations (mg/kg] in rice plants (a) and rice grains (b) of District Malakand (n = 09)
Heavy metals concentrations in marble industry powder
showed mean highest concentrations (mg/kg) for Ca (759.3 ± 110.6) followed by Si (324.4 ± 53.6), Fe (111.9 ± 18.0), Al (90.5 ± 4.0), K (48.6 ± 9.9) and Ti (16.9 ± 3.6) respectively. Concentrations of Mn and Vanadium (V) was maximum with mean values of (5.2 ± 1.9 mg/kg) and (3.8 ± 1.0 mg/kg). Mean metal contents for Strontium (Sr), Chromium (Cr), Nickel (Ni) and Rubidium (Rb) were found to be (3.4 ± 2.0 mg/kg), (3.3 ± 1.3 mg/kg), (3.1 ± 1.4 mg/kg), and (3.0 ± 2.4 mg/kg), respectively. Similarly, mean level for Zr (2.5 ± 0.7 mg/kg), Zn (2.3 ± 1.6 mg/kg), Cu (2.3 ± 1.6 mg/kg), and Y (2.2 ± 1.4 mg/kg). The essential and trace heavy metals in marble powder were found to be in the order of Ca > Si > Fe > Al > K > Ti > Mn > V > Sr > Cr > Ni > Rb > Zr > Zn > Cu > Y. In a similar study [Citation16] reported heavy metal level in marble stones of District Buner, Pakistan with mean values of Fe (125.0 µg/g), Pb (1.12 µg/g), Mn (0.98 µg/g), Zn (0.29 µg/g), Cr (0.26 µg/g), Cu (0.22 µg/g) and Ni (0.06 µg/g) respectively. Therefore, strongly support our current results. Moreover, in current study the concentrations of essential and trace metals in marble industry powder were within the permissible limits of world average shale value proposed by [Citation54,Citation55]. It was further reported that in marble processing plants, dust and effluents from crushing of the marble stone were released into the surroundings that contain heavy metals which is a major possible source of water and soil pollution [Citation3,Citation56].
Heavy metals content level in paddy soil
Concentrations of essential and trace heavy metals of the selected paddy soil sites () were summarized in (. Among macronutrients, mean maximum concentration was observed for Ca (413.0 ± 65.5 mg/kg) at downstream followed by K (52.3 ± 12.5 mg/kg) at upstream (). According to (Ali et al., Citation36) macronutrients exist in higher proportions in the upper horizons of the earth core are comprised of main elements in parent rock. Moreover, these elements are vital for plant growth due to its mobile nature, transformed easily by liberating cations and insignificantly change soil pH and are commonly not categorized as hazardous elements. The concentrations of Ca and K in current soil samples was found lower than the average world shale values reported by [Citation54]. In other study [Citation57] also reported a higher concentration of Ca (36,675.5 mg/kg), K (18,927 mg/kg) in soil sample of Peshawar valley Pakistan [Citation42]. reported an average higher Ca and K level for the soil of Chhattisgarh (India), suggests a higher volume of Ca and K in earth crust. The heavy metal distribution in paddy soil was found to be in the order of Si > Fe > Al > Ti > Mn > Sr > Zr > Zn > Cu > Ni > V > Rb > Y > Cr. The data presented in () obviously demonstrated mean higher concentration for Fe (146.7 ± 15.3 mg/kg), Al (125.0 ± 18.0 mg/kg), Ti (42.3 ± 11.2 mg/kg), Mn (3.63 ± 0.70, mg/kg) Sr (3.17 ± 1.04 mg/kg), Zr (3.03 ± 1.27 mg/kg), Zn (2.60 ± 0.85 mg/kg), Cu (2.50 ± 1.32 mg/kg), Ni (2.2 ± 1.47 mg/kg), V (2.13 ± 1.10 mg/kg), Rb (2.03 ± 1.27 mg/kg), Y (2.0 ± 1.32 mg/kg) and Cr (1.86 ± 1.57 mg/kg) at downstream. The main reason for the elevated mean metal/metalloids contents at the downstream paddy soil is due to the buildup of marble industry effluents at this site [Citation16,Citation35]. However, the mean highest concentration of Si (514.7 ± 31.1 mg/kg) in upstream soil may be due to the weathering of river sediments and usage of rice hull residues [Citation58,Citation59]. The contents of Cr (1.86 mg/kg), Cu (2.50 mg/kg), Ni (2.2 mg/kg), and Zn (2.60 mg/kg) in the paddy soil near the marble industry was relatively higher than the adjacent agricultural fields as reported by [Citation11] for Cr (0.48 mg/kg), Cu (1.48 mg/kg), Ni (0.50 mg/kg) and Zn (0.414 mg/kg). In another study [Citation11] reported higher metal contents of Cr (724 mg/kg), Cu (55.64 mg/kg), Fe (23,720 mg/kg), Mn (760 mg/kg), Ni (406 mg/kg) and Zn (44.74 mg/kg) in nearby mining affected soil of district Malakand [Citation60]. also reported a mean higher level of Cr (19.3 mg/kg), Ni (21.8 mg/kg), Cd (1.4 mg/kg), Pb 22.7 mg/kg) in fish collected from river swat that irrigate most the paddy fields in study area. The literature study revealed that mining activities significantly affect the profile of agricultural lands of the study area [Citation61].
Heavy metal content level in rice plants and rice grains
Mean concentrations of essential and trace elements of rice crop raised in vicinity of the marble industry were summarized in (). Mean concentration of K (370.9 ± 178.6 mg/kg) and Ca (181.1 ± 126.2 mg/kg) was found higher in rice plant samples collected from marble industry and downstream sites. Proportion of Si (355.1 ± 130 mg/kg), Fe (126.4 ± 208.7 mg/kg), Cu (3.86 ± 3.30 mg/kg), Cr (3.15 ± 1.46), Zn (1.182 ± 0.625 mg/kg), Rb (0.42 ± 0.37 mg/kg) and Ni (0.89 ± 0.06) was maximum in rice plant samples of the downstream and marble industry sites (). Al and Mn showed mean higher concentration of (43.1 ± 18.90 mg/kg) and Mn (11.39 ± 6.51 mg/kg) in rice plant samples collected from upstream site (). In case of the rice grains mean higher concentration for K (441.9 ± 6.60 mg/kg), Fe (50.7 ± 9.79 mg/kg), Cu (17.6 ± 1.05), Mn (7.49 ± 2.21 mg/kg), Al (6.80 ± 0.90), Zn (4.96 ± 3.43 mg/kg), Rb (4.56 ± 2.18 mg/kg), Ni (0.90 ± 0.08) and Cr (0.70 ± 0.10) was reported at the downstream site respectively (). Mean maximum concentration for Ca (297.4 ± 4.90 mg/kg) in rice grains was recorded near marble industry site (). In rice grains mean maximum concentrations of Fe (50.7 ± 9.80 mg/kg), Cu (17.6 ± 1.05 mg/kg), Mn (7.49 ± 2.21 mg/kg) and Al (6.80 ± 0.90 mg/kg) exceeded than the permissible limits of 17, 3.0, 5.0 and 1.0 mg/kg set by [Citation62] (). Mean elevated concentration of Ca (297.4 ± 4.90 mg/kg), K (441.9 ± 6.60 mg/kg), Zn (4.96 ± 3.43 mg/kg), Ni (0.90 ± 0.08 mg/kg) and Cr (0.70 ± 0.10) in rice grains were within the respective permissible limits of [Citation62] which is (1000 mg/kg for Ca), (3500 for K, 20 for Zn), (10 mg/kg for Ni), and (2.3 mg/kg for Cr) respectively(). Silicon (Si) showed mean higher content of (355.1 ± 130 mg/kg) in rice plants while in grains accumulation of Si was not observed from respective study sites ().
According to [Citation64] potential mineral uptake of plant is a function of mineral contents in soil, its cation exchange capacity, pH, content of organic matter, age, and genetic makeup of the plants [Citation65]. reported that elevated levels of K and Ca in the rice plants and rice grains are possibly owing to the statistics that such elements are extremely mobile and easily translocated among the plant tissues. According to [Citation66] higher Ca and K concentrations may be due to the utilization of organic and inorganic fertilizers rich in these minerals. Our current results are supported by the study of [Citation11] who observed a lower background concentration for Cu (0.19 mg/kg), Mn (0.44 mg/kg) and Zn (0.13 mg/kg) in rice plants of adjacent area without the influence of marble industry. Likewise [Citation67], also reported comparatively mean lower concentration of Zn (1.9 mg/kg), Mn (1.6 mg/kg), Fe (1.4 mg/kg) and Cu (0.2 mg/kg) in Malagasy rice species. A slightly elevated level of Cu [4.9 mg/kg) in Chinese rice near the electroplating plant was reported by Citation68. (Citation69] reported a higher concentration of Cu (25 ppm), Zn (19 ppm), and Cr (14 ppm) in rice grains irrigated by paper mills effluents in Karnataka, India. A relative mean higher content of Fe (2525.364 mg/kg) and Cu (10.4 mg/kg) was investigated by [Citation70] in rice plants cultivated near Tajan river. The literature study revealed that the accumulation of metals in edible tissues of rice is due to the cultivation of crops on or near polluted soils [Citation15]. Moreover, the elevated level of K, Ca, Fe, and Mn in the media like soil, plant, grains represented their origin of twins, bioavailability and influence its order in the media [Citation71,Citation72]. reported that the mobility of metals from anthropogenic sources is comparatively more than lithogenic or pedogenic ones. In current study except Si and K, concentrations of the remaining metals in paddy soil near marble industry and downstream were comparatively higher than the upstream site (). Therefore, resulted higher metal concentration in rice plants and its grains of the respective study sites ().
Potential Human Health Risk Assessment through consumption of rice
Rice is one of the most stable staple foods in most countries consumed in routines in households, and especially in wedding functions in Pakistan [Citation73]. For the assessment of health risks owing to pollutants, estimation of exposure level is mandatory through quantification of the exposure routes of a toxin to a target organism [Citation74]. Many pathways like inhalation, ingestion, dermal contact led to human exposure to toxic metals. However, consumption of rice has been recognized as one of the main pathways of toxic metals that trigger harm to human health [Citation69]. To evaluate the potential human health risk, the EDI, HQ and HI of the eight elements (Al, Cr, Cu, Fe, Mn, Ni, Rb, Zn) were evaluated according to its average concentration in rice followed by the respective consumption rate in adults ().
Table 3. Estimated daily intake (EDI], Hazard quotient (HQ) and Hazard index (HI) from heavy metals through consumption of rice in District Malakand
Estimation of daily intake (EDI) (mg/ kg/person/day)
Estimated daily intake is a common index used for transfer of metal from plants to human [Citation75]. () showed estimated daily intake (EDI) of the trace elements through consumption of rice for adults. The average daily consumption of rice in Pakistan is 0.120 kg/person/day [Citation45]. The average estimated daily intake (EDI) were in the order of Fe (8.29E-02) > Cu (2.88E-02) > Mn (1.23E-02) > Al (1.12E-02) > Zn (8.11E-03) > Rb (7.46E-03) > Cr (1.22E-03) > Ni (1.48E-03) mg/kg/person/day respectively (). It was observed that the EDI of the eight elements (Al, Cr, Cu, Fe, Mn, Ni, Rb, Zn) for adults were lower than the provisional tolerable daily intake values (PTDI) as suggested by [Citation62,Citation76,Citation63]. The EDI of Al, Cr, Cu, Fe, Mn, Ni, and Zn were 0.87, 0.43, 5.17, 9.26, 2.63, 16.99 and 0.70% of the safe values which showed that the levels of Al, Cr, Cu, Fe, Mn, Ni and Zn were not that lower than reported in the rice grains (, ). Similar low EDI for Cr, Cu, Fe, Mn, Ni and Zn in rice grains has also been reported by [Citation77–79]. The EDI of the potential toxic metals via the consumption of rice followed the order: Fe > Cu > Mn > Al > Zn > Rb > Cr > Ni. The order agrees with the reports of [Citation77,Citation78,Citation80].
Hazard quotient (HQ)
The hazard quotient (HQ) is another useful factor for risk assessment which is linked with the intake of metal contaminated food crops [Citation81]. The hazard quotient of potential toxic elements for a 73.3 kg adult from rice consumption showed the order of Cu (6.46E-01) > Cr (2.90E-01) > Fe (1.06E-01) > Mn (6.76E-02) > Ni (4.25E-02) > Zn (2.32E-02) > Al (8.70E-03) respectively (). HQ for Rubidium (Rb) was not calculated due to unavailability of reference data in the literature. The hazard quotient (HQ) of all the individual studied elements was found less than unity, indicating no health risk from individual metal.
Hazard index (HI)
The hazard index (HI) is an indicator used to evaluate the combined noncarcinogenic effects of multiple elements [Citation48,Citation82]. In current study the hazard index (HI) for multiple elements through consumption of rice was greater than 1 in downstream (HI = 1.45) and marble industry (HI = 1.23) sites (). This indicates that adults that consume rice from these field might experience antagonistic health effect much later with bio accumulation of heavy metals over a period of time [Citation77]. A similar results were obtained by [Citation48] for rice and vegetables grown in the industrial areas of Bangladesh. The contribution of potential toxic metals to hazard index (HI) were in the order of Cu (55%) > Cr (25%) > Fe (9%) > Mn (6%) > Ni (4%) > Zn (2%) > Al (1%) respectively. This assessment only represents the ingestion of toxic metals through rice consumption. Besides, individuals of the local population are also subjected to other food sources that contain heavy metals such as vegetables, fish, milk, Chocolate powder, wheat, maize, fruit, and medicinal herbs [Citation11,Citation56,Citation83–86]. Hence, a regular monitoring of heavy metals in nutritional components is required to prevent the buildup of these metals in food chain.
Potential sources of the targeted heavy metals
The potential source of targeted heavy metals in marble powder, paddy soil, rice plants and in its grains were identified by the application of Pearson correlation coefficient (PCC), Principal component analysis (PCA), and Cluster analysis (CA). The Pearson correlation coefficient matrix values are presented in (). PCA was validated in view of (p < 0.001) in KMO and Bartlett sphericity test ().
Table 4. Pearson Correlation coefficient matrices between metal concentrations of paddy soil of District Malakand
Table 5. Pearson Correlation coefficient matrices between metal concentrations of (a) rice plants and (b) rice grains (n = 09) near marble industry District Malakand
Table 6. Correlation (Pearson) coefficient matrices between metal levels in soil (s) versus rice plants (p) ant its grains (g), and rice plants (p) versus grains (g) (n = 09)
Table 7. Rotated component matrix of heavy metals in marble powder, soil, rice plant, and grains
Principal component analysis (PCA) has received predominant attention for the determination of the source of heavy metals among the researchers [Citation87]. Two principal components were extracted for the targeted heavy metals of paddy soil using Varimax rotation with Kaiser normalization. The PCA of heavy metals of paddy soil showed a total variance of 71.466% with eigenvalues greater than 1.0 (). The cluster analysis of soil samples () classified these metals into four distinct clusters. The principal component one (PCI) accounted for a total variance of 61.214% and was dominated by high factor loadings of Rb (0.0954), Zr (0.940), V (0.918), Zn (0.862), and Ti (0.825). These elements are released in the form of dust from marble and granite rocks during mining activities, sculpturing, and making slices for the beautification of buildings, and are controlled by atmospheric process [Citation16]. According to [Citation88] coal mining was the major pollution source for Rb, Ti, and Zn in agricultural soil of Bangladesh [Citation89]. reported that the origin of Rb and Zr may be from natural sources while V was recognized as the main element of petroleum. The current paddy fields of the study area are irrigated by the river Swat, which is a large sink for a variety of contaminants of various industrial sectors and community sewage [Citation90]. Therefore, the source of the metals Rb, Zr, V and Zn in our study sites may be better described as anthropogenic.
Figure 2. Cluster analysis of metals (a) Paddy soil (b) Rice plant (c) grains (d) Marble powder using Ward linkage (SPSS version 25)
Rubidium (Rb), Zr, V, Zn, and Ti exhibited a significantly strong positive correlation (p < 0.05) with r = 0.955 for Rb and V, r = 0.951 for Rb and Zr, r = 0.853 for Rb and Zn, r = 0.830 for Rb and Ti, r = 0.941 for V and Zr, contribute to a common origin. Moreover, the results of cluster analysis were consistent with the PCA and correlation coefficient matrix. These metals are included in cluster one () and may share a common source. The principal component two (PC II) accounted for an eigenvalue of 1.640 with high factor loadings for Ca (0.739), Mn (0.714). Calcium and Mn also showed a strong positive correlation (p < 0.001) with r = 0.751 and included in cluster three (), and therefore indicated their common source of origin. According to [Citation91] marble typically contains chemical compounds i.e. CaO, MgO, Al2O3, Na2O, Fe2O3, P2O5, TiO2, and SiO2 [Citation92]. reported that due to frequent discharge of marble effluents into irrigation canals resulted contamination of water and soil as these effluents contain heavy metals like Mn, Fe, Zn, Cr, Cd, and Pb respectively [Citation92]. The higher concentration of Ca in surface water near marble quarrying of North Central Nigeria was anthropogenic as reported by [Citation93].
Similarly, for finding potential sources of heavy metals in rice plants, the principal component analysis via Varimax rotation with Kaiser normalization accounted for a total variance of 60.77% with an eigenvalue of 4.179 (). Similar to soil, the cluster analysis (CA) grouped the trace metals into three clusters (). The first principal component (PCI) associated with a total variance of 39.374% and was dominated by Zn, Fe, Al and Rb, holding a factor loading of 0.924, 0.908, 0.872 and 0.802 (). Hence, showed a strong inter-relationship among the metals [Citation94]. reasoned presence of Mn and Fe in fertilizers used for agricultural purposes. Likewise, a positive correlation (p < 0.01) was observed for Fe, Zn, Al and Rb with r value of 0.952 for Fe and Zn, r-value of 0.840 for Zn and Al, r-value of 0.825 for Fe and Al and r-value of 0.628 for Rb and Fe (). The result of cluster analysis () also included (Al, Fe, Zn, Rb) into cluster one, indicated a common source of these elements. The second principal component (PC II) was dominated by Ca and Mn that accounted for 21.395% of variance with factor loading of 0.814 and 0.581 (). The correlation coefficient between Ca and Mn was (r = 0.390), signifies a slight positive correlation at P < 0.01 level () and was included in cluster two (). Therefore, suggested a shared source of these elements.
It is quite essential to assess the quality of rice grains for total metal contents as rice is consumed worldwide on large scale [Citation95]. The principal component analysis (PCA) accounted for a cumulative variance of 70.759% with an eigenvalue greater than 1 [Citation96]. The cluster analysis of rice grains categorized the metals into three different clusters (). The principal component I (PC I) received a major contribution for Zn, Mn, Rb, Cu and Fe with a total variance of 43.185%, and with high loading factors of 0.941, 0.923, 0.905, 0.871 and 0.801 respectively (). Thus, indicated a strong association between these metals. A strong significant positive correlation (p < 0.01) was observed for Rb and Zn with an r-value of 0.899, Mn and Zn with an r-value of 0.899, Cu and Mn with an r-value of 0.818, Mn and Rb with an r-value of 0.816 (). Fe also showed a significant positive correlation (p < 0.05) with Mn (r = 0.750) and Zn (r = 0.726). Similarly, Cu was strongly positive correlated (p < 0.05) with Zn (r = 0.707), and Fe (r = 0.667) (). Therefore, all these metal pairs fell in cluster one () and evidenced a common source of these metal pairs. The principal component II (PC II), accounts for 27.574% of variance and was dominated by Ni, Al, Cr, and K with high loading factor of 0.901, 0.726 and 0.720 (). Result of strong positive correlation for Cr with Ni (r = 0.878), Al with Ni (r = 0.595) and K with Ni (r = 0.586) at (p < 0.01, P < 0.05) () indicate common source of these metal pairs and were included in cluster three (). K showed a strong negative correlation with Ca (r = −0.858) at (p < 0.01) and included in cluster two ().
To link up marble industry as a source of heavy metal contamination in paddy soil, and paddy crops, PCA was performed for the classification of metals in marble powder. Two principal components with eigenvalues greater than 1 were extracted that accounted for a total variance of 68.783%. Principal component one (PC I) accounts for 37.678 of variance () and was dominated with high factor loadings of Cr (0.842), K (0.832), Ni (0.787), Cu (0.773), Sr (0.739). The result of the PCA was consistent with the cluster analysis which indicated a strong association between these metal pairs in marble powder. The principal component two (PC II) with a total variance of 31.105% was dominated by Fe, Al, Mn, with factor loading of 0.941, 0.876), 0.800 (). The cluster analysis included these metals in one cluster (), implying the same source of origin. It was found that in paddy soil and marble powder, Cr are grouped with Ni, Fe with Si and Cu with Sr. Whereas in paddy plants and grains Fe, Rb and Zn were grouped together. These suggest that these metals might also share a common source and derived from the marble industry waste.
The correlation coefficient matrix for the elements of paddy soil, plants, and rice grains showed a slight positive correlation between Cr contents in the three media i.e. soil versus plant, soil versus grains and plant versus grains () showing that elevated Cr levels in rice plants originates from their increased levels in the soil. Similarly, the positive correlation between Cr of plants and Cr of grains () indicated that higher metal content led to absorption of Cr from the soil and then translocated to the grains [Citation95]. Ni contents also showed significant positive correlation in the three media (), evidencing that the source of elevated level in plants and rice grains originates from the particular level of soils which can then be translocated to edible parts [Citation95].The Cr and Ni concentrations in rice grains were within the permissible limits of [Citation62] (). However, prolong exposure to these metals via consumption of rice might cause health hazard among the people [96]. The essential elements like Ca, Fe and Mn displayed a slight positive correlation in soil versus rice grains, indicating translocation of the metals from soil to plant followed by their accumulation in rice grains. Unlike, the metalloid (Si) showed negative correlation with other studied metals in soil versus plant and soil versus grains indicating no translocation from soil to grains.
Conclusion
The key findings of the current study demonstrated that paddy fields near marble industry were highly enriched with essential and nonessential elements in the decreasing order of Ca > K > Si > Fe > Al > Ti > Mn > Sr > Zr > Zn > Cu > Ni > V > Rb > Y > Cr. The concentration of these elements in paddy soil was within the permissible limits set by the [Citation54]. Likewise, the average metal level in rice grains for Fe, Cu, Mn and Al were higher than the permissible limits of [Citation62]. The cumulative hazard index (HI) of the heavy metals exceeded than one (HI > 1) which showed a probable noncarcinogenic risk for the local population. From the current study, it was concluded that direct or indirect discharge of marble industrial waste into irrigation canals, agricultural field result heavy metal contamination of the soil, and subsequent accumulation of the heavy metals in rice plant tissues and may pose probable health risks for Human and livestock. The contamination source for paddy soil and rice plant of the study area was found to be predominantly anthropogenic.
Acknowledgments
The authors are thankful to the Centralized Resource Laboratory (CRL), University of Peshawar, Pakistan for provision of laboratory facilities. Additionally, the authors are thankful to Mr. Qaisar Khan BS Chemistry students at University of Malakand, Pakistan for their kind help during field sampling.
Disclosure statement
The authors declare that they have no known competing financial interests or personal relationships that could have appeared to influence the work reported in this paper.
References
- He B, Yun Z, Shi J, et al. Research progress of heavy metal pollution in China: sources, analytical methods, status, and toxicity. Chinese Science Bulletin. 2013;58(2):134–140.
- Peña-Fernández A, Lobo-Bedmar MC, González-Muñoz MJ. Annual and seasonal variability of metals and metalloids in urban and industrial soils in Alcalá de Henares (Spain). Environ Res. 2015;136:40–46.
- Ahmad Z, Khan SM, Ali MI, et al. Pollution indicandum and marble waste polluted ecosystem; role of selected indicator plants in phytoremediation and determination of pollution zones. J Clean Prod. 2019;236(July):117709.
- Aukour FJ, Al-Qinna MI. Marble Production and Environmental Constrains: case Study from Zarqa Governorate, Jordan. Jordan J. Earth Environ. Sci. 2008;1(1):11–21.
- Kabas S, Faz A, Acosta JA, et al. Effect of marble waste and pig slurry on the growth of native vegetation and heavy metal mobility in a mine tailing pond. J. Geochemical Explor. 2012;123:69–76.
- Lovett GM, Tear TH, Evers DC, et al. Effects of Air Pollution on Ecosystems and Biological Diversity in the Eastern United States. Ann N Y Acad Sci. 2009;1162(1):99–135.
- Zhang Q, Yu R, Fu S, et al. Spatial heterogeneity of heavy metal contamination in soils and plants in Hefei, China. Scientific Reports. 2019;9(1):1049.
- Hu Y, Cheng H. Application of Stochastic Models in Identification and Apportionment of Heavy Metal Pollution Sources in the Surface Soils of a Large-Scale Region. Environmental Science & Technology. 2013;47(8):3752–3760.
- Nagajyoti PC, Lee KD, Sreekanth TVM. Heavy metals, occurrence and toxicity for plants: a review. Environ Chem Lett. 2010;8(3):199–216.
- Bánfalvi G. Heavy Metals, Trace Elements and Their Cellular Effects. Cellular Effects of Heavy Metals. Springer Netherlands Dordrecht; 2011. 3–28. https://doi.org/10.1007/978-94-007-0428-2_1.
- Khan K, Lu Y, Khan H, et al. Heavy metals in agricultural soils and crops and their health risks in Swat District, northern Pakistan. Food and Chemical Toxicology. 2013;58:449–458.
- Stern BR. Essentiality and Toxicity in Copper Health Risk Assessment: overview, Update and Regulatory Considerations. J. Toxicol. Environ. Heal. Part A. 2010;73(2–3):114–127.
- Shah MT, Ara J, Muhammad S, et al. Health risk assessment via surface water and sub-surface water consumption in the mafic and ultramafic terrain, Mohmand agency, northern Pakistan. J. Geochemical Explor. 2012;118:60–67.
- Cheng S. Heavy metal pollution in China: origin, pattern and control. Environ Sci Pollut Res. 2003;10(3):192–198.
- Khan NH, Nafees M, Bashir A. Study of Heavy Metals in Soil and Wheat Crop and their Transfer to Food Chain. Sarhad Journal of Agriculture. 2016;32(2):70–79.
- Mulk S, Azizullah A, Korai AL, et al. Impact of marble industry effluents on water and sediment quality of Barandu River in Buner District, Pakistan. Environ Monit Assess. 2015;187(2):8.
- Abbas S, Sarfaraz M, Mehdi S, et al. Trace elements accumulation in soil and rice plants irrigated with the contaminated water. Soil Tillage Res. 2007;94(2):503–509.
- Zhuang P, McBride MB, Xia H, et al. Health risk from heavy metals via consumption of food crops in the vicinity of Dabaoshan mine, South China. Sci Total Environ. 2009;407(5):1551–1561.
- Specht AJ, Obrycki JF, Mazumdar M, et al. Feasibility of Lead Exposure Assessment in Blood Spots using Energy-Dispersive X-ray Fluorescence. Environ Sci Technol. 2021;55(8):5050–5055.
- West M, Ellis AT, Potts PJ, et al. Atomic spectrometry update–X-ray fluorescence spectrometry. J Anal At Spectrom. 2010;25(10):1503.
- Yao M, Wang D, Zhao M. Element Analysis Based on Energy-Dispersive X-Ray Fluorescence. Adv Mater Sci Eng. 2015;2015:1–7.
- Daly K, Fenelon A. Application of Energy Dispersive X-ray Fluorescence Spectrometry to the Determination of Copper, Manganese, Zinc, and Sulfur in Grass (Lolium perenne) in Grazed Agricultural Systems. Appl Spectrosc. 2018;72(11):1661–1673.
- Hou X, He Y, Jones BT. Recent Advances in Portable X‐Ray Fluorescence Spectrometry. Appl Spectrosc Rev. 2004;39(1):1–25.
- Sosa P, Guild G, Burgos G, et al. Potential and application of X-ray fluorescence spectrometry to estimate iron and zinc concentration in potato tubers. J Food Compos Anal. 2018;70:22–27.
- Zacco A, Resola S, Lucchini R, et al. Analysis of settled dust with X-ray Fluorescence for exposure assessment of metals in the province of Brescia, Italy. J. Environ. Monit. 2009;11(9):1579.
- Guild GE, Paltridge NG, Andersson MS, et al. An energy-dispersive X-ray fluorescence method for analysing Fe and Zn in common bean, maize and cowpea biofortification programs. Plant Soil. 2017;419(1–2):457–466.
- Stankey JA, Akbulut C, Romero JE, et al. Evaluation of X-ray fluorescence spectroscopy as a method for the rapid and direct determination of sodium in cheese. J Dairy Sci. 2015;98(8):5040–5051.
- Paltridge NG, Milham PJ, Ortiz-Monasterio JI, et al. Energy-dispersive X-ray fluorescence spectrometry as a tool for zinc, iron and selenium analysis in whole grain wheat. Plant Soil. 2012;361(1–2):261–269.
- Hussain S 2016. Species diversity of basidiomycetes of district Malakand. PhD Dessertation,Department of Botany, Hazara University. pp 1–249.http://prr.hec.gov.pk/jspui/handle/123456789/7580
- Malkani MS, Mahmood Z, Alyani MI, et al. Mineral Resources of Khyber Pakhtunkhwa and FATA, Pakistan. Geol. Surv. Pakistan, Inf. Release. 2017;996(November):1–61.
- Gandapur SUK, Sareer A, Ali S, et al. Crop Statistics Khyber Pakhtunkhwa Government of Khyber Pakhtunkhwa Crop Reporting Services Agriculture, Livestock and Cooperation Department. Peshawar: Government of Khyber Pakhtunkhwa; 2017. p. 11–20.
- Iqbal M, Khalid N, Sajjad M, et al. Farmers field schools and rice productivity: an empirical analysis of District Malakand. Sarhad J. Agric. 2012;28(1):143–149.
- Noreen U, Ahmed Z, Khalid A, et al. Water pollution and occupational health hazards caused by the marble industries in district Mardan, Pakistan. Environ Technol Innov. 2019;16:100470.
- Zorluer I, Gucek S. The effects of marble dust and fly ash on clay soil. Science and Engineering of Composite Materials. 2014;21(1):59–67.
- Hashem HA, Hassanein RA, El-Deep MH, et al. Irrigation with industrial wastewater activates antioxidant system and osmoprotectant accumulation in lettuce, turnip and tomato plants. Ecotoxicology and Environmental Safety. 2013;95:144–152.
- Ali F, Ullah H, Khan I. Heavy Metals Accumulation in Vegetables Irrigated with Industrial Influents and Possible Impact of such Vegetables on Human Health. Sarhad J. Agric. 2017;33:3.
- Jha A, Dubey R. Carbohydrate metabolism in growing rice seedlings under arsenic toxicity. J Plant Physiol. 2004;161(7):867–872.
- Chai B, Liu C, Wang C, et al. Photocatalytic hydrogen evolution activity over MoS 2 /ZnIn 2 S 4 microspheres. Chin J Catal. 2017;38(12):2067–2075.
- Lucchini RG, Albini E, Benedetti L, et al. High prevalence of parkinsonian disorders associated to manganese exposure in the vicinities of ferroalloy industries. Am J Ind Med. 2007;50(11):788–800.
- Nyakuma BB, Wong S, Oladokun O. Non-oxidative thermal decomposition of oil palm empty fruit bunch pellets: fuel characterisation, thermogravimetric, kinetic, and thermodynamic analyses. Biomass Convers Bioref. 2019. https://doi.org/10.1007/s13399-019-00568-1
- Shqiarat M, Alnawafleh DH, Abudanah F. Characterization and provenance study of marble from udhruh, southern Jordan. Mediterr. Archaeol. Archaeom. 2019;19:1–8.
- Bilo F, Lodolo M, Borgese L, et al. Evaluation of Heavy Metals Contamination from Environment to Food Matrix by TXRF: the Case of Rice and Rice Husk. J Chem. 2015;2015:1–12.
- Bhatti SS, Kumar V, Kumar A, et al. Potential carcinogenic and non-carcinogenic health hazards of metal(loid)s in food grains. Environ Sci Pollut Res. 2020;27(14):17032–17042.
- Khan AZ, Khan S, Khan MA, et al. Biochar reduced the uptake of toxic heavy metals and their associated health risk via rice (Oryza sativa L.) grown in Cr-Mn mine contaminated soils. Environmental Technology & Innovation. 2020;17:100590.
- Mahmood A, Malik RN, Li J, et al. Human health risk assessment and dietary intake of organochlorine pesticides through air, soil and food crops (wheat and rice) along two tributaries of river Chenab, Pakistan. Food Chem Toxicol. 2014;71(June):17–25.
- Imran M, Khan N, Shah AA, et al. Overweight and Obesity Prevalence Pattern and Associated Risk Factors Among the People of Malakand Division, Khyber Pakhtunkhwa Pakistan. Arab J Sci Eng. 2019;44(1):65–74.
- Harper BL, Maugh AD, Jarvis MK, et al. Toxicology Profiles of Chemical and Radiological Contaminants At. Vol. 99352. Washington 1995.1–193
- Proshad R, Kormoker T, Islam MS, et al. Potential health risk of heavy metals via consumption of rice and vegetables grown in the industrial areas of Bangladesh. Hum. Ecol. Risk Assess. An Int. J. 2020;26(4):921–943.
- USEPA. 2012. Integrated Risk Information System (IRIS).Www.Epa.Gov/Iris Accessed 15 June 2013. pp.
- Ametepey ST, Cobbina SJ, Akpabey FJ, et al. Health risk assessment and heavy metal contamination levels in vegetables from Tamale Metropolis, Ghana. Int J Food Contam. 2018;5(1):5.
- Zamani AA, Yaftian MR, Parizanganeh A. Multivariate statistical assessment of heavy metal pollution sources of groundwater around a lead and zinc plant. Iranian Journal of Environmental Health Science & Engineering. 2012;9(1):29.
- Kormoker T, Proshad R, Islam MS, et al. Concentrations, source apportionment and potential health risk of toxic metals in foodstuffs of Bangladesh. Toxin Rev views. 2020;0(0):1–14.
- Islam MS, Ahmed MK, Habibullah-Al-Mamun M. Apportionment of heavy metals in soil and vegetables and associated health risks assessment. Stoch. Environ. Res. Risk Assess. 2016;30(1):365–377.
- Turekian KK, Wedepohl KH. Distribution of the Elements in Some Major Units of the Earth’s Crust. GSA Bull. 1961;72(2):175–192.
- Wedepohl K. The composition of the continental crust. Geochim Cosmochim Acta. 1995;59(7):1217–1232.
- Mulk S, Korai AL, Azizullah A, et al. Marble industry effluents cause an increased bioaccumulation of heavy metals in Mahaseer (Tor putitora) in Barandu River, district Buner, Pakistan. Environ Sci Pollut Res Int. 2017;24(29):23039–23056.
- Siddiqui S, Khattak RA, Heavy metals distribution in the soils of Peshawar valley, Northern-Pakistan. 2012;Sci. Res. Essays. 7:544–552.
- Cornelis J-T, Delvaux B, Georg RB, et al. Tracing the origin of dissolved silicon transferred from various soil-plant systems towards rivers: a review. Biogeosciences. 2011;8(1):89–112.
- Pereira HS, Korndörfer GH, De A, et al. Silicon sources for rice crop. Sci. Agric. 2004;61(5):522–528.
- Ali H, Khan E. Bioaccumulation of Cr, Ni, Cd and Pb in the Economically Important Freshwater Fish Schizothorax plagiostomus from Three Rivers of Malakand Division, Pakistan: risk Assessment for Human Health. Bull Environ Contam Toxicol. 2019;102(1):77–83.
- Nawab J, Khan S, Shah MT, et al. Quantification of Heavy Metals in Mining Affected Soil and Their Bioaccumulation in Native Plant Species. Int J Phytoremediation. 2015;17(9):801–813.
- FAO/WHO. 2011. Evaluation of Certain Contaminants in Food: seventy-Second Report of the Joint FAO/WHO Expert Committee on Food Additives. World Health Organization, Geneva PP - Geneva, 1–115 pp.
- JEFCA. Joint FAO/WHO Expert Committee on Food Additives, Summary and Conclusions of the 61st Meeting of the Joint FAO/ WHO Expert Committee on Food Additives. JECFA/61/SC. Rome Italy. 2005;7–17
- Neina D. The Role of Soil pH in Plant Nutrition and Soil Remediation. Appl. Environ. Soil Sci. 2019;2019:1–9.
- Jorhem L, Åstrand C, Sundström B, et al. Elements in rice from the Swedish market: 1. Cadmium, lead and arsenic (total and inorganic). Food Addit. Contam. Part A. 2008;25(3):284–292.
- Belayneh T, Zemene A, Madhusudhan A. International Journal of Modern. Int. J. Mod. Chem. Appl. Sci. 2015;2(1):65–72.
- Ravoson HN, Harinoely M, Andriamahenina NN, et al. Quantitative Analysis of Nutrient Minerals in Malagasy Rice Species by EDXRF and Dietary Intake Assessment. Am. J. Appl. Chem. 2019;7(5):137.
- Fazeli MS, Khosravan F, Hossini M, et al. Enrichment of heavy metals in paddy crops irrigated by paper mill effluents near Nanjangud, Mysore District, Karnatake, India. Environ. Geol. 1998;34(4):297–302.
- Liu J, Zhang X-H, Tran H, et al. Heavy metal contamination and risk assessment in water, paddy soil, and rice around an electroplating plant. Environ Sci Pollut Res. 2011;18(9):1623–1632.
- Vatanpour N, Feizy J, Hedayati Talouki H, et al. The high levels of heavy metal accumulation in cultivated rice from the Tajan river basin: health and ecological risk assessment. Chemosphere. 2020;245:125639.
- Garcia WJ, Blessin CW, Inglett GE, et al. Metal accumulation and crop yield for a variety of edible crops grown in diverse soil media amended with sewage sludge. Environ Sci Technol. 1981;15(7):793–804.
- Rafique N, Tariq SR. Distribution and source apportionment studies of heavy metals in soil of cotton/wheat fields. Environ Monit Assess. 2016;188(5):309.
- Sarwar T, Khan S, Yu X, et al. Analysis of Arsenic concentration and its speciation in rice of different markets of Pakistan and its associated health risk. Environ Technol Innov. 2021;21:101252.
- Rehman ZU, Khan S, Brusseau ML, et al. Lead and cadmium contamination and exposure risk assessment via consumption of vegetables grown in agricultural soils of five-selected regions of Pakistan. Chemosphere. 2017;168:1589–1596.
- Bian B, Zhou LJ, Li L, et al. Risk assessment of heavy metals in air, water, vegetables, grains, and related soils irrigated with biogas slurry in Taihu Basin, China. Environ Sci Pollut Res Int. 2015;22(10):7794–7807.
- JEFCA. 2000. Evaluation of certain food additives and contaminants : fifty-third report of the Joint FAO/WHO Expert Committee on Food Additives by Joint FAO/WHO Expert Committee on Food Additives (53rd meeting Rome, Italy. 1–136.
- Ezeofor CC, Ihedioha JN, Ujam OT, et al. Human health risk assessment of potential toxic elements in paddy soil and rice (Oryza sativa) from Ugbawka fields, Enugu, Nigeria. Open Chem. 2019;17(1):1050–1060.
- Ihedioha JN, Abugu HO, Ujam OT, et al. Ecological and human health risk evaluation of potential toxic metals in paddy soil, rice plants, and rice grains (Oryza sativa) of Omor Rice Field, Nigeria. Environ Monit Assess. 2021. https://doi.org/10.1007/s10661-021-09386-3
- Ihedioha JN, Ujam OT, Nwuche CO, et al. Assessment of heavy metal contamination of rice grains (Oryza sativa) and soil from Ada field, Enugu, Nigeria: estimating the human healtrisk. Human and Ecological Risk Assessment: An International Journal. 2016;22(8):1665–1677.
- Mohammadi AA, Zarei A, Majidi S, et al. Carcinogenic and non-carcinogenic health risk assessment of heavy metals in drinking water of Khorramabad, Iran. MethodsX. 2019;6:1642–1651.
- Giri S, Singh AK. Human health risk assessment due to dietary intake of heavy metals through rice in the mining areas of Singhbhum Copper Belt, India. Environmental Science and Pollution Research. 2017;24(17):14945–14956.
- Cao L, Lin C, Gao Y, et al. Health risk assessment of trace elements exposure through the soil- plant (maize) human contamination pathway near a petrochemical industry complex, Northeast China *. Environ Pollut. 2020;263:114414.
- Ali H, Khan E, Ilahi I. Environmental Chemistry and Ecotoxicology of Hazardous Heavy Metals: environmental Persistence, Toxicity, and Bioaccumulation. J Chem. 2019;2019:1–14.
- Mushtaq T, Bahadur A, Shah Z, et al. Elemental and Nutritional analysis and Ethnomedicinal Study of Selected Wild Plants Species of District Swabi. Khyber Pakhtunkhwa, Pakistan. 2012;5(9):4910–4913.
- Nawab J, Farooqi S, Xiaoping W, et al. Levels, dietary intake, and health risk of potentially toxic metals in vegetables, fruits, and cereal crops in Pakistan. Environ Sci Pollut Res. 2018;25(6):5558–5571.
- Sajad MA, Khan MS, Bahadur S, et al. Evaluation of chromium phytoremediation potential of some plant species of Dir Lower, Khyber Pakhtunkhwa, Pakistan. Acta Ecol. Sin. 2020;40(2):158–165.
- Lv J, Liu Y, Zhang Z, et al. Identifying the origins and spatial distributions of heavy metals in soils of Ju country (Eastern China) using multivariate and geostatistical approach. J Soils Sediments. 2015;15(1):163–178.
- Bhuiyan MAH, Parvez L, Islam MA, et al. Heavy metal pollution of coal mine-affected agricultural soils in the northern part of Bangladesh. J Hazard Mater. 2010;173(1–3):384–392.
- Li X, Feng L. Multivariate and geostatistical analyzes of metals in urban soil of Weinan industrial areas, Northwest of China. Atmospheric Environment. 2012;47:58–65.
- Liu M, Xu Y, Nawab J, et al. Contamination features, geo-accumulation, enrichments and human health risks of toxic heavy metal(loids) from fish consumption collected along Swat river, Pakistan. Environ Technol Innov. 2020;17:100554.
- Knoche R, Dingwell DB, Webb SL. Melt densities for leucogranites and granitic pegmatites: partial molar volumes for SiO2, Al2O3, Na2O, K2O, Li2O, Rb2O, Cs2O, MgO, CaO, SrO, BaO, B2O3, P2O5, F2O−1, TiO2, Nb2O5, Ta2O5, and WO3. Geochimica et Cosmochimica Acta. 1995;59(22):4645–4652.
- Haq F, Saeed K. Pollution load in industrial effluent and ground water due to marble industries in district buner, khyber pakhtunkhwa, Pakistan. Int. J. Recent Sci. Res. 2012;3:366–368.
- Ako TA, Onoduku US, Waziri SH, et al. Assessment of the environmental impacts of marble quarrying on surface water at Kwakuti, Niger state, North Central Nigeria. Int. J. Eng. Adv. Res. Technol. 2015;1(1):64–70.
- Kumru MN, Bakaç M. R-mode factor analysis applied to the distribution of elements in soils from the Aydın basin, Turkey. Journal of Geochemical Exploration. 2003;77(2–3):81–91.
- Tariq SR, Rashid N. Multivariate analysis of metal levels in paddy soil, rice plants, and rice grains: a case study from Shakargarh, Pakistan. J Chem. 2013;2013. https://doi.org/10.1155/2013/539251
- Usman K, Al-Ghouti MA, Abu-Dieyeh MH. The assessment of cadmium, chromium, copper, and nickel tolerance and bioaccumulation by shrub plant Tetraena qataranse. Sci Rep. 2019;9(1):1–11.