
 ?Mathematical formulae have been encoded as MathML and are displayed in this HTML version using MathJax in order to improve their display. Uncheck the box to turn MathJax off. This feature requires Javascript. Click on a formula to zoom.
ABSTRACT
Understanding the concentration of agricultural topsoil heavy metals and their spatial variability is crucial in terms of keeping a close track of the quality of regional environment. In this study, a total of 139 sites were sampled from the agricultural topsoils in Xuzhou area, Jiangsu, China. The contents of eight hazardous heavy metals (Cu, Zn, Ni, Pb, Cr, Hg, As, Cd) were measured for each soil sample. We used semivariogram to study the spatial patterns of these heavy metals, and obtained their spatial distribution maps in Xuzhou area. The descriptive statistics and the correlation between each heavy metal were examined. Our data show that the concentrations of all eight hazardous heavy metals do not exceed the threshold values that are recommended in the national soil quality standard (GB15618–2018). These new results provide a useful basis for the policy design regarding the agriculture, industry, topsoil contamination treatment, and regional environment in this region.
1. Introduction
The quality of the agricultural topsoils is critical for policy design in order to use the land properly, control the topsoil contamination level, and establish an environmentally friendly ecosystem in the urban area. Heavy metals in agricultural topsoils are very useful in order to reflect the contamination level of regional environment, and the most commonly studied hazardous heavy metals are Cu, Zn, Ni, Pb, Cr, Hg, Ad, and Cd [Citation1–5]. To evaluate the agricultural topsoil quality in the right manner, it is important to consider not only the concentration but also the spatial distribution of the heavy metals [Citation6,Citation7]. One of the difficulties associated with the provenance analysis of the heavy metals in the topsoils is that often time there is more than one source of pollution, such as emission from vehicles, pollution from coal burning, and wasters generated by factories, etc. Moreover, any contamination of agricultural topsoils could potentially lead to groundwater contamination, which, in turn, contaminates an even larger range of the topsoils since the heavy metals are highly mobile [Citation3, Citation8,Citation9]. Therefore, topsoil heavy metal contents are of great importance regarding the safety of the farmland products, and the agricultural economy [Citation10,Citation11].
Geostatistical analysis has been routinely used in the spatial mapping of topsoil heavy metals [Citation12,Citation13,Citation14,Citation15,Citation16]. For instance, the semivariogram can reveal the spatial variations of the sample values in the background of the regional values. The Kriging interpolation can reflect the spatial correlation in the function of distance or direction, which provides an explanation for the spatial variations on a regional scale. However, it is worthwhile to point out that even though the geostatistics has been successfully applied to many studies, it is still debated how the sampling resolution could affect the final conclusion of the studies [Citation17].
The industry of Xuzhou area heavily concentrates on coal-mining. However, the spatial distribution of the agricultural topsoil heavy metals has not gained much attention [Citation18]. In this study, the spatial distribution and variability of eight hazardous heavy metals (Cu, Zn, Ni, Pb, Cr, Hg, As, Cd) was studied using techniques including geostatistics and geographical information system (GIS) in order to investigate the spatial distribution of these heavy metals and hence, offer valuable suggestions for the regional soil quality management.
2. Materials and methods
2.1. Study area overview
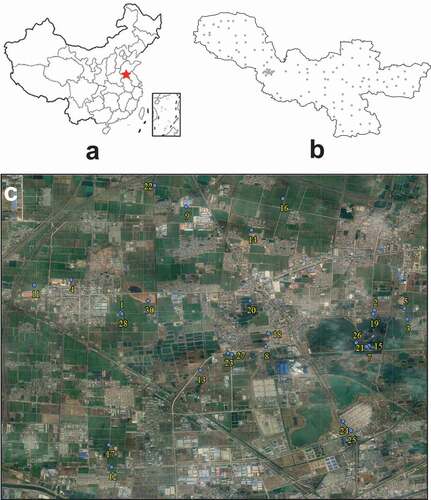
This study focuses on the agricultural topsoils in Xuzhou area (GPS: 34.2°N, 117.3°E), which lies in the northwestern corner of the Jiangsu Province, China (). Xuzhou is well-known as one of the major coal-mining cities in China, with a total area of 11,258 km2. The landform of Xuzhou is overall flat but becomes hilly in the central and east areas. The climate is characterized by the temperate continental monsoon, and the mean annual precipitation and temperature are 900 mm and 14°C, respectively.
Figure 1. (a) The map of China, with the red star showing the location of the Xuzhou area. (b) Sample locations in the Xuzhou area. (c) An example of the distribution of samples with the background of a satellite image
2.2. Chemical analyses
Sampling sites were designed in order to be spatially representative for the agricultural topsoils in Xuzhou area, and were also distributed in a way to help employ geostatistical analysis (). A total of 139 samples were collected from the topsoils within a depth of 0–15 cm, of which 89 samples were collected from Citation19. Sample locations are shown in . At each sampling site, 3 subsamples of surface soil were collected and mixed thoroughly to obtain an approximate 1 kg soil sample. The soil specimens were carefully cleaned by a wooden spatula in order to remove any potential contamination by metal, plant remains, and roots, etc. Foreign rock pieces were also picked out. Then, samples were air-dried at room temperature and sieved using a 150 µm size sieve.
The sieved soil samples were digested by HCl–HNO3–HClO4–HF and the concentrations of Cu, Zn, Ni, Pb, Cr, Cd were determined by an Agilent 7700 Series inductively coupled plasma mass spectrometry (ICP–MS). Hg and As concentrations were measured by an atomic fluorescence spectrometer (AFS-8330, Jitian Analytical Instrument Co., Beijing, China) after the digestion of HNO3–HCl for Hg analysis and HCl–CH4N2S for As. The standard reference materials (GSS–3 and GSS–13) were used in all analyses to control the accuracy of measurement with recoveries of 88.4–115.2% for 8 heavy metals. Raw data of the heavy metal concentrations can be found in supplementary Table S1.
2.3. Statistical analyses
Conventional statistical methods and histograms are only descriptive, which are unable to take the spatial distribution of the data into consideration. The four commonly used linear geostatistical methods are, specifically, the variances of estimation, dispersion, regularization, and kriging. However, these methods only incorporate the structural function of the random function, i.e. covariance or variogram. On the opposite, the geostatistical analysis usually starts with constructing a model in order to characterize the spatial structure of the regionalized variables, such as the heavy metals in the topsoils. The prerequisite to the application of geostatistics is that the presence of a spatial structure where observations close to each other are more similar than those that are far apart (spatial autocorrelation) [Citation20]. The average degree of dissimilarity between a sampled value and a nearby sample value can be determined by experimental semivariogram [Citation21]. Therefore, it can give autocorrelation at various distances.
Geostatistics uses the method called semivariogram to obtain the spatial variability of a regionalized variable, and provides the input parameters for the spatial interpolation of kriging [Citation22]. The value of the experimental semivariogram for a separating distance of h (referred to as the lag distance) is half of the average squared difference between the value at Z(xi) and at Z(xi+h),
where N(h) is the total number of paired sample points separated by the lag distance h. For the sampling at an irregular interval, the distances between the sample pairs are unlikely to be exactly equal to h. Hence, the lag distance h is often represented by a distance band. Z(xi) is the measured sample value at the point i, and Z(xi + h) is measured sample value at point i + h (EquationEquations (1)(1)
(1) and (Equation2
(2)
(2) )). The variogram model is chosen out of a set of functions (e.g. linear, gaussian, spherical, exponential) that could best describe the spatial relationships [Citation23]. We determine a model as appropriate if the chosen model can best-fit the shape of the curve of the experimental variogram to the shape of the curve of the mathematical function [Citation23]. The fitted model provides information about the spatial structure as well as the variogram parameters (range, sill, and nugget) for kriging interpolation. By using the appropriate variogram model, the distance-dependent coefficients can also be estimated and graphically interpreted [Citation23]. Raw data were analyzed with the help of various software packages. The descriptive statistical parameters were calculated using SPSS statistics software. The geostatistical analyses and the probability calculation were carried out using VarioWin software. Semivariograms were made using GS+ software. The maps of eight heavy metal elements spatial distributing pattern were generated using ArcGIS software by kriging interpolation.
3. Results and discussion
3.1. Agricultural topsoil heavy metal concentrations and correlations
Raw data were evaluated and the descriptive statistical parameters of eight topsoil heavy metals are summarized in . Based on the results, none of eight heavy metals pass the Kolmogorov–Smirnov (K–S) test of normality [Citation24] . However, in order to perform geostatistical analysis, the normal distribution is required. Therefore, the data were transformed to follow a lognormal distribution first.
Table 1. Summary of statistical parameters of topsoil heavy metals (unit: mg/kg)
Results show that all eight heavy metals exhibit a large range of values within the study area. For example, the maximum values of each heavy metal are usually a couple of, sometimes even more than ten times of the minimum values (). The median and mean values are close to each other. However, when compared with the regional background or the mean values of China, several heavy metals show high concentrations in the topsoils. Specifically, Cu, Zn, Ni, Pb, Hg, and As show mean values higher than China mean, which reflects that in the Xuzhou region, these heavy metals are potentially pollution sources, and can be used for the topsoil metal contamination assessment. In contrast, Cr and Cd have values lower than China mean, indicating these two metals are not the major concern in terms of the topsoil contamination in Xuzhou area. Considering that Xuzhou is a city famous for its production of coal, as well as its large amount of heavy industries, these heavy metals could be originated from a combination of these activates. It is also possible that the high contents of heavy metals in topsoils are caused by anthropogenic activity, such as the use of fertilizers and pesticides, vehicle emissions, industrial wastes, and pollution from coal burning especially in the winter. Based on the Standard of Chinese Environmental Quality for Soils (GB 15618–2018), none of the concentrations of these topsoil heavy metal is higher than the threshold values recommended for cultivated areas (), indicating that soil environmental quality in the study area was of little threat in terms of both human health, environment, and agricultural activities [Citation25].
All eight heavy metals show large values of their standard deviation (S.D.). The coefficient variation (C.V.) values of eight heavy metals in the study range from 0.25 to 0.97, suggesting that they vary moderately across the study area (). For instance, Cu has the highest C.V. value of 0.97, indicating that Cu is very likely to be influenced by extrinsic factors such as human activities. Cd is similar to Cu. On the opposite, Ni, Cr, and As have low C.V. values, meaning that these three metals are affected by intrinsic factors and have minimal variation. Their contents are nearly constant across the study area (). The rest of the heavy metals such as Zn, Pb, and Hg have C.V. values around 0.5, indicating that they have both extrinsic and intrinsic effects ().
We evaluated how these heavy metals correlate. The Pearson correlation coefficients and their significance levels between all the variables are presented in . We observed the strongest correlations between Zn and Pb (). Zn is also strongly correlated with Cd. The correlations between As and Ni and between As and Hg are also strong (). It is noted that lots of these heavy metals are chalcophile elements, meaning they prefer to bond with sulfur, and they are closely related to each other. Therefore, it is reasonable to see a correlation between them. On the contrary, Hg shows no or little correlation with Zn, As, and Cr (), suggesting that the Hg might have a distinct soil parent source compared to other heavy metals.
Table 2. Pearson correlation coefficients of topsoil heavy metals
3.2. Spatial structure and distribution of topsoil heavy metals
The semivariograms could help us understand the level of continuity of the heavy metals spatially, as well as their ranges of spatial dependence. Using the GS+ software, we modeled the eight heavy metals in the topsoils, and obtained their semivariograms parameters such as nuggets, sills, and ranges. The statistics of the semivariograms are summarized in . Results show that different models are needed in order to best fit different heavy metals. For examples, Cu, Pb, and Hg are fitted well with an exponential model, while Cd and Zn are better fitted using a linear model. For As and Ni, we used a spherical and a gaussian model, respectively (; ). The application of different semivariogram models indicates the fundamental differences in the spatial structure of each heavy metal.
Table 3. Semivariogram parameters and models of topsoil heavy metals
Figure 2. Semivariograms of topsoil heavy metals
Specifically, Hg and Cd have relatively larger nugget values compared with other heavy metals, suggesting they carry a strong variance within a shorter distance. On the opposite, the nugget values of As and Ni are small, indicating that they do not vary significantly in a short distance (; ). Sill values show the highest level of variance. In our dataset, Hg and Cd, spatially, vary the most, while metals like As, Ni, and Zn comparably do not show a high level of variance (). In terms of the range value, for Cd and Zn which are fitted by a linear model, their variances do not change with distance, and they have the largest range values, which means that the concentration of these metals in the topsoils might be dependent on the parent soils. Hg also has a large range value, meaning that it is more likely controlled by the original soil material. Instead, As, Cr, Cu, Ni, and Pb achieve their sill values within relatively small range values (), indicating their concentration might be affected by a hotspot that yields a radiating effect spatially.
We could use C0/(C+ C0) ratio to evaluate the spatial dependence of soil properties. Conventionally, if the C0/(C+ C0) ratio is above 75%, the variable only has weak spatial dependence. A C0/(C+ C0) value between 25% and 75% indicates a moderate spatial dependence, and a strong spatial dependence is expected when C0/(C+ C0) ratio is below 25% [Citation26]. Weak spatial dependence usually indicates extrinsic dominated factors such as anthropogenic activities, while strong spatial dependence is controlled by intrinsic dominated factors like parent soil materials etc. [Citation17, Citation20, Citation21]. The C0/(C+ C0) ratios of Hg and Cr are 41.8% and 25.1%, respectively (), which can be categorized as moderate spatial dependence, indicating that the anthropogenic factors changed their spatial correlation extrinsically through either fertilization or industrial production, or both. Cd and Zn have the largest C0/(C+ C0) ratios, consistent with their linear model fit. The C0/(C+ C0) ratios of As, Cu, Ni, and Pb are below 25% (), suggesting that these heavy metals have strong spatial dependence and are likely affected by intrinsic factors such as parent soil materials.
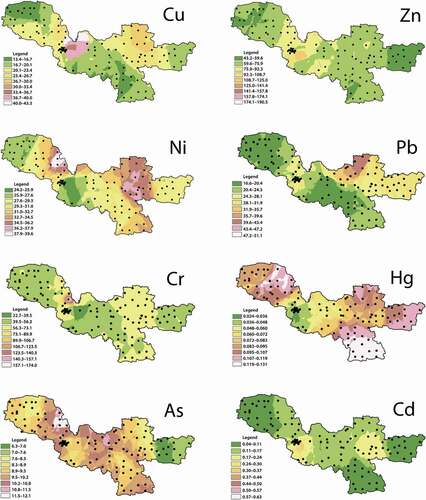
ArcGIS is commonly used to interpret spatial variability of heavy metals and to monitor the environment. Results of the semivariogram (e.g. range, sill, and nugget) were utilized to calculate sample weighing factors for spatial interpolation. A simple point kriging procedure was used in which the nearest 8 sampling sites and a maximum searching distance equal to the range distance of the variable were considered. Importantly, the mapping of the conditional probabilities of the properties of the topsoils is critical for policy making and agricultural and environmental management. The threshold values of this property would serve as the basis for the policy design, such as outlining safe or hazardous areas and identifying zones that are either suitable for crop growth or those that must be properly treated. In , the spatial distribution maps of eight heavy metals are shown, which are obtained from the semivariograms from the study area. Several heavy metals, like Ni, Pb, and Cu show similar geographic distributions, where the high contents are in the eastern Xuzhou area, and low contents are in the central and western of the area (). Zn, Cr, and Cd show near evenly distributed patterns, with similar values across the entire study area (). However, As shows a different pattern from all other heavy metals, with high content in the western and central Xuzhou area, and low content only in the eastern corner of the area (). Hg is a hazardous metal; the higher soil Hg concentrations are found in almost the entire region except for the southwest margin (). In general, the input of Cr and Ni to the topsoils from human activities such as fertilizers and limestone used in constructions is lower than the background value of the soil. Cu and Zn are commonly used in pesticides. Pb usually comes from manures, vehicle exhausts, and coal combustion. Especially important and relevant of the Xuzhou area is the production and use of coal, which reaches the maximum in the cold seasons. Coal burning could lead to high content of Hg, Zn, and Pb from air fallout [Citation27]. Cu, Zn, Pb, Cd, Hg, and As mainly result from a combination of anthropic activities such as industrial, agricultural, and transport. The sites with high-content of heavy metals are mostly in coincidence with the industry locations. All eight heavy metals that contain less than the threshold values, therefore, can be regarded as safe for crop growth in the Xuzhou area.
Figure 3. The spatial distribution maps of the eight heavy metal contents. unit: mg/kg
4. Conclusion
Using the topsoil samplings of the Xuzhou area, a total of eight hazardous heavy metal concentrations were measured. Results show that all heavy metals have a lognormal distribution. There are strong correlations between Zn and Pb, as well as Cd. A significant correlation was observed between As and Ni and between As and Hg, suggesting that they might have the same provenance, i.e. the same topsoil parent materials. The distribution and concentration of these heavy metals are likely influenced, to different degrees, by anthropic and industrial activities. Results from this study provide clear maps showing the spatial variability of eight heavy metals in the Xuzhou area. Our study is valuable for monitoring the quality of topsoils, which has useful implications for policy design in terms of topsoil management in the future. Importantly, all eight heavy metal contents are less than the national threshold values (GB15618–2018). Although these heavy metals are not yet a threat to the environment or to human health at present, they should be closely monitored. The variation of the heavy metal concentrations in the agricultural topsoils bear long-term meanings for improving agriculture and the ecosystem in the region.
Supplemental Material
Download MS Word (51.8 KB)Acknowledgments
This study is supported by Grants KC17155 and NYKJ8067. We thank the constructive comments from anonymous reviewers.
Disclosure statement
There are no relevant financial or non-financial competing interests to report.
Supplementary material
Supplemental data for this article can be accessed here.
Additional information
Funding
References
- Burguera JL, Burguera M, Rondon C. Lead in roadside soils of Merida City, Venezuela. SciTotal Environ. 1988;77(1):45–49.
- Kelly J, Thornton I, Simpson PR. Urban geochemistry: a study of the influence of anthropogenic activity on the heavy metal content of soils in traditionally industrial and non-industrial areas of Britain. Appl Geochem. 1996;11(1–2):363–370.
- Manta DS, Angelone M, Bellanca A, et al. Heavy metals in urban soils: a case study from the city of Palermo (Sicily), Italy. SciTotal Environ. 2002;300(1–3):229–243.
- Vardhan KH, Kumar PS, Panda RC. A review on heavy metal pollution, toxicity and remedial measures: current trends and future perspectives. J Mol Liq. 2019;290:111197.
- Yang Q, Li Z, Lu X, et al. A review of soil heavy metal pollution from industrial and agricultural regions in China: pollution and risk assessment. SciTotal Environ. 2018;642:690–700.
- Hu B, Shao S, Ni H, et al. Current status, spatial features, health risks, and potential driving factors of soil heavy metal pollution in China at province level. Environ Pollut. 2020;266:114961.
- Simasuwannarong B, Satapanajaru T, Khuntong S, et al. Spatial distribution and risk assessment of As, Cd, Cu, Pb, and Zn in topsoil at Rayong Province, Thailand. Water Air Soil Pollut. 2012;223(5):1931–1943.
- State Environmental Protection Administration of China, Chinese environmental quality standard for soils (GB15618–2018). in Chinese.
- Steinmann M, Stille P. Rare earth element behavior and Pb, Sr, Nd isotope systematics in a heavy metal contaminated soil. Appl Geochem. 1997;12(5):607–623.
- Dudka S, Piotrowska M, Chlopecka A. Effect of elevated concentrations of Cd and Zn in soil on spring wheat yield and the metal contents of the plants. Water, Air, and Soil Pollution. 1994;76(3–4):333–341
- Yang P, Mao R, Shao H, et al. The spatial variability of heavy metal distribution in the suburban farmland of Taihang piedmont plain, China. C R Biol. 2009a;332(6):558–566.
- Goovaerts P. Geostatistical modelling of uncertainty in soil science. Geoderma. 2001;103(1–2):3–26.
- Hu KL, Zhang FR, Hong L, et al. Spatial patterns of soil heavy metals in urban-rural transition zone of Beijing. Pedosphere. 2006;16(6):690–698.
- Shao HB, Chu LY, Lu ZH, et al. Primary antioxidant free radical scavenging and redox signaling pathways in higher plant cells. Int J Biol Sci. 2008;4(1):8–14.
- Shao HB, Chu LY, Shao MA. Calcium as a versatile plant signal transducer under soil water stress. BioEssays. 2008;30(7):634–641.
- Li J, Lu Y, Yin W, et al. Distribution of heavy metals in agricultural soils near a petrochemical complex in Guangzhou, China. Environ Monit Assess. 2009;153(1–4):365–375.
- Zhang H, Shan B. Historical records of heavy metal accumulation in sediments and the relationship with agricultural intensification in the Yangtze–Huaihe region, China. SciTotal Environ. 2008;399(1–3):113–120.
- Wang XS, Qin Y, Sang SX. Accumulation and sources of heavy metals in urban topsoils: a case study from the city of Xuzhou, China. Environ Geol. 2005;48(1):101–107.
- Xu L, Xiao X, Ma Y, et al. Sources and spatial distributions of heavy metals in Xuzhou farmland soils. Journal of Ecology and Rural Environment. 2019;35(11):1453–1459.
- Wang CX, Zhu W, Peng A, et al. Comparative studies on the concentration of rare earth elements and heavy metals in the atmospheric particulate matter in Beijing, China, and in Delft, the Netherlands. Environ Int. 2001;26(5–6):309–313.
- Sun B, Zhou S, Zhao Q. Evaluation of spatial and temporal changes of soil quality based on geostatistical analysis in the hill region of subtropical China. Geoderma. 2003;115(1–2):85–99.
- Webster R, Oliver MA. Geostatistics for environmental scientists. Hoboken, New Jersey: John Wiley & Sons.; 2007.
- Yang P, Mao R, Shao H, et al. An investigation on the distribution of eight hazardous heavy metals in the suburban farmland of China. J Hazard Mater. 2009b;167(1–3):1246–1251.
- Massey FJ Jr. The Kolmogorov-Smirnov test for goodness of fit. J Am Stat Assoc. 1951;46(253):68–78.
- Li P, Wang X, Zou X, et al. Metallic contamination in soils around a municipal solid waste incineration site: a case study in northeast China. Environ Sci Pollut Res. 2019;26(25):26339–26350.
- Shi J, Wang H, Xu J, et al. Spatial distribution of heavy metals in soils: a case study of Changxing, China. Environ Geol. 2007;52(1):1–10.
- Briffa J, Sinagra E, Blundell R. Heavy metal pollution in the environment and their toxicological effects on humans. Heliyon. 2020;6(9):e04691.